Last close As at 06/08/2026
—
— 0.00 (0.00%)
Market capitalisation
—
Research: TMT
EMIS reported respectable results for H120 considering the uncertainty in the NHS and COVID-19 restrictions. The company expects to meet consensus estimates for FY20 and announced an interim dividend of 16p (+3% y o y). We have made minor changes to forecasts. Work on the product roadmap is ongoing with the first new data analytics product due in Q4. In our view, the rapid shift to digital working during the pandemic supports and potentially accelerates the adoption of technology within healthcare in the longer term.
EMIS Group |
Balancing the near- and long-term view |
H120 results |
Software & comp services |
10 September 2020 |
Share price performance
Business description
Next events
Analyst
EMIS is a research client of Edison Investment Research Limited |
|||||||||||||||||||||||||||||||||||||||||||||
EMIS reported respectable results for H120 considering the uncertainty in the NHS and COVID-19 restrictions. The company expects to meet consensus estimates for FY20 and announced an interim dividend of 16p (+3% yoy). We have made minor changes to forecasts. Work on the product roadmap is ongoing with the first new data analytics product due in Q4. In our view, the rapid shift to digital working during the pandemic supports and potentially accelerates the adoption of technology within healthcare in the longer term.
Year end |
Revenue (£m) |
PBT* |
Diluted EPS* |
EMIS adj dil EPS** (p) |
DPS |
P/E |
12/18 |
149.7 |
33.4 |
40.4 |
45.0 |
28.4 |
27.9 |
12/19 |
159.5 |
41.0 |
53.5 |
51.1 |
31.2 |
21.1 |
12/20e |
158.8 |
43.3 |
55.7 |
49.3 |
32.0 |
20.2 |
12/21e |
164.1 |
44.0 |
56.4 |
53.1 |
34.0 |
20.0 |
Note: *PBT and EPS are normalised, excluding amortisation of acquired intangibles, exceptional items and share-based payments. **EMIS adjusted EPS – cash accounts for development costs and excludes exceptional items and amortisation of acquired intangibles.
Critical supplier to the NHS
EMIS took action early to prepare its workforce for lockdown and was able to provide support to its customers as they dealt with the pandemic. No staff were furloughed or made redundant. EMIS maintained market leading positions in all served healthcare markets and successfully transitioned over to the GP IT Futures framework in England. As expected, it was tougher to sign new business and revenue declined 2.1% y-o-y in H120; good cost control contained the decline in adjusted operating profit to 2.4% y-o-y. End H120 net cash was £44.1m and the company suggested it may consider more sizeable strategic M&A. Reflecting lower demand for Enterprise products in H1, we have reduced our revenue forecasts resulting in a 3% reduction to our adjusted EPS forecasts in FY21 and FY22.
Product development roadmap on track
In H1, EMIS balanced short-term work on software to manage COVID-19-related issues with continued investment in the strategic roadmap. The company announced the imminent launch of its first data analytics product from the newly unveiled EXA suite, providing medium-term growth opportunities for EMIS and a tool to help healthcare providers gain insights to provide better patient outcomes.
Valuation: Earnings growth to drive re-rating
The share price is essentially flat year-to-date and is 39% higher than its low of 813p on 18 March. Compared to a global group of healthcare software peers, EMIS trades at a premium on an EV/sales basis, and at a discount on all other metrics. EMIS generates significantly higher operating profit margins, but with slightly slower revenue growth, generates lower earnings growth. Its dividend yield is significantly ahead of the group. Key to closing the P/E discount will be evidence that revenue growth is returning to the company’s medium-term goal of mid- to high single-digit, in turn driving stronger earnings growth. We note that EMIS has good visibility (recurring revenue was 81% in H120) and a strong balance sheet with no debt.
Review of H120 results
Exhibit 1: EMIS Group results highlights
£m |
H119 |
H120 |
y-o-y |
Revenues |
79.8 |
78.1 |
(2.1%) |
Gross margin |
91.1% |
85.3% |
(5.8%) |
EBITDA |
25.8 |
25.2 |
(2.6%) |
EBITDA margin |
32.4% |
32.2% |
(0.2%) |
Normalised EBIT |
18.9 |
20.4 |
8.1% |
EMIS adjusted EBIT |
18.2 |
17.8 |
(2.4%) |
Reported EBIT |
12.0 |
16.6 |
38.2% |
Normalised EBIT margin |
23.6% |
26.1% |
2.4% |
EMIS adjusted EBIT margin |
22.8% |
22.8% |
(0.1%) |
Reported EBIT margin |
15.1% |
21.3% |
6.2% |
Net interest income |
(0.3) |
(0.1) |
(56.8%) |
Normalised PBT |
18.9 |
20.7 |
9.4% |
Reported PBT |
12.1 |
17.7 |
46.7% |
Tax |
(2.2) |
(3.4) |
50.6% |
Normalised net income after MI |
15.6 |
17.1 |
9.9% |
Reported net income after MI |
10.4 |
14.4 |
38.1% |
Normalised diluted EPS (p) |
24.5 |
27.1 |
10.3% |
EMIS adjusted diluted EPS (p) |
23.5 |
22.9 |
(2.6%) |
Reported basic EPS (p) |
16.6 |
22.9 |
38.0% |
Net cash excluding lease liabilities |
26.7 |
44.1 |
65.3% |
Source: EMIS. Note: Normalised: excludes amortisation of acquired intangibles, share-based payments and exceptionals; Adjusted: cash accounts for development costs, excludes amortisation of acquired intangibles and exceptionals.
EMIS reported H120 results in line with board expectations. Group revenue declined 2.1% y-o-y and the increased sale of lower-margin hardware resulted in a decline in the gross margin year-on-year. Recurring revenue increased 5% y-o-y to make up 81% of revenue (vs 76% in H119).
The company controlled costs well so that adjusted operating profit only declined 2.4% and adjusted EPS by 2.6% over the same period. Normalised operating profit and EPS were higher due to a step down in amortisation of capitalised development costs (£1.7m vs £3.6m in H119) and a step up in capitalised development costs (£4.1m vs £3.5m in H120). The reported tax charge of 19.2% was in line with the UK tax rate of 19%.
The company acquired community pharmacy software business Pinnacle in March. The acquisition contributed revenue of £0.7m and operating profit of £0.2m in H120, which implies that group organic revenue growth declined 3.0% y-o-y and adjusted operating profit declined 3.5% y-o-y.
Net cash excluding £7.3m of lease liabilities at the end of H120 stood at £44.1m. The company generated cash from operations of £36.6m; the company benefited from deferring a £7.3m VAT payment until 2021. Adjusted for capitalised development costs and the payment of previously accrued exceptional items, underlying cash from operations was £33.8m (+23% y-o-y).
The company spent £0.9m on tangible fixed assets, capitalised £1.7m of development costs and spent £0.1m on software licences. The business saw several cash inflows: £2.5m from the sale of the head office building in Leeds and £0.8m contingent consideration from the sale of the Specialist & Care business (treated as exceptional income). The company paid £2.9m (net of cash acquired) for the Pinnacle acquisition in March and paid £0.8m in contingent consideration for Dovetail (acquired in FY18).
The company announced an interim dividend of 16p per share, up from the 15.6p paid last year, demonstrating management’s confidence in the business.
Exhibit 2: Divisional performance
£m |
H119 |
H120 |
y-o-y |
Revenues |
|
|
|
EMIS Health |
50.3 |
54.0 |
7.4% |
EMIS Enterprise |
29.5 |
24.1 |
(18.3%) |
Total |
79.8 |
78.1 |
(2.1%) |
Adjusted operating profit |
|
|
|
EMIS Health |
10.8 |
11.9 |
10.4% |
EMIS Enterprise |
8.1 |
6.5 |
(19.9%) |
Central costs |
-0.7 |
-0.7 |
(7.8%) |
Total adjusted operating profit |
18.2 |
17.8 |
(2.4%) |
Reported operating profit |
|
|
|
EMIS Health |
7.2 |
13.1 |
81.0% |
EMIS Enterprise |
5.5 |
4.2 |
(23.9%) |
Central costs |
-0.7 |
-0.7 |
(7.8%) |
Total reported operating profit |
12.0 |
16.6 |
38.2% |
Adjusted operating margin |
|
|
|
EMIS Health |
21.5% |
22.1% |
0.6% |
EMIS Enterprise |
27.6% |
27.0% |
(0.6%) |
Total adjusted operating margin |
22.8% |
22.8% |
-0.1% |
Reported operating margin |
|
|
|
EMIS Health |
14.4% |
24.3% |
9.9% |
EMIS Enterprise |
18.7% |
17.4% |
(1.3%) |
Total reported operating margin |
15.1% |
21.3% |
6.2% |
Source: EMIS
|
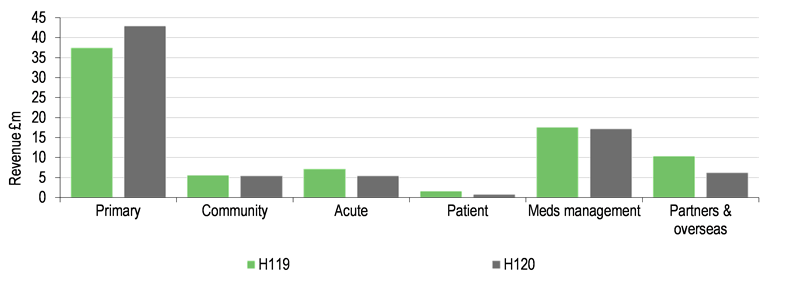
Exhibit 3: Half-yearly revenues by sub-segment |
|
|
Source: EMIS (based on pie charts in results presentation) |
EMIS Health: Supporting the NHS
EMIS Health reported a strong performance in H1, with revenue growth of 7.4% y-o-y and adjusted operating profit growth of 10.4%, resulting in a 0.6pp increase in the margin to 22.1%.
Through a combination of home-working and limited on-site visits, the business was able to provide front-line technical support as required. The previous switch to using ServiceNow for support proved prescient, as this enabled support staff to work from home.
The division developed and delivered COVID-19 updates into all of its major software products and continued to provide software updates for non-COVID-19-related functionality.
Primary Care: Strong demand for COVID-19 support
The group’s market leading position with 57% share of UK GP practices was maintained. The company transitioned smoothly to the GP IT Futures framework from 1 January 2020. To help during lockdown, EMIS supplied free access to video consultation software, not only for all of its GP practices but also for 5,200 community pharmacies. The business saw a significant uptick in the use of its digital triage product, Online Consult, which was used on average 68,000 times per week during lockdown compared to 2,400 times per week prior to lockdown.
Revenues increased year-on-year as the business sold products to help with the new ways of working. This included EMIS Mobile and Anywhere Connect software and hardware. The higher volume of hardware sales, which are lower margin, reduced the group gross margin during H1.
The company’s contract in Wales was extended until 21 July 2021; previously EMIS had not been chosen for the new framework agreement, but as one of the selected suppliers failed to deliver software in line with the agreement, NHS Wales extended EMIS’s contract until a new procurement process could be completed. The contract is currently worth c £2m revenue per annum and our forecasts had assumed this would fall to zero by the end of 2021. We are now factoring in a slower decline in revenue; it is possible that EMIS could be reselected although we are not assuming this in our forecasts.
Community & Acute Care
The business maintained its number two position in the community market with 20% share (end 2019: 21%) and its number two position A&E software was maintained with a share of 22% (end 2019: 23%).
EMIS Enterprise: Tougher to sign new business
This division saw a weaker performance in H1, with revenues down 18.3% y-o-y and adjusted operating profit down 19.9% y-o-y. The decline was due to lower levels of new business in H120 combined with a tough comparison in H119 when several one-off licences were signed.
■
Medicines management: lower footfall reduced community pharmacy revenue. The business has started to integrate PharmOutcomes (software from the recently acquired Pinnacle business) with ProScript Connect. The business maintained its 37% share and market leadership within community pharmacy, and number two position in hospital pharmacy, growing its share from 35% at end FY19 to 37%.
■
Partners: although the number of accredited partners increased from 113 to 125 during H1, lower volumes of regular healthcare activity reduced revenues year-on-year.
■
Patient: Patient Access saw its registered user base grow from 8.4 million at the end of 2019 to 10.0 million by the end of H120 and repeat prescriptions grew by 2m y-o-y to 11.7m. EMIS offered up-to-date public advice and guidance on Patient.info, including a COVID-19 symptom checker. However, the lower number of people able to go out reduced the potential for Patient marketplace services.
Strategic product development maintained
The company is keen to invest in its digital capabilities to ensure it remains at the forefront of NHS modernisation. During H120 it continued to invest in developing the EMIS-X platform and hired more developers for its Indian team. Product development now makes up 41% of total headcount.
The company has shifted 2.5bn documents to the cloud (documents related to patient records such as letters from consultants). The company expects to make upgrades to EMIS-Web and develop new applications for EMIS-X for launch in 2021.
Analytics suite unveiled
The company announced that it had been developing its EMIS-X Analytics (EXA) data analytics suite for the last two years. The team is based in the UK to ensure that all data is managed in a GDPR-compliant manner and to avoid any Brexit-related issues. Explorer, the first product from the suite, is currently being piloted by various customers and is due to officially launch in Q4. The software can be used to analyse large quantities of healthcare data (ie 40 million patient records from 4,000 GP practices) to provide insights to improve patient outcomes at a regional and national level. The pricing mechanism is still being formulated but is likely to comprise fixed and variable components. For now, the target market is the NHS.
Outlook and changes to forecasts
While its customers focused on dealing with COVID-19 during March to June, since the start of H2 the company is seeing signs of life for projects that were in the pipeline. Management expects to meet consensus forecasts for FY20 revenue and to generate FY20 adjusted operating profit slightly below the FY19 level. From FY21, the company expects business to return to more normal behaviour and for profit growth at the previously expected mid- to high-single-digit percentage level.
With its strong cash position and access to up to £60m from bank facilities, management highlighted that it would consider further acquisitions. They stated that these are more likely to be established businesses with growing revenues and profitability as opposed to start-ups, and could include larger companies that would be of a more strategic nature.
We have revised our forecasts to reflect H120 performance. Overall, we have changed the mix of revenue in favour of EMIS Health with a small decline in our FY20 forecast. We have reduced FY21 and FY22 revenue to reflect slower growth in the Enterprise division, resulting in lower adjusted operating profit and adjusted EPS forecasts for FY21 and FY22.
Only affecting normalised and reported forecasts, we have reduced our forecasts for amortisation of capitalised development costs to align with management’s guidance for FY20. This increases all normalised and reported profitability metrics in FY20. Conversely, we have increased our amortisation forecast for FY22 assuming that products will have been launched by then, triggering higher levels of amortisation.
We have slightly reduced our dividend forecast for FY20 from 32.6p to 32.0p.
Exhibit 4: Changes to forecasts
£'000s |
FY20e |
FY20e |
Change |
y-o-y |
FY21e |
FY21e |
Change |
y-o-y |
FY22e |
FY22e |
Change |
y-o-y |
Old |
New |
Old |
New |
Old |
New |
|||||||
Revenues |
159,752 |
158,807 |
(0.6%) |
(0.4%) |
169,787 |
164,130 |
(3.3%) |
3.4% |
176,886 |
169,626 |
(4.1%) |
3.3% |
Normalised operating profit |
39,505 |
42,847 |
8.5% |
5.0% |
43,111 |
43,443 |
0.8% |
1.4% |
48,261 |
45,413 |
(5.9%) |
4.5% |
Normalised operating margin |
24.7% |
27.0% |
2.3% |
25.4% |
26.5% |
1.1% |
27.3% |
26.8% |
(0.5%) |
|||
Reported operating profit |
31,378 |
34,543 |
10.1% |
28.8% |
36,721 |
36,417 |
(0.8%) |
5.4% |
43,425 |
39,941 |
(8.0%) |
9.7% |
EMIS adjusted operating profit |
38,069 |
37,847 |
(0.6%) |
(3.6%) |
42,339 |
40,843 |
(3.5%) |
7.9% |
45,850 |
43,813 |
(4.4%) |
7.3% |
Adjusted operating margin |
23.8% |
23.8% |
0.0% |
24.9% |
24.9% |
(0.1%) |
25.9% |
25.8% |
(0.1%) |
|||
Normalised EPS - p |
51.2 |
55.7 |
8.8% |
4.2% |
56.0 |
56.4 |
0.8% |
1.2% |
62.6 |
58.9 |
(5.8%) |
4.5% |
Reported EPS - p |
40.9 |
46.2 |
13.0% |
28.3% |
47.9 |
47.5 |
(0.8%) |
2.8% |
56.6 |
52.1 |
(7.9%) |
9.5% |
EMIS adjusted EPS - p |
48.9 |
49.3 |
0.8% |
(3.4%) |
54.7 |
53.1 |
(3.1%) |
7.6% |
58.8 |
56.9 |
(3.2%) |
7.2% |
Dividend per share - p |
32.6 |
32.0 |
(1.8%) |
2.6% |
34.0 |
34.0 |
0.0% |
6.3% |
35.0 |
35.0 |
0.0% |
2.9% |
Net cash |
39,841 |
45,061 |
13.1% |
44.9% |
52,793 |
55,518 |
5.2% |
23.2% |
69,145 |
69,540 |
0.6% |
25.3% |
Source: Edison Investment Research
Valuation
The share price is essentially flat year-to-date and is 39% higher than its low of 813p on 18 March. The tables below show how EMIS is trading compared to a global group of healthcare software peers. On an EV/sales basis, EMIS trades at a premium, and on all other metrics, EMIS trades at a discount to the peer group. EMIS generates significantly higher operating profit margins than the average, but with slightly slower revenue growth, generates lower earnings growth. Its dividend yield is significantly ahead of the whole group.
Key to closing the P/E discount will be evidence that revenue growth is returning to the company’s medium-term goal of mid- to high-single digits; this in turn should drive stronger earnings growth.
Exhibit 5: Peer group valuation metrics
|
Year-end |
EV/sales (x) |
P/E (x) |
EV/EBIT (x) |
EV/EBITDA (x) |
Dividend yield (%) |
|||||||||||
CY |
NY |
NY+1 |
CY |
NY |
NY+1 |
CY |
NY |
NY+1 |
CY |
NY |
NY+1 |
CY |
NY |
NY+1 |
|||
EMIS |
31/12 |
4.3 |
4.2 |
4.0 |
20.2 |
20.0 |
19.1 |
15.9 |
15.7 |
15.0 |
12.7 |
12.3 |
11.7 |
2.8% |
3.0% |
3.1% |
|
EMIS (cash R&D) |
4.3 |
4.2 |
4.0 |
22.9 |
21.3 |
19.8 |
18.0 |
16.7 |
15.6 |
|
|||||||
|
|
||||||||||||||||
AllScripts |
31/12 |
1.4 |
1.3 |
1.3 |
13.2 |
11.2 |
9.8 |
13.9 |
11.9 |
11.0 |
7.8 |
7.2 |
6.7 |
0.0% |
0.0% |
0.0% |
|
Cegedim |
31/12 |
1.2 |
1.2 |
1.1 |
22.1 |
16.7 |
13.8 |
19.4 |
15.8 |
13.6 |
6.1 |
5.6 |
5.3 |
0.0% |
0.0% |
0.0% |
|
Cerner |
31/12 |
4.2 |
4.0 |
3.7 |
25.4 |
22.3 |
19.9 |
21.1 |
18.8 |
17.0 |
13.2 |
12.1 |
11.2 |
1.1% |
1.1% |
0.5% |
|
Craneware |
30/06 |
8.2 |
7.8 |
7.4 |
35.3 |
35.7 |
34.2 |
29.2 |
27.8 |
27.7 |
24.1 |
23.6 |
22.6 |
0.0% |
0.0% |
0.0% |
|
CompuGroup |
31/12 |
4.9 |
4.5 |
4.3 |
32.0 |
30.1 |
28.0 |
25.9 |
23.4 |
21.7 |
18.9 |
17.1 |
16.3 |
0.7% |
0.8% |
0.8% |
|
Nexus |
31/12 |
3.9 |
3.6 |
3.3 |
48.0 |
39.9 |
34.0 |
30.4 |
25.9 |
22.4 |
16.9 |
15.2 |
13.8 |
0.5% |
0.5% |
0.5% |
|
NexGen Healthcare |
31/03 |
1.6 |
1.5 |
1.4 |
16.4 |
14.9 |
13.9 |
12.2 |
11.4 |
10.1 |
8.8 |
8.2 |
7.5 |
0.0% |
0.0% |
0.0% |
|
|
|
||||||||||||||||
Average |
3.6 |
3.4 |
3.2 |
27.5 |
24.4 |
21.9 |
21.7 |
19.3 |
17.7 |
13.7 |
12.7 |
11.9 |
0.3% |
0.3% |
0.3% |
||
Median |
3.9 |
3.6 |
3.3 |
25.4 |
22.3 |
19.9 |
21.1 |
18.8 |
17.0 |
13.2 |
12.1 |
11.2 |
0.0% |
0.0% |
0.0% |
||
Premium/(discount) to average |
|
19% |
22% |
25% |
(26%) |
(18%) |
(13%) |
(27%) |
(18%) |
(18%) |
(7%) |
(3%) |
(2%) |
|
|
|
|
Source: Edison Investment Research, Refinitiv (as at 7 September)
Exhibit 6: Peer group financial metrics
Market |
EBIT margin |
EBITDA margin |
Revenue growth |
EPS growth |
|||||||||
CY |
NY |
NY+1 |
CY |
NY |
NY+1 |
CY |
NY |
NY+1 |
CY |
NY |
NY+1 |
||
EMIS |
£714 |
27.0% |
26.5% |
26.8% |
33.8% |
33.7% |
34.4% |
-0.4% |
3.4% |
3.3% |
4.2% |
1.2% |
4.5% |
EMIS (cash R&D) |
24.6% |
23.8% |
24.9% |
-3.4% |
7.6% |
7.2% |
|||||||
AllScripts |
$1,434 |
9.8% |
11.2% |
11.7% |
17.4% |
18.5% |
19.4% |
-5.5% |
1.6% |
3.6% |
-0.2% |
17.6% |
14.1% |
Cegedim |
€371 |
6.3% |
7.5% |
8.4% |
20.1% |
21.0% |
21.6% |
0.0% |
3.7% |
3.8% |
498.8% |
32.6% |
21.3% |
Cerner |
$21,991 |
19.7% |
21.1% |
21.9% |
31.4% |
32.7% |
33.4% |
-3.2% |
5.1% |
6.1% |
5.9% |
13.9% |
12.1% |
Craneware |
£471 |
27.9% |
28.2% |
26.8% |
33.9% |
33.2% |
32.8% |
0.0% |
4.1% |
5.8% |
0.2% |
-1.0% |
4.2% |
CompuGroup |
€3,924 |
18.8% |
19.4% |
19.8% |
25.7% |
26.5% |
26.4% |
11.0% |
7.1% |
5.8% |
7.6% |
6.3% |
7.5% |
Nexus |
€658 |
12.8% |
13.7% |
14.8% |
23.0% |
23.4% |
24.0% |
10.2% |
9.1% |
7.2% |
26.1% |
20.3% |
17.5% |
NexGen Healthcare |
$863 |
12.9% |
13.2% |
14.2% |
17.9% |
18.2% |
19.2% |
0.0% |
4.8% |
4.0% |
-5.1% |
10.6% |
7.3% |
Average |
15.5% |
16.3% |
16.8% |
24.2% |
24.8% |
25.3% |
1.8% |
5.1% |
5.2% |
76.2% |
14.3% |
12.0% |
|
Median |
12.9% |
13.7% |
14.8% |
23.0% |
23.4% |
24.0% |
0.0% |
4.8% |
5.8% |
5.9% |
13.9% |
12.1% |
|
Source: Edison Investment Research, Refinitiv (as at 7 September)
Exhibit 7: Financial summary
£'000s |
2016 |
2017 |
2018 |
2019 |
2020e |
2021e |
2022e |
|||
Year end 31 December |
||||||||||
PROFIT & LOSS |
||||||||||
Revenue |
|
|
158,712 |
160,354 |
149,710 |
159,507 |
158,807 |
164,130 |
169,626 |
|
Cost of Sales |
(14,151) |
(14,674) |
(14,236) |
(15,407) |
(21,217) |
(15,965) |
(17,225) |
|||
Gross Profit |
144,561 |
145,680 |
135,474 |
144,100 |
137,591 |
148,164 |
152,401 |
|||
EBITDA |
|
|
52,288 |
49,222 |
48,919 |
55,632 |
53,747 |
55,343 |
58,313 |
|
Operating Profit (before amort. of acq. intang, SBP and except.) |
38,897 |
34,895 |
32,991 |
40,794 |
42,847 |
43,443 |
45,413 |
|||
EMIS adjusted operating profit |
|
|
38,753 |
37,406 |
35,890 |
39,273 |
37,847 |
40,843 |
43,813 |
|
Amortisation of acquired intangibles |
(6,639) |
(6,717) |
(6,202) |
(7,317) |
(7,304) |
(5,726) |
(4,172) |
|||
Exceptionals |
(6,714) |
(16,988) |
1,657 |
(5,360) |
782 |
0 |
0 |
|||
Share-based payments |
(473) |
(550) |
(766) |
(1,290) |
(1,000) |
(1,300) |
(1,300) |
|||
Operating Profit |
25,071 |
10,640 |
27,680 |
26,827 |
35,325 |
36,417 |
39,941 |
|||
Net Interest |
(237) |
(299) |
(180) |
(498) |
(300) |
(200) |
(200) |
|||
Profit Before Tax (norm) |
|
|
39,159 |
35,192 |
33,426 |
41,038 |
43,289 |
43,985 |
45,955 |
|
Profit Before Tax (FRS 3) |
|
|
25,333 |
10,937 |
28,115 |
27,071 |
35,767 |
36,959 |
40,483 |
|
Tax |
(5,208) |
(2,074) |
(5,355) |
(5,022) |
(6,796) |
(7,022) |
(7,692) |
|||
Profit After Tax (norm) |
32,175 |
27,989 |
26,447 |
33,697 |
35,064 |
35,628 |
37,224 |
|||
Profit After Tax (FRS3) |
20,125 |
8,863 |
22,760 |
22,049 |
28,971 |
29,937 |
32,791 |
|||
Ave. Number of Shares Outstanding (m) |
62.8 |
62.9 |
63.0 |
62.9 |
63.0 |
63.0 |
63.0 |
|||
EPS - normalised & diluted (p) |
|
|
49.4 |
43.1 |
40.4 |
53.5 |
55.7 |
56.4 |
58.9 |
|
EPS - EMIS adjusted & diluted (p) |
|
|
49.2 |
47.0 |
45.0 |
51.1 |
49.3 |
53.1 |
56.9 |
|
EPS - FRS 3 (p) |
|
|
30.4 |
12.8 |
36.1 |
36.0 |
46.2 |
47.5 |
52.1 |
|
Dividend (p) |
23.4 |
25.8 |
28.4 |
31.2 |
32.0 |
34.0 |
35.0 |
|||
Gross Margin (%) |
91.1% |
90.8% |
90.5% |
90.3% |
86.6% |
90.3% |
89.8% |
|||
EBITDA Margin (%) |
32.9% |
30.7% |
32.7% |
34.9% |
33.8% |
33.7% |
34.4% |
|||
Operating Margin (before GW and except.) (%) |
24.5% |
21.8% |
22.0% |
25.6% |
27.0% |
26.5% |
26.8% |
|||
BALANCE SHEET |
||||||||||
Fixed Assets |
|
|
133,292 |
122,979 |
117,920 |
101,089 |
109,035 |
104,451 |
100,421 |
|
Intangible Assets |
110,953 |
100,844 |
96,807 |
82,345 |
86,769 |
81,943 |
77,671 |
|||
Tangible Assets |
22,187 |
22,037 |
21,000 |
18,399 |
21,179 |
20,679 |
20,179 |
|||
Other fixed assets |
152 |
98 |
113 |
345 |
1,087 |
1,829 |
2,571 |
|||
Current Assets |
|
|
46,088 |
56,900 |
53,107 |
67,278 |
83,395 |
95,948 |
111,234 |
|
Stocks |
1,815 |
1,633 |
1,264 |
657 |
657 |
657 |
657 |
|||
Debtors |
39,970 |
40,148 |
36,223 |
33,047 |
35,677 |
37,772 |
39,037 |
|||
Cash |
4,303 |
13,991 |
15,620 |
31,099 |
45,061 |
55,518 |
69,540 |
|||
Current Liabilities |
|
|
(56,158) |
(65,131) |
(60,169) |
(55,700) |
(63,698) |
(64,757) |
(66,904) |
|
Creditors |
(51,425) |
(65,131) |
(60,169) |
(55,060) |
(63,058) |
(64,117) |
(66,264) |
|||
Lease liabilities |
0 |
0 |
0 |
(640) |
(640) |
(640) |
(640) |
|||
Short term borrowings |
(4,733) |
0 |
0 |
0 |
0 |
0 |
0 |
|||
Long Term Liabilities |
|
|
(9,080) |
(6,734) |
(8,199) |
(8,469) |
(11,118) |
(8,183) |
(5,543) |
|
Long term borrowings |
0 |
0 |
0 |
0 |
0 |
0 |
0 |
|||
Lease liabilities |
0 |
0 |
0 |
(3,294) |
(5,474) |
(3,874) |
(2,274) |
|||
Other long term liabilities |
(9,080) |
(6,734) |
(8,199) |
(5,175) |
(5,644) |
(4,309) |
(3,269) |
|||
Net Assets |
|
|
114,142 |
108,014 |
102,659 |
104,198 |
117,614 |
127,458 |
139,207 |
|
CASH FLOW |
||||||||||
Operating Cash Flow |
|
|
43,657 |
48,834 |
49,873 |
50,059 |
58,895 |
55,327 |
59,195 |
|
Net Interest |
(324) |
(356) |
(214) |
(93) |
(300) |
(200) |
(200) |
|||
Tax |
(7,655) |
(8,139) |
(5,830) |
(4,466) |
(9,307) |
(8,357) |
(8,731) |
|||
Capex |
(12,084) |
(11,342) |
(12,767) |
(13,119) |
(13,500) |
(12,300) |
(12,300) |
|||
Acquisitions/disposals |
(1,790) |
329 |
(9,269) |
5,152 |
(420) |
(1,020) |
0 |
|||
Financing |
881 |
571 |
906 |
(2,369) |
200 |
(500) |
(500) |
|||
Dividends |
(14,006) |
(15,476) |
(21,070) |
(18,745) |
(20,006) |
(20,893) |
(21,842) |
|||
Net Cash Flow |
8,679 |
14,421 |
1,629 |
16,419 |
15,562 |
12,057 |
15,622 |
|||
Opening net debt/(cash)* |
|
|
9,109 |
430 |
(13,991) |
(15,620) |
(31,099) |
(45,061) |
(55,518) |
|
Finance leases initiated |
0 |
0 |
0 |
(940) |
(1,600) |
(1,600) |
(1,600) |
|||
Other |
0 |
0 |
0 |
0 |
0 |
0 |
0 |
|||
Closing net debt/(cash)* |
|
|
430 |
(13,991) |
(15,620) |
(31,099) |
(45,061) |
(55,518) |
(69,540) |
|
Source: EMIS, Edison Investment Research. Note: *Excluding lease liabilities.
|
|
When the disposal of Avon’s dairy operations was announced, we assumed the proceeds would be reinvested in higher return businesses. The proposed $130m acquisition of the helmet systems activities of Team Wendy is a meaningful and strategically aligned deal, with higher returns and good organic growth prospects. Both deals should complete in Q1 FY21 and taken together should be EPS enhancing, improve value creation and leave net cash balances for further reinvestment.