Last close As at 05/08/2026
—
— 0.00 (0.00%)
Market capitalisation
—
Research: Financials
Through the Artemis and Metexelixis securitisations, Attica’s exposure to impaired loans has reduced significantly and now compares favourably with the larger Greek banks. Management forecasts common equity Tier 1 to increase from 12.2% to 13.2% at year end, representing significant headroom over regulatory requirements. Management will now move to the next stage of recovery, right-sizing the cost base and shifting the group’s focus to the small and medium-sized enterprise market. Q3 results provide evidence of tight cost control and declining impairments. With Attica trading at 0.18x tangible book value, investors are taking nothing on trust.
Written by
Attica Bank |
Balance sheet repair nears completion |
Q3 update |
Banks |
18 March 2019 |
Share price performance
Business description
Next event
Analysts
Attica Bank is a research client of Edison Investment Research Limited |
|||||||||||||||||||||||||||||||||||||||||||||||
Through the Artemis and Metexelixis securitisations, Attica’s exposure to impaired loans has reduced significantly and now compares favourably with the larger Greek banks. Management forecasts common equity Tier 1 to increase from 12.2% to 13.2% at year end, representing significant headroom over regulatory requirements. Management will now move to the next stage of recovery, right-sizing the cost base and shifting the group’s focus to the small and medium-sized enterprise market. Q3 results provide evidence of tight cost control and declining impairments. With Attica trading at 0.18x tangible book value, investors are taking nothing on trust.
Year |
PBT (€m) |
Underlying |
EPS* |
TBV per share (€) |
P/E |
Price/TBV |
12/17 |
1.13 |
(67.91) |
(0.01) |
0.21 |
N/A |
0.91 |
12/18e |
7.85 |
(15.99) |
0.01 |
1.03 |
20.1 |
0.18 |
12/19e |
1.61 |
11.61 |
0.00 |
1.04 |
84.3 |
0.18 |
12/20e |
29.97 |
29.97 |
0.05 |
1.10 |
4.1 |
0.17 |
Note: *Excludes gain from securitisation, staff retirement compensation and associates.
De-risked portfolio
Attica has significantly de-risked its portfolio through two securitisations. There is some residual exposure through €868m of senior notes issued by the special purpose vehicles (SPVs), but Aldridge and PIMCO, the distressed debt managers, were prepared to pay premiums to acquire the junior notes, pointing to the senior notes’ position in the debt hierarchy and that they are well protected by over-collateralisation. We estimate net impaired loans left on the balance sheet will represent 89% of tangible book value, having reduced from 250% before the securitisation process. This reduction will become evident when the Metexelixis SPV is deconsolidated in Q418.
Restructure and refocus
Q3 results show tight cost control and falling impairments compensating for declining revenues. Improved returns will be achieved through pricing leverage as the major Greek banks attempt to repair their profitability, normalisation of impairments as non-performing exposures reduce and voluntary retirement schemes to bring the cost/income ratio down to the industry level. Given Attica’s size, achieving scale economies may difficult but progress should come from refocusing from the retail to the business market, a reduction in the branch network and digitalisation (see our initiation note, Innovative approach to de-risking).
Valuation: Significantly out of line with peers
By 2020 we believe Attica will be generating a return on tangible book value of 4–5%, which will be comparable with the larger Greek banks. However, the current stock market valuation is considerably lower than peers, with the share price/tangible book value ratio at 0.18x. This compares with 0.1–0.3x for peers, with most concentrated at the top end of this range. Despite the recent rally, there is scope for further upside; our fair value of €0.27 per share implies 40% upside. Additional momentum could come from Greece’s economic recovery reducing the excessive risk premium attached to bank equity.
Q3 update: Balance sheet repair nears completion
Impact of securitisations
Attica has undertaken two successful securitisations (Artemis and Metexelixis), which represent significant steps towards de-risking the balance sheet. These transactions have seen slightly more than €2bn of impaired loans (80% of the total) placed in two SPVs. The SPVs financed their purchases with the issue of senior and junior notes to Attica.
The bank retains the two senior notes but sold the junior notes to Aldridge and Pimco (the distressed debt managers) at premiums to their written-down value. This indicates the distressed debt managers’ conviction that liquidation of the SPV assets will be sufficient to repay the junior notes and, by implication, the senior notes. This positive outcome is made possible by the conservative provisioning that Attica has put in place. For example, the €1.3bn of non-performing exposures (NPEs) in the Artemis SPV were backed by an €0.8bn loan loss allowance and €0.5bn of collateral.
The bank holds almost €0.9bn of senior bonds, which will have first claim on the realisable value of the €2.0bn of NPEs within the SPVs. These NPEs have a written-down value (net of the loan loss allowance) of €0.8bn, which is supported by an equivalent amount of collateral. Consequently, provided the realisable value of collateral does not decline, there is every probability that the senior bonds, protected by their position in the debt hierarchy, will be repaid (Exhibit 1).
|
Exhibit 1: Collateral backing for NPEs in the SPVs should be sufficient to enable senior bonds to be repaid |
|
|
Source: Edison Investment Research, Attica Bank |
Nonetheless, the senior bonds still pose a risk to Attica because the accounting treatment is to fair value the bonds through other comprehensive income. They rank as level-three assets because key assumptions determining fair value (timing and quantum of collections, value of collateral and the discount rate) are not observable. Changes to assumptions in mirroring market conditions could have a significant impact on the valuation of the bonds and Attica’s financial position. However, an adverse outcome seems unlikely given that residential and commercial property prices have been stable for several years. Also, the securitisation transactions are irrevocable, which means that whatever happens to the SPV loans they will never come back on to Attica’s balance sheet.
Residual loan exposure
Exhibit 2: Pro forma residual balance sheet exposure post Metexelixis deconsolidation
€m |
2017* |
Q318 |
Metexelixis |
Pro forma |
Business |
964 |
965 |
(605) |
360 |
Mortgage |
312 |
285 |
(8) |
277 |
Consumer |
113 |
112 |
(54) |
58 |
Non-performing exposure (NPE) |
1,388 |
1,361 |
(666) |
695 |
Gross lending |
2,667 |
2,594 |
(666) |
1,927 |
Loan loss allowance (LLA) |
475 |
579 |
(345) |
234 |
Collateral |
867 |
783 |
(303) |
480 |
LLA/NPE |
34% |
43% |
34% |
|
LLA+ Collateral/NPE |
97% |
100% |
103% |
|
NPE/gross lending |
52% |
52% |
36% |
Source: Attica Bank. Note: *Under IAS 39 rather than IFRS 9.
The Metexelixis transaction was finalised in the autumn of 2018, although that was too late for de-consolidation of SPV assets to appear in the Q3 balance sheet. To clarify the position, Attica published a pro-forma balance sheet showing its position post Metexelixis (Exhibit 2). This reveals a residual NPE exposure of €695m covered 34% by the loan loss allowance. Taking account of collateral and the loan loss allowance, overall coverage rises to 103%. This is comparable to the level of NPE coverage at other Greek banks, although proportionately Attica is more dependent on collateral (Exhibit 3). As a proportion of gross lending, at 36% residual NPE exposure compares with an average for the major Greek banks of 44%.
|
Exhibit 3: Loan loss allowance and collateral coverage of NPEs |
|
|
Source: Attica Bank, Alpha, Eurobank, NBG and Piraeus |
|
Exhibit 4: Long-term stability of commercial and residential prices continues |
|
|
Source: Bank of Greece |
Collateral is extensive and diverse; of the €480m, €270m is residential property, whereas the €170m relating to businesses includes commercial property, guarantees, securities and bank deposits. Collateral is predominantly residential and commercial property. The critical point is that property valuations do not decline, otherwise Attica would be compelled to add to its loan loss reserve through a P&L charge. In this regard, Attica’s residual risk is similar to its exposure through the senior bonds where the mark to market also depends on the valuation and realisation of collateral. Fortuitously, prices of residential and commercial real estate have been stable for several years despite the major banks also running their own extensive work-out programmes (Exhibit 4).
Capital now looks better
Common equity Tier 1 is 12.2%, but management expects a year-end figure of 13.2% once the gain on the disposal of the Metexelixis junior bond is booked in the fourth quarter.
As a non-systemic institution, Attica’s capital requirements are set by the Bank of Greece rather than the European Central Bank, and are significantly lower than for the large Greek banks. Attica’s minimum CET1 requirement was 8.0% in 2018 but will rise to 8.6% following the requirement for banks to apply the full capital conservation buffer.
Against this benchmark, Attica’s 13.2% appears to give ample headroom. However, a further adjustment is necessary. Along with its peers, Attica Bank is phasing the adverse impact of IFRS 9 into its capital base over five years (5% in 2018, 15% in 2019 and so on) with the result that fully adjusted CET1 will be approximately 3.2pp lower than the current figure. On this basis, Attica’s ratio of 10.0% is lower than the comparable ratios of major Greek banks but to some extent this is balanced by the group’s lower regulatory requirements (Exhibit 5).
On the positive side, the €868m of senior bonds acquired through securitisations attract 100% risk weightings. Their repayment would remove around one-quarter of the group’s risk weighted assets (RWAs), adding around 4.5pp to CET1. However, it could be 10 years before Attica sees this benefit and, more immediately, the capital position faces the amortisation of deferred tax credits, which will depress the CET1 ratio by 0.3% per year.
|
Exhibit 5: Current CET1 ratios, CET1 fully adjusted for IFRS 9, and regulatory requirement |
|
|
Source: Attica Bank, Edison Investment Research |
Deposit inflows eliminate emergency liquidity assistance funding
As confidence in the economy recovers, the banking system is enjoying strong deposit inflows. Attica’s customer deposit growth began its upward trajectory in mid-2017 and was running at 15% year-on-year in Q318. Growth has come primarily from household sector time deposits. As a result, the loan-to-deposit ratio has declined from 114% (end 2017) to 95.4%. We estimate that deconsolidation of the Metexelixis SPV will drive the ratio down to around 80%.
A further benefit from the influx of liquidity is reduced reliance on emergency liquidity assistance (ELA), which stood at €500m at the end of the quarter and was reported as €176m (6.4% of total deposits) in mid-December. This puts Attica on a comparable footing to the major Greek banks which have repaid, or are close to repaying, their ELA liabilities.
Rebuilding profitability
Q318
Overall Attica produced a pre-tax loss €37.9m for the first nine months of 2018 (Exhibit 6). This compares with a profit of €12.2m for the comparable period of 2017, but the latter figure includes the €70m gain from the Artemis securitisation. For 2018 the corresponding gain on the Metexelixis securitisation will only be booked in the fourth quarter and should enable Attica to report a pre-tax profit for the full year. Because of the distorting influence of these gains, we define an underlying result that excludes securitisation gains, staff retirement compensation and associates. We estimate the underlying pre-tax loss for 2018 will be close to €16m, which is a material improvement on the €68m loss recorded for the prior year.
Net interest income was down 6% for the first nine months of 2018. We believe the principal factor here is interest foregone on impaired loans. With the introduction of IFRS 9, loans are no longer classified as impaired or non-performing but these categories would approximately correspond with Stage 3 loans under the new accounting regime. Attica’s loan book was flat through 2018 but Stage 3 loans increased from 45% to 52% of the portfolio (an increase of €170m), which would be more than sufficient to explain the magnitude of the net interest income decline. The extent to which the increase in Stage 3 loans reflects an underlying deterioration in credit quality or a change in methodology under the new accounting regime is uncertain but the steep decline in the nine-month impairment charge (€24.6m vs €62.7m) points to the latter.
Exhibit 6: Attica’s earnings model
9mths |
9mths |
FY17 |
FY18e |
FY19e |
FY20e |
|||||
€000s |
Sep-17 |
Sep-18 |
% chg |
Dec-17 |
Dec-18 |
% chg |
Dec-19 |
% chg |
Dec-20 |
% chg |
Interest income |
97,595 |
90,338 |
137,302 |
125,318 |
122,737 |
126,167 |
||||
Interest expense |
(38,258) |
(34,269) |
(50,310) |
(48,601) |
(38,352) |
(34,637) |
||||
Net interest income |
59,337 |
56,069 |
(6) |
86,992 |
76,717 |
(12) |
84,386 |
10 |
91,531 |
8 |
Net fees and commissions |
9,688 |
4,389 |
(55) |
10,626 |
5,589 |
(47) |
5,868 |
5 |
6,162 |
5 |
Profit from financial transactions |
944 |
958 |
1,334 |
1,258 |
1,500 |
1,500 |
||||
Profit from investment portfolio |
22 |
594 |
155 |
894 |
600 |
600 |
||||
Other income |
(770) |
581 |
(2,478) |
781 |
500 |
700 |
||||
Gain from securitisation |
70,000 |
- |
70,000 |
47,000 |
- |
- |
||||
Operating income |
70,196 |
2,133 |
(97) |
69,010 |
49,933 |
(28)% |
2,600 |
(95) |
2,800 |
8 |
Personnel expenses |
(27,379) |
(25,916) |
(38,554) |
(33,369) |
(29,927) |
(24,370) |
||||
Staff retirement compensation |
- |
(17,214) |
(20,000) |
(10,000) |
- |
|||||
General operating expenses |
(21,218) |
(21,007) |
(31,051) |
(27,946) |
(26,549) |
(25,221) |
||||
Depreciation |
(4,781) |
(5,705) |
(6,511) |
(7,488) |
(7,862) |
|||||
Costs |
(53,378) |
(69,842) |
(31) |
(76,116) |
(88,803) |
(17) |
(74,338) |
16 |
(57,847) |
22 |
Impairment charge for loans |
(62,700) |
(24,620) |
61 |
(73,500) |
(29,551) |
60 |
(16,904) |
43 |
(12,678) |
25 |
Impairment other assets |
(10,038) |
(2,878) |
(14,925) |
(2,878) |
- |
- |
||||
Associates |
(905) |
(3,154) |
(953) |
(3,154) |
- |
- |
||||
Pre-tax profit |
12,201 |
(37,903) |
N/A |
1,134 |
7,853 |
592 |
1,613 |
(79) |
29,968 |
18 |
Adjustments |
(69,095) |
20,368 |
(69,047) |
(23,846) |
10,000 |
- |
||||
Underlying pre-tax profit* |
(56,894) |
(17,535) |
69 |
(67,913) |
(15,993) |
76 |
11,613 |
n/a |
29,968 |
n/a |
Pre-tax profit |
12,201 |
(37,903) |
1,134 |
7,853 |
1,613 |
29,968 |
||||
Taxation |
(4,753) |
1,183 |
(704) |
(3,502) |
(573) |
(8,796) |
||||
Non-controlling interests |
(9,033) |
- |
(12,260) |
- |
- |
- |
||||
Attributable |
(1,585) |
(36,720) |
(11,830) |
4,351 |
1,040 |
21,172 |
||||
shares ranking m |
2,339 |
1,247 |
2,339 |
461 |
461 |
461 |
||||
EPS (€) |
(0.0007) |
(0.0294) |
(0.005) |
0.009 |
0.002 |
0.046 |
||||
Cost/Income* |
77% |
84% |
79% |
81% |
69% |
58% |
||||
Shareholders’ equity |
638,548 |
583,887 |
632,705 |
524,759 |
525,799 |
546,971 |
||||
Intangibles |
46,670 |
50,075 |
46,668 |
50,075 |
44,834 |
39,330 |
||||
preference shares |
100,200 |
100,200 |
100,200 |
- |
- |
- |
||||
Net tangible assets |
491,678 |
433,612 |
485,837 |
474,684 |
480,965 |
507,641 |
||||
Net tangible assets per share |
0.21 |
0.94 |
0.21 |
1.03 |
1.04 |
1.10 |
||||
CET1 capital |
524,700 |
413,946 |
503,618 |
448,137 |
448,669 |
464,362 |
||||
Risk weighted assets €m |
3,498 |
3,393 |
3,421 |
3,393 |
3,393 |
3,494 |
||||
CET1 ratio |
15.0% |
12.2% |
14.7% |
13.2% |
13.2% |
13.3% |
||||
Return on net tangible assets |
(0.4)% |
(10.1)% |
(2.4)% |
0.9% |
0.2% |
4.4% |
Source: Attica, Edison Investment Research estimates. Note: *Excludes gain from securitisation, staff retirement compensation and associates.
The nine-month figures also show evidence of tight cost control if staff retirement compensation is excluded. The group headcount began 2018 at around 800 but has shrunk by around a quarter. The decline in fee and commission income reflected an abnormal level of construction guarantee income in the 2017 comparative. The principal balance sheet feature to emerge from Q3 figures was the acceleration of deposit inflows to 15%, which reduced the loan/deposit ratio and facilitated reduction in ELA funding.
Exhibit 7: Greece economic performance and consensus forecasts
2015 |
2016 |
2017 |
2018 |
2019e |
2020e |
|
Real GDP growth (%) |
(0.2) |
(0.3) |
1.4 |
2.1 |
1.9 |
1.8 |
CPI (%) |
(1.1) |
0 |
1.1 |
0.8 |
1.0 |
1.2 |
Unemployment (%) |
24.9 |
23.6 |
21.5 |
19.5 |
18.0 |
16.5 |
Current acc % GDP |
0 |
(0.5) |
(0.6) |
(1.2) |
(1.0) |
(1.0) |
Fiscal balance % GDP |
(5.7) |
0.5 |
0.8 |
0.5 |
0.1 |
0.2 |
Source: Refinitiv
Outlook
Greece’s economy grew at an estimated 2.1% in 2018 and is expected to continue at this pace over the coming years, contingent on the continuing implementation of reforms. The labour market has been improving steadily with unemployment falling below 20%. Although this positive for impairments, it is unlikely the deleveraging of household and corporate balance sheets will reverse. However, even without lending growth, there are four factors that could help Attica achieve a modest revenue progression:
■
A stabilisation in the volume of Stage 3 ‘impaired’ loans, which is conceivable given improving economic sentiment and declining unemployment.
■
The 3% coupon on the senior bonds may provide more interest income than the interest forgone on non-performing exposures placed in the SPVs.
■
Attica has some pricing leverage on the liability side of its balance sheet now that deposits that inflows have become more dependable, and offered rates are more generous than the competitions’ (average term deposit 1.36% compared with the major Greek banks at 0.7–0.9%).
■
Likewise, there may be scope to improve asset yields as competitor banks are highlighting a healthy differential between the pricing of new business and the existing stock.
In addition, there are two critical factors that should help Attica achieve significant improvement in profitability:
■
The second voluntary retirement scheme launched in 2018 will facilitate a decline in the cost base this year, because of averaging effects. We believe a third scheme will be implemented in 2019 to facilitate scaling back the retail bank.
■
Impairments should diminish, reflecting the impact of the two securitisations that have reduced exposure to the collateral underpinning impaired loans.
On our estimates, the combination of these developments could result in Attica pushing its cost/income ratio down from 80% to below 60% and achieving close to a 5% return on tangible book value equity by 2020. The cost/income ratio is materially out of line with other Greek banks (Exhibit 9) and, although it may stem from the difficulties of achieving scale economies in a small institution, it will need to be addressed. Progress is also being made to reduce other operating costs facilitated by a reduction in the branch network, and the process of digitalisation. The projected mid-single digit return is in line with analysts’ estimates for the major Greek banks.
Relative to our previously published forecasts (see our initiation note, Innovative approach to de-risking), we are more positive on 2018 reflecting tighter cost control and declining impairments evident in Q318 figures. However, we take a more cautious view of future revenue growth extending the timescale over which lending assets and deposits re-price.
Exhibit 8: Change in estimates
€000s |
FY18e |
FY19e |
FY20e |
|||
Old |
New |
Old |
New |
Old |
New |
|
Revenue |
86,543 |
85,239 |
96,932 |
92,854 |
105,271 |
100,493 |
Costs |
(70,195) |
(68,803) |
(65,916) |
(64,338) |
(59,348) |
(57,847) |
Impairment |
(36,939) |
(29,551) |
(17,000) |
(16,904) |
(13,005) |
(12,678) |
Other |
(378) |
(2,878) |
- |
- |
- |
- |
Underlying pre-tax profit |
(20,969) |
(15,993) |
14,016 |
11,613 |
32,918 |
29,968 |
Source: Edison Investment Research. Note: Underlying pre-tax profit excludes gain from securitisation, staff retirement compensation and associates.
Valuation: Discount to peers
Before discussing valuation, it is worth comparing Attica to its immediate quoted peer group. In doing this we have relied on nine-month data for 2018 adjusted, where possible, to exclude non-recurring revenues and costs and discontinued operations or those subject to disposal. The key feature of all these institutions is that they are either loss making or only marginally profitable. This is mainly because of impairment charges, but for Attica there is also the problem of a relatively high cost/income ratio.
After allowing for the Metexelixis transaction, Attica will have a liquid balance sheet (75% loan to deposit ratio) and modest levels of Stage 3, or impaired, loans. Although it is not strictly correct to deduct all the loan loss allowance (LLA) from Stage 3 loans (because part is allocated to Stage 1 and part to Stage 2 lending), this approach leaves the unprovided element of Stage 3 at 99% of tangible book value. This falls to 89% if allowance is made for regulatory surplus capital and compares with a peer group range of 97–294%.
Plotting the unprovided impaired loans against net tangible book demonstrated price/tangible book valuations for Greek banks are correlated with this metric and explains why the valuations are so low (Exhibit 11). On the basis of peer group comparison, Attica should be trading at around 0.27x tangible book value or 40% higher than the current level.
Exhibit 9: Attica vs peer group
9M18 (€m) |
Attica |
Alpha |
Eurobank |
NBG |
Piraeus |
Bank of Cyprus |
Underlying revenue |
60 |
1,384 |
1,109 |
1,387 |
1,387 |
600 |
Underlying costs |
(53)a |
(757) |
(713) |
(745) |
(745) |
(291) |
Impairment |
(25) |
(513) |
(239) |
(461) |
(461) |
(128) |
Underlying PBT |
(18) a |
114 |
67 |
181 |
181 |
181 |
Nominal tax @ 29% |
(33) |
(19) |
(52) |
(52) |
(52) |
|
Non-controlling interest |
(27) |
4 |
4 |
3 |
||
Attributable |
81 |
21 |
133 |
133 |
132 |
|
Impairment/loans |
1.7% |
1.5% |
0.8% |
1.2% |
1.2% |
1.3% |
Cost/Income |
87% |
55% |
70% |
54% |
54% |
49% |
Return on tangible book value |
N/A |
2% |
1% |
4% |
4% |
8% |
CET1 |
448b |
5,577 |
5,700 |
6,700 |
6,700 |
1,900 |
RWAs |
3,393 |
38,239 |
35,000 |
47,400 |
47,400 |
14,400 |
CET1 ratio |
13.2% |
14.6% |
16.6% |
14.2% |
14.2% |
13.2% |
CET1 ratio ex IFRS 9 adj |
10.0% |
11.7% |
13.1% |
10.8% |
10.8% |
12.6% |
Est regulatory requirement |
8.6% |
10.0% |
10.0% |
10.8% |
10.8% |
10.0% |
Surplus capital |
47 |
650 |
1,085 |
24 |
24 |
374 |
Surplus % tangible book value |
10% |
13% |
22% |
0% |
0% |
18% |
Deposits |
2,750 |
36,388 |
42,000 |
42,900 |
42,900 |
16,850 |
Of which ELA funding |
500 |
3,800 |
0 |
0 |
0 |
0 |
Loans/deposits |
75% b |
110% |
72% |
91% |
91% |
65% |
Stage 1 |
845 |
20,300 |
15,370 |
18,400 |
18,400 |
4,400 |
Stage 2 |
390 |
7,300 |
7,830 |
5,900 |
5,900 |
4,000 |
Stage 3 |
695 b |
17,700 |
16,740 |
28,500 |
28,500 |
5,000 |
Gross loans |
1,930 |
45,300 |
40,091 |
52,800 |
52,800 |
13,400 |
LLA |
(234) b |
(9,383) |
(9,959) |
(13,917) |
(13,917) |
(2,400) |
Net loans |
1,696 |
35,917 |
30,132 |
38,883 |
38,883 |
11,000 |
Stage 3 less LLA % tan book value |
99% |
172% |
138% |
295% |
295% |
124% |
Shareholders’ funds |
517 |
5,059 |
5,051 |
5,240 |
5,240 |
2,253 |
Goodwill, intangibles |
(50) |
(211) |
(146) |
(293) |
(293) |
(36) |
Tangible book value |
467 b |
4,848 |
4,905 |
4,947 |
4,947 |
2,217 |
Shares in issue (m) |
461.3 |
2,184 |
915 |
437 |
437 |
446 |
TBV per share (€) |
1.01 |
2.22 |
5.36 |
11.33 |
11.33 |
4.97 |
Market capitalisation |
88 |
1,433 |
1,529 |
620 |
620 |
624 |
Unprovided stage 3 less surplus (%) |
89% |
158% |
116% |
294% |
294% |
100% |
Price/tangible book value |
0.19 |
0.30 |
0.31 |
0.13 |
0.13 |
0.28 |
P/E (x) |
N/A |
13.3 |
55.8 |
3.5 |
3.5 |
3.6 |
Source: Attica, Edison Investment Research. Note: aexcludes staff retirement compensation; bpro forma post-Metexelixis.
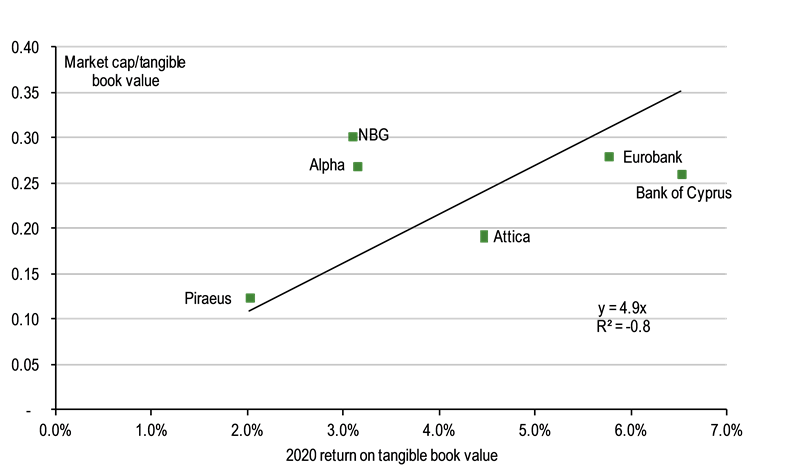
An alternative approach, derived from the capital asset pricing model, is to compare price/tangible book value ratios against returns on equity. Refinitiv consensus expectations for the future profitability of Greek banks are fairly cautious, with returns on tangible equity projected to have risen to 2–6% by 2020.
On our estimates, Attica would be close to a 5% return by this point. The reciprocal of the gradient of the best fit line from Exhibit 12 corresponds to the cost of equity for Greek banks and looks to be in the order of 20%. A 5% return in conjunction with a 20% COE and projected net tangible assets per share of €1.10 (Exhibit 6) would be compatible with a fair value price of €0.27. The sensitivity of fair value to the level of return is given in Exhibit 10.
Exhibit 10: Attica’s sensitivity of fair value price to return and cost of equity
Sustainable return on TBV |
||||
COE |
2% |
5% |
6% |
8% |
10% |
0.20 |
0.53 |
0.61 |
0.81 |
15% |
0.13 |
0.35 |
0.40 |
0.54 |
20% |
0.10 |
0.27 |
0.30 |
0.40 |
25% |
0.08 |
0.21 |
0.24 |
0.32 |
Source: Edison Investment Research
|
Exhibit 11: Price/TBV and unprovided impaired loans |
|
|
Source: Refinitiv, Edison Investment Research |
|
Exhibit 12: Price/TBV and sustainable returns (2020 estimates) |
|
|
Source: Refinitiv, Edison Investment Research |
|
|
Research: TMT
Group organic revenue growth in FY18 was driven by double-digit growth of the aerospace business. TXT started to invest some of its substantial cash pile in H218, acquiring two Italian businesses in the fintech space. This investment should provide growth opportunities for the Banking & Finance business. Increased investment in sales and R&D in FY19 reduces our normalised EPS forecast by 15.5%; we introduce a forecast for 21% EPS growth in FY20. The company continues to assess targets in both business lines and has net cash of €60m available to fund acquisitions.