Last close As at 05/08/2026
—
— 0.00 (0.00%)
Market capitalisation
—
Research: Investment Companies
TR European Growth Trust (TRG) has enjoyed a stellar period of performance since the COVID-19-driven stock market sell-off in March 2020 (beating the benchmark by c 25pp over one year to 28 February 2021), helped by its managers sticking to their valuation-aware investment process, as well as a timely increase in the trust’s gearing. Lead manager Ollie Beckett says the team is optimistic on the prospects for small-cap European stocks – many of which have stronger balance sheets than their large-cap counterparts – as the economy recovers. TRG has a broadly diversified portfolio of c 130 stocks, allowing the managers to look for high-growth micro-caps as well as structural growth stories and recovery plays. Although the trust is now at the top of its peer group for NAV total returns over one and 10 years, it trades at the widest discount to NAV, suggesting significant scope for a re-rating similar to that seen in 2016/17.
Written by
TR European Growth Trust |
Back to winning ways |
Investment trusts |
22 March 2021 |
Analysts
|
|||||||||||||||||||||||||||||||||||||||||||||||||||||||||||||||||||||||||||||||||||||||||||||||||||||||||||||||||||||||
TR European Growth Trust (TRG) has enjoyed a stellar period of performance since the COVID-19-driven stock market sell-off in March 2020 (beating the benchmark by c 25pp over one year to 28 February 2021), helped by its managers sticking to their valuation-aware investment process, as well as a timely increase in the trust’s gearing. Lead manager Ollie Beckett says the team is optimistic on the prospects for small-cap European stocks – many of which have stronger balance sheets than their large-cap counterparts – as the economy recovers. TRG has a broadly diversified portfolio of c 130 stocks, allowing the managers to look for high-growth micro-caps as well as structural growth stories and recovery plays. Although the trust is now at the top of its peer group for NAV total returns over one and 10 years, it trades at the widest discount to NAV, suggesting significant scope for a re-rating similar to that seen in 2016/17.
|
Strong recovery in relative performance since Q120 |
|
|
Source: Refinitiv, Edison Investment Research. NAV total return relative to benchmark. |
Why invest in European small-caps now?
Although continental Europe is currently experiencing a slower-than-anticipated roll-out of COVID-19 vaccination programmes, which could set back the pace of reopening in the near term, the scale of global fiscal and monetary easing means the world should enjoy a period of synchronised economic growth over the next few years. This would favour European stocks in general, and more value and cyclical names – which tend to be more prevalent in the small-cap area – in particular.
The analyst’s view
TRG has suffered in the past few years as its main area of focus – underappreciated European small-caps – has been largely ignored by investors. The portfolio offers a good mix of growth and value, with a focus on cash-generative companies helping it to achieve portfolio income in H121 that was above the pre-pandemic level of H119, and a c 5% increase in the recently announced interim dividend compared with H120. Recent performance has been strong as the managers have stuck to their tried-and-tested process, assisted by greater investor appreciation of stocks with social and environmental benefits. We note that in the last sustained period of value stock outperformance in 2016/17, TRG’s shares traded at a premium to NAV, and there is thus significant scope for a re-rating from the current c 13% discount.
Market outlook: Relative value opportunity in Europe
The past 12 months have been tumultuous for society but positive for global stock markets, which quickly shrugged off the widespread sell-off in March 2020 to end the year at or near new highs. While large-cap growth stocks – particularly those benefiting from trends in technology – have broadly continued to do well, the positive news on COVID-19 vaccines that began to emerge in late 2020 has seen small-cap stocks in Europe outperform their larger counterparts (Exhibit 1, LHS) as investors look ahead to a life beyond lockdowns. Although Europe is not yet out of the woods, with rising coronavirus infection rates and a slow roll-out of vaccination programmes given supply shortages, there remains a good chance of a return to some kind of normality before the end of 2021, with unprecedented monetary and fiscal stimulus leading to a high level of pent-up consumer demand. While in absolute terms European stocks are not particularly attractively valued – as shown in Exhibit 1 (RHS), the forward P/E multiple of the Datastream Europe ex-UK Index is close to its highest level in five years – there remains a relative value opportunity versus the rest of the world (dominated by the US), with the current c 11% P/E discount to the Datastream World Index being at the wider end of the five-year range. If rising inflation and bond yields are added into the mix, investors could benefit from a focus on less favoured cyclical and recovery stocks, rather than the highly valued growth companies that have led global markets in recent years.
|
Exhibit 1: Market performance and valuation |
|
Total return performance of large- and small-cap European indices (£) |
Absolute and relative forward P/E multiple for DS Europe ex-UK index |
|
|
|
Source: Refinitiv, Edison Investment Research. Note: Valuation data at 17 March 2021. |
|
The fund managers: Beckett, Stokes and Scheufler
The manager’s view: Valuation matters
As the world begins to look ahead to a life beyond COVID-19 lockdowns, TRG lead manager Beckett is optimistic on the outlook for European smaller companies. ‘Europe is a geared play on global GDP, and if things get better, it benefits the region, as it is more geared to the external economy’, he explains. Contrary to most people’s expectations, he says, smaller companies’ balance sheets are generally stronger than those of large-caps, ‘and they also have more exposure to the interesting niches of energy transition and the sustainable economy’.
Given the scale of fiscal and monetary easing in response to the pandemic, Beckett expects to see a pick-up in bond yields and inflation, and points out that in such an environment, the highly valued growth stocks that have driven stock market performance in recent years could begin to struggle. ‘A pick-up in broad money supply usually equals a pick-up in inflation’, the manager argues. ‘At the moment, there is pent-up consumer demand and rising commodity prices – it might only be cyclical inflation, but people have got so used to there being no inflation that if it does pick up, valuation will matter. So I think the risk/reward is more in the value stocks where no-one is looking’, he comments, pointing out that the low discount rates on which many growth stock valuations are predicated will look increasingly unsustainable as yields go up.
TRG’s bottom-up investment process is founded on in-depth research and frequent interactions with companies, which have continued unabated during the pandemic. ‘We do a lot of calls, trying to find inflection points and signs of improving returns on investment’, says Beckett. While valuation is important, the manager is keen to stress that TRG is not a ‘deep value’ fund. ‘We are valuation aware but we have a lot of growth in the portfolio’, he explains. ‘We will buy early-stage companies such as Kahoot [whose share price is up almost 700% over the last 12 months], which does online educational quizzes that are used in schools. Valuation matters to us and the other key difference from peers is our willingness to go down the market cap scale – over half our portfolio is below £500m free float.’ The manager points to the trend of large-cap investors in Europe increasingly looking towards the mid-cap space for opportunities, and says he anticipates that this shift could continue further down the market cap scale, which would benefit TRG’s holdings.
Looking ahead, Beckett says he believes TRG is well positioned for a global economic rebound, which would be positive for small-caps, value and cyclicals – all key areas of focus in the trust’s portfolio. ‘There will be bumps in the road, but we are broadly optimistic’, he says. ‘Our focus on valuation is key: we are looking for companies that actually generate cash, and many of those are also helping society.’
Asset allocation
Current portfolio positioning
At end-February 2021 there were 137 holdings in the TRG portfolio, a slight decrease from 140 a year previously. As shown in Exhibit 2, concentration in the top 10 holdings rose marginally over the period. It is important to note that in a diversified fund where most positions are relatively small – and particularly in volatile market conditions – the top holdings can move around a lot, so the fact that only four of the biggest positions at 28 February 2021 were in the top 10 a year earlier should not be seen as indicating wholesale change in the portfolio.
|
Exhibit 2: Top 10 holdings (as at 28 February 2021) |
||||||||||||||||||||||||||||||||||||||||||||||||||||||||||||||||||
|
||||||||||||||||||||||||||||||||||||||||||||||||||||||||||||||||||
Source: TR European Growth Trust, Edison Investment Research, Bloomberg, Morningstar. Note: *N/A where not in end-February 2020 top 10.
The geographical distribution of TRG’s holdings (Exhibit 3) is entirely an output of bottom-up stock selection. The biggest changes in weighting over the past year have been an increase of 3.6pp in Germany (home to two of the star performers in H121), and decreases of 3.3pp and 2.4pp respectively in Switzerland and France. The portfolio remains well diversified across Europe, both within and outside the euro area.
Exhibit 3: Portfolio top 10 geographic exposures (% unless stated)
Portfolio end-February 2021 |
Portfolio end-February 2020* |
Change (pp) |
|
Germany |
20.3 |
16.7 |
3.6 |
France |
13.3 |
15.7 |
(2.4) |
Sweden |
10.1 |
8.9 |
1.2 |
Netherlands |
8.6 |
8.3 |
0.3 |
Italy |
7.3 |
8.6 |
(1.3) |
Switzerland |
7.1 |
10.4 |
(3.3) |
Spain |
5.5 |
4.8 |
0.7 |
Ireland |
4.4 |
N/S |
N/A |
Belgium |
4.2 |
5.0 |
(0.8) |
Norway |
4.1 |
4.4 |
(0.3) |
Other |
15.1 |
17.2 |
(2.1) |
100.0 |
100.0 |
Source: TR European Growth Trust, Edison Investment Research. Note: N/S = not separately stated; may be included in ‘other’.
The sector breakdown (Exhibit 4) is more indicative of the team’s preference for attractively valued, cash-generative companies with good growth or recovery potential. Versus the index, Beckett says, ‘we are long industrials and consumer discretionary and marginally long financials – default rates are really low and a lot of banks are over-provisioned. We are underweight consumer staples and marginally underweight healthcare, as it is difficult to find value.’ Note that the exposures in the table are categorised according to index provider EMIX’s own sector definitions.
Exhibit 4: Portfolio sector exposure (% unless stated)
Portfolio end-February 2021 |
Portfolio end-February 2020* |
Change (pp) |
|
Industrial goods |
22.3 |
22.5 |
(0.2) |
Business providers |
18.8 |
15.1 |
3.7 |
Financials |
16.2 |
14.6 |
1.6 |
Technology |
15.3 |
15.4 |
(0.1) |
Basic materials |
9.5 |
12.3 |
(2.8) |
Consumer goods |
9.1 |
13.6 |
(4.5) |
Retail providers |
8.0 |
6.0 |
2.0 |
Natural resources |
0.8 |
0.6 |
0.2 |
100.0 |
100.0 |
Source: TR European Growth Trust, Edison Investment Research. Note: *Approximate at end-February 2020.
Portfolio turnover (see Investment process) has been somewhat higher than usual in the past 12 months, partly as a result of changes made by the team in reaction to the onset of the COVID-19 pandemic, where more highly leveraged stocks such as Wallenius Wilhelmsen and Air France-KLM were sold owing to a lack of visibility about the likely duration of business interruptions. The managers increased TRG’s own gearing during the March sell-off, enabling the trust to benefit to a greater extent from the subsequent market recovery. Exits were also made on valuation grounds, such as from Swiss online pharmacy Zur Rose (a natural pandemic beneficiary) and semiconductor company SOITEC, both of which had performed strongly. During H121, three positions – specialist paper manufacturer Ahlstrom-Munksjö, media company Mediawan and Italian capital equipment provider IMA – were sold after takeover bids. Beckett says the level of M&A activity shows there is interest in the types of companies he favours, albeit coming from outside the stock market, particularly from private equity buyers. ‘We have a more value-orientated portfolio, and people outside the stock market see that valuation matters’, he comments, adding that there remains a high level of uncommitted cash in the private equity sector. ‘Private equity buyers care about value, and they prefer companies that are not already levered so they can lever them up and increase returns.’
As well as the purchase of VIA Optronics at its October 2020 IPO (see Performance), the team initiated positions in undervalued Germany-listed wind farm developer EnergieKontor and market-leading Danish housebuilder HusCompagniet. Fugro, a seismic data specialist that is increasingly serving the renewable energy market, was repurchased after having been sold earlier in FY20. In the higher-growth segment, SLM Solutions, a 3D printer maker, was also added to the portfolio; Beckett points out that the pandemic has increased the appeal of 3D printing given the impact of supply chain disruption, and says SLM has had ‘rave reviews’ for its latest machine. More recently, the managers have begun looking beyond COVID-19 lockdowns, taking a position in Melia Hotels.
Exhibit 5: Portfolio characteristics versus benchmark
Metric |
TRG |
Index |
Dividend yield forecast (%) |
2.9 |
2.9 |
P/E forecast (x) |
14.9 |
15.5 |
Return on equity (%) |
9.5 |
11.9 |
Historic EPS growth (last three years) (%) |
11.7 |
10.2 |
Forecast EPS growth (next 12 months) (%) |
43.2 |
29.1 |
Net debt/EBITDA (x) |
1.1 |
2.4 |
Source: TR European Growth Trust, Edison Investment Research. Note: As at 31 October 2020 (net debt/EBITDA at 30 September 2020).
As shown in Exhibit 5, TRG’s holdings on average trade at lower forward P/E valuations than the benchmark (EMIX Smaller Europe ex-UK Index) average, with typically higher (currently in line) prospective dividend yields, and higher historical and projected earnings growth. Return on equity has historically also generally been higher than the index average, with the lower current level reflecting the portfolio focus on recovery stocks. This also feeds into the much higher level of forecast earnings growth; Beckett explains that upgrades are likely to come from those companies whose earnings outlook was depressed in 2020, rather than the highly favoured growth stocks, for which he cautions that the year-on-year comparison ‘will be hard’. The manager sees earnings upgrades as a key catalyst for a continued re-rating of value stocks in 2021.
Exhibit 6: Market cap breakdown versus benchmark
Market cap bracket |
TRG (%)* |
Index (%) |
£1-5bn |
43.1 |
72.9 |
£500m-£1bn |
26.7 |
15.4 |
Sub-£500m |
30.3 |
11.7 |
Source: TR European Growth Trust, Edison Investment Research. Note: *Adjusted for gearing. As at 31 October 2020.
Performance: Stellar returns since March 2020 sell-off
Exhibit 7: Five-year discrete performance data
12 months ending |
Share price |
NAV |
EMIX Smaller Europe ex-UK (%) |
MSCI Eur ex-UK (%) |
CBOE UK All Companies (%) |
28/02/17 |
44.7 |
43.0 |
32.8 |
27.3 |
23.7 |
28/02/18 |
40.3 |
24.9 |
18.3 |
12.1 |
4.4 |
28/02/19 |
(27.2) |
(19.0) |
(7.9) |
(2.8) |
1.6 |
29/02/20 |
1.3 |
3.1 |
6.2 |
7.0 |
(2.1) |
28/02/21 |
54.9 |
55.4 |
29.0 |
13.9 |
2.8 |
Source: Refinitiv. Note: All % on a total return basis in pounds sterling.
Having suffered a severe decline in NAV and share price in the COVID-19-driven stock market sell-off of March 2020, TRG has more than made up for its underperformance in recent months, diverging markedly from the benchmark index since the start of November 2020 (Exhibit 8, left-hand side). This has translated into one-year share price and NAV total returns (to 28 February; Exhibit 7) c 25pp above that of the EMIX Smaller Europe ex-UK index.
It is important to note that the managers’ investment style of buying good companies at depressed valuations has remained unchanged (and generally successful) over the long term, but the market’s focus on ‘growth at any price’ in recent years saw TRG underperform the index in the years to end-February 2019 and 2020. Despite this, recent returns have been sufficient to push even the three-year performance ahead of the benchmark, leading to outperformance over all periods shown in Exhibit 8 (RHS) and annualised share price and NAV total returns of c 13–14% for the past decade, compared with 10.3% pa from the benchmark.
|
Exhibit 8: Investment trust performance to 28 February 2021 |
||||||||
Price, NAV and benchmark total return performance, one-year rebased |
Price, NAV and benchmark total return performance (%) |
|||||||
|
|
|||||||
|
Source: Refinitiv, Edison Investment Research. Note: Three-, five- and 10-year performance figures annualised. |
||||||||
|
Exhibit 9: Share price and NAV total return performance, relative to indices (%) |
||||||||
|
One month |
Three months |
Six months |
One year |
Three years |
Five years |
10 years |
|
Price relative to EMIX Smaller Europe ex-UK |
0.4 |
0.9 |
13.4 |
20.1 |
(9.5) |
16.9 |
35.9 |
|
NAV relative to EMIX Smaller Europe ex-UK |
2.1 |
5.1 |
11.8 |
20.5 |
2.9 |
17.0 |
29.4 |
|
Price relative to MSCI Europe ex-UK |
1.1 |
7.3 |
24.1 |
36.0 |
(3.7) |
37.1 |
70.3 |
|
NAV relative to MSCI Europe ex-UK |
2.8 |
11.8 |
22.4 |
36.4 |
9.5 |
37.1 |
62.1 |
|
Price relative to CBOE UK All Companies |
(0.7) |
2.6 |
19.2 |
50.8 |
11.7 |
75.6 |
112.2 |
|
NAV relative to CBOE UK All Companies |
1.0 |
6.9 |
17.6 |
51.2 |
27.0 |
75.7 |
101.9 |
|
|
Source: Refinitiv, Edison Investment Research. Note: Data to end-February 2021. Geometric calculation. |
||||||||
As shown in Exhibit 9, the trust’s NAV total return has also beaten the returns on offer from large-cap European companies (measured by the MSCI Europe ex-UK Index) over all periods shown, with the share price total return outperforming over all but the three-year period. Performance versus the broad UK equity market is also impressive over most timeframes.
In terms of specific performance drivers, the winners in H121 came from a variety of areas: structural growth companies benefiting from lockdown trends, more cyclical value names re-rating as positive vaccine news brought forward expectations of economic recovery, greater investor appreciation of ‘hidden ESG stories’ in the portfolio, and the end of the Brexit transition period removing a layer of uncertainty. In the first category, online home furnishing store Westwing – the biggest detractor from performance in FY19 following its poorly handled IPO – found its feet in the pandemic as people focused on improving their surroundings, driving a share price rise of more than 350%. Swedish online DIY and furniture retailer BHG Group was another major contributor in this area. In the more cyclical category, longstanding top 10 holding Van Lanschot Kempen – a Dutch wealth manager – was also among the top contributors, while Brexit-hit ferry operator DFDS staged a recovery as the end of the transition period approached, and has continued to do well since the turn of the year, up 23% in 2021 to date. Rounding out the top five contributors, ‘circular economy’ waste management company Befesa did well as investors began to appreciate its contribution to tackling the world’s environmental challenges.
The two main drags on performance in H121 were Germany-listed specialist pharmaceutical distributor Medios and VIA Optronics, a German electronics company specialising in interactive display screens. Medios issued a profit warning after suffering supply chain problems during the pandemic, but had bounced back by the end of the year, to finish the period broadly where it started. VIA Optronics debuted on the New York Stock Exchange in October 2020 in what Beckett describes as a ‘poorly executed’ IPO; while the shares fell by c 50% in the weeks immediately after listing, they had made good on some of their losses by the end of the year, and currently stand at c 12% below the $15 issue price. In relative terms, an early exit from cloud communication platform Sinch on valuation grounds was also negative as the stock continued to perform strongly after it was sold, gaining 68.1% in TRG’s H121.
|
Exhibit 10: NAV performance versus benchmark over 10 years |
|
|
Source: Refinitiv, Edison Investment Research |
Peer group comparison
While the Association of Investment Companies’ European Smaller Companies sector contains only four funds, it encompasses a variety of investment approaches, leading to differing outcomes for investors over time. TRG – the second largest of the four funds – is the most overtly small-cap orientated (with close to 60% of its portfolio in sub-£1bn companies), and the least exposed to the highly valued growth and momentum strategies that had dominated the investment landscape in recent years. The return to favour of more ‘value’ and cyclical companies, as investors begin to look ahead to a post-lockdown reopening and economic recovery, has helped propel TRG to the top of the sector ranking for NAV total returns, more than doubling investors’ money over the 12 months to 16 March 2021. Its second position over three and five years is testament to TRG’s solid longer-term NAV performance even during a period where its investment style was at times unpopular, while it again ranks top over 10 years. It is interesting to note that Montanaro European Smaller Companies (MTE) – whose ultra-high growth focus is almost the total opposite of TRG’s valuation-aware approach – is in second place over one and 10 years and first in the other periods, while the other two funds, which tend to invest more in ‘quality growth’ names further up the market cap scale, have lagged.
As noted in the Fees & charges section, TRG has by far the lowest ongoing charges in the peer group, although it is also the only fund that may levy a performance fee, meaning shareholders could pay more if the trust significantly outperforms its benchmark (up to a cap of 2% pa). In spite of its strong recent performance record, TRG trades on the widest discount in the sector; it also has an above-average level of gearing. The discount disparity may be partly attributable to a lacklustre spell of performance in 2018/19, but also arguably reflects the recent investor preference for high growth and momentum strategies, which underpins MTE’s small premium to NAV. The 1.7% dividend yield ranks second in the peer group, although investors should note that European Assets Trust, which tops the sector with a current yield of 5.8%, has a fixed annual payout of 6% of NAV, which may be wholly or partly funded out of capital.
Exhibit 11: Selected peer group as at 17 March 2021*
% unless stated |
Market cap £m |
NAV TR |
NAV TR |
NAV TR |
NAV TR |
Ongoing |
Perf. |
Discount |
Net |
Dividend |
TR European Growth Trust |
671.5 |
121.7 |
37.7 |
133.7 |
276.0 |
0.7 |
Yes |
(12.2) |
109 |
1.7 |
European Assets Trust |
439.3 |
75.6 |
30.4 |
74.6 |
255.2 |
1.0 |
No |
(8.3) |
102 |
5.8 |
JPMorgan European Smaller Cos |
759.0 |
83.2 |
24.5 |
90.6 |
211.7 |
1.1 |
No |
(11.4) |
108 |
1.4 |
Montanaro European Smaller Cos |
282.3 |
87.1 |
79.3 |
170.7 |
262.5 |
1.2 |
No |
1.8 |
100 |
0.6 |
Simple average (4 funds) |
538.0 |
91.9 |
43.0 |
117.4 |
251.3 |
1.0 |
(7.5) |
105 |
2.4 |
|
TRG rank in peer group |
2 |
1 |
2 |
2 |
1 |
4 |
4 |
1 |
2 |
Source: Morningstar, Edison Investment Research. Note: *Performance as at 16 March 2021 based on ex-par NAV. TR = total return. TER = total expense ratio. Net gearing is total assets less cash and equivalents as a percentage of net assets.
Dividends: Well-placed for a return to growth in FY21
Although it invests principally for capital growth, TRG has had a long record of rewarding its shareholders through steadily growing regular dividends, which have been paid twice-yearly since FY18. Prior to FY20, dividends had been well covered by portfolio income (1.3x in FY19), but the impact of the COVID-19 pandemic on corporate profitability and cash flows caused a dramatic dip in revenues in FY20, leading to the 22.0p total dividend for the year (unchanged on FY19) being only c 0.7x covered, with the remainder funded from TRG’s reserves.
It is worth noting that owing to the dividend payment schedules of continental European companies, TRG’s income receipts are massively weighted to the second half of its financial year (1 January to 30 June). Thus, the initial ‘panic’ phase of the pandemic, in which many companies cut dividends as a precautionary measure, was largely encapsulated in TRG’s H220, with portfolio income falling by c 63% compared with H219. In H121, while dividend income of £1.6m was c 48% down on the restated H120 figure of £3.1m (£2.1m in the unaudited H120 accounts), it was above the £1.5m received in H119, which could lead investors to feel cautiously optimistic about a rebound in the remainder of the 2021 financial year.
TRG’s board has declared an interim dividend of 8.2p per share in respect of H121, a 5.1% increase on the H120 figure. Based on the current share price (which investors should note has risen by c 59% since the end of FY20) and the last two dividends, TRG has a dividend yield of 1.7%. After accounting for both the FY20 final dividend and the H121 interim (paid after the period end), but excluding any dividend receipts in H221 to date, TRG has revenue reserves of 26.9p per share, sufficient to sustain annual dividends at the FY20 level for nearly 15 months, suggesting that the trust is well placed to resume its pattern of dividend growth in FY21. The regular dividend (excluding specials) has grown at a compound annual rate of 25.7% over the five years to end-FY20.
|
Exhibit 12: Dividend history since FY15 |
|
|
Source: Bloomberg, Edison Investment Research |
Discount: Strong performance sees discount narrow
At 19 March 2021, TRG’s shares traded at a discount of 13.5% to cum-income NAV. This is broadly in line with both short- and longer-term averages (14.5%, 12.5%, 11.5% and 13.1% respectively over one, three, five and 10 years), although as can be seen in Exhibit 13, there was a period in late 2017 and early 2018 during which the shares traded at a small premium. This came amid a spell of particularly strong NAV performance, and given the trust’s value-tilted small-cap approach seems once again to be in favour with investors, we believe the discount – which has decreased in recent months from c 20% in the summer of 2020 – has scope to narrow further from its current level.
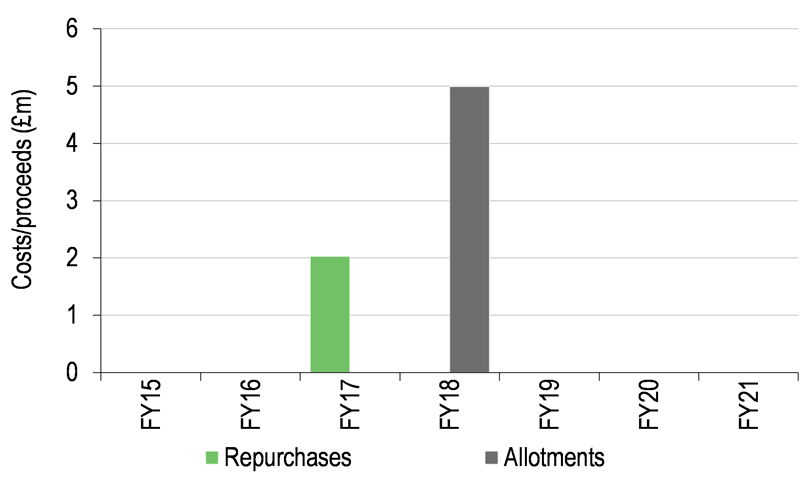
While the board retains the authority to repurchase up to 14.99% of shares or allot shares up to the equivalent of 5% of the share capital, in order to manage a discount or a premium, in practice these powers are used sparingly, and there have been no repurchases since the summer of 2016. As shown in Exhibit 14, there was a limited amount of share issuance (c £5m) in FY18 to meet excess demand while the shares were trading at a premium.
|
Exhibit 13: Premium/discount over five years |
Exhibit 14: Buybacks and issuance |
|
|
|
Source: Refinitiv, Edison Investment Research |
Source: Morningstar, Edison Investment Research |
|
Exhibit 13: Premium/discount over five years |
|
|
Source: Refinitiv, Edison Investment Research |
|
Exhibit 14: Buybacks and issuance |
|
|
Source: Morningstar, Edison Investment Research |
Fund profile: Unlocking value in small-cap Europe
Launched in 1990, TRG invests for long-term capital growth in a diversified portfolio of smaller European (ex-UK) companies that its managers believe are good value. The investment team at Janus Henderson Investors – lead manager (since 2011) Ollie Beckett, assisted by Rory Stokes and Julia Scheufler – employs an unconstrained, bottom-up approach to portfolio construction. The fund is biased towards the smaller end of the small-cap universe, with c 57% of TRG’s assets (at 31 October 2020) invested in companies with a market capitalisation below £1bn. Smaller companies may carry a higher risk of failure and can be illiquid, so TRG’s managers prefer to mitigate stock-specific risk by holding a relatively long list of stocks (c 120–150). There is a maximum individual position size of 7%, although in practice few holdings exceed 2% of the total. While the trust is permitted to hold unquoted investments (prior board approval is required), it currently has no such positions. TRG measures its performance against the EMIX Smaller Europe ex-UK Index (in sterling terms) and is a member of the AIC’s European Smaller Companies sector.
While TRG’s main aim is to achieve capital growth, it also has a long record of year-on-year dividend growth and since FY18 has paid an interim as well as a final dividend to spread income more evenly through the year.
Investment process: Seeking mispriced growth
In order to achieve their aim of capturing the capital growth potential of small- to mid-cap European companies, TRG’s managers invest on a bottom-up basis in securities that they believe to be mispriced relative to long-term fundamentals. The trust’s investment universe covers c 2,000 stocks across Europe with a market capitalisation below €4bn, from which Beckett, Stokes and Scheufler build a diversified portfolio of c 120–150 stocks. Using a range of quantitative screens, the team filters the opportunity set for attractive but undervalued companies. By undertaking hundreds of company meetings each year, they aim to assess the durability of business models, quality of management, drivers of growth and catalysts for revaluation. They also take account of in-house and external company research. For each potential investee company, the team builds financial models, using different valuation metrics to gain an understanding of the relationship between a firm’s growth potential and its current valuation. The portfolio is built on a bottom-up basis, with no constraints on country or sector weighting, and position sizes are based on the managers’ degree of conviction, although they rarely exceed c 2%, given the focus on diversification.
Beckett, Stokes and Scheufler view their investment universe in terms of a company lifecycle with four stages. The managers comment that the majority of investors tend to concentrate their efforts in the middle two segments, meaning they could be missing out on attractive opportunities.
■
Early cycle (c 12% of the portfolio at 30 November 2020) – young companies with growing returns on capital, a clear strategy and operating leverage. The key valuation metric is enterprise value to sales (EV/sales). Current examples include menu kit supplier HelloFresh and Aker BioMarine, whose focus on harvesting krill (a low-carbon-intensity source of protein) also plays into the ESG angle.
■
Quality growth (c 36%) – companies with high returns on capital, growing revenues, sustainable margins and strong competitive positions. The team uses valuation metrics including P/E multiples, EV/EBIT (earnings before interest and tax) and EV to invested capital (EV/IC). TKH – which the team says has transformed itself from a ‘boring telecom company’ to a multi-industry leader in high-tech applications such as rail safety – is an example in this category.
■
Mature (c 25%) – cash-generative companies with steady returns on capital, whose shares are trading inexpensively versus the value of their assets. Valuation metrics include EV/IC, EV/EBIT and free cash flow (FCF) yield. A good example is campervan manufacturer Trigano, which Beckett expects to benefit as a result of the COVID-19 pandemic given that recreational vehicles can facilitate ‘self-sufficient’ holidays.
■
Turnarounds (c 27%) – companies that may have suffered declining growth or a specific setback, but where management cost-cutting or asset disposals may spark an improvement in margins. Companies are valued on EV/IC, EV/EBIT and FCF yield. Swiss holding company Conzzeta is an example in this category, with a relatively steady c 70% rise in its share price in the past 12 months suggesting that its operational improvements are beginning to be appreciated by investors.
While the team has a definite focus on mispriced securities, the managers stress that this ‘value’ focus does not mean they eschew ‘growth’ stocks. ‘We will buy growth, but only at a reasonable price’, says Beckett. Stocks may be sold when they reach the managers’ assessment of fair value, if worsening fundamentals call the original investment thesis into question (such as companies with weaker balance sheets whose business may be exposed to lockdowns), or where the managers see better-value opportunities elsewhere. Portfolio turnover averages c 50–60% a year (56.2% in FY20 versus 57.6% in FY19, rising to an annualised 64.6% in H121), implying a holding period of around 18 months to two years, although many companies are held for much longer than this.
TRG’s approach to ESG
The trust has recently made significant strides in articulating its approach to environmental, social and governance (ESG) factors, although a consideration of these has long been a part of the stock selection process. This is based on the core belief that companies which score well on ESG and sustainability warrant a valuation premium over time. When assessing environmental and social considerations, TRG’s managers work with Janus Henderson’s in-house governance and responsible investment (GRI) team, as well as considering third-party ESG risk reports. As corporate governance can have a direct and dramatic impact on the outcome of an investment, this is a key element in the team’s construction of an investment thesis, and the managers regularly engage with and challenge companies on corporate governance issues.
TRG has a focus on investing in businesses that have a positive impact on the development of a sustainable global economy, and the portfolio has significant alignment with the United Nations’ Sustainable Development Goals (SDGs), a set of targets to tackle some of humanity’s greatest challenges, including poverty, inequality, access to education and employment, health, climate change and environmental degradation. Currently the trust’s portfolio holdings align with 14 of the 17 SDGs, most notably in the areas of industry, innovation and infrastructure (21 holdings), although there is also significant exposure to the themes of good health and wellbeing, affordable and clean energy, and sustainable cities and communities.
Gearing: Moderate gearing helps access opportunities
TRG is permitted to gear up to 30% of net assets, although its normal working range is 0–15%. It may also hold up to 20% in cash and/or fixed income. The trust has a £100m multicurrency overdraft facility with HSBC Bank, which represents available gearing of c 13% based on the current NAV. At end-H121 (31 December 2020), £53.2m of the overdraft was drawn, a c £5m increase from £48.3m at end-FY20 (30 June). However, given the trust’s strong performance in the first half of FY21, the level of net gearing actually fell during the period, from 9% at 30 June 2020 to 8% at 31 December. The long-term level of net gearing, which is used flexibly in response to investment opportunities, has tended to be largely in line with the current level (9% at 28 February 2021), in a range broadly from high single digits to the low teens. The highest level of gearing in the past 12 months was 14% at end-March 2020, partly an active decision but also reflecting a declining NAV during the widespread market sell-off.
Fees & charges: Competitive even with performance fee
With base ongoing charges of 0.73% at end-FY20 (FY19: 0.72%), TRG is the lowest-charging fund in its peer group (see Exhibit 11) by some margin. Janus Henderson Investors is paid an annual management fee of 0.6% of net assets up to £500m and 0.5% thereafter, while a performance fee (15% of excess performance, subject to a cap on total fees at 2.0% of net assets) may also be payable if TRG’s NAV total return outperforms the benchmark EMIX Smaller Europe exUK Index by more than 1.0% on a rolling three-year basis. In H121, a performance fee of just over £1m was accrued; including this and based on average net assets, we calculate annualised ongoing charges including the performance fee to be 0.95%, which is still lower than the peer group average. No performance fee was paid in respect of FY20 or FY19.
Capital structure
|
Exhibit 15: Major shareholders |
Exhibit 16: Average daily volume |
|
|
|
Source: Bloomberg, as at 26 January 2021. |
Source: Refinitiv. 12 months to 19 March 2021. |
|
Exhibit 15: Major shareholders |
|
|
Source: Bloomberg, as at 26 January 2021. |
|
Exhibit 16: Average daily volume |
|
|
Source: Refinitiv. 12 months to 19 March 2021. |
TRG is a conventional investment trust with one class of share. At 17 March 2021, there were 50.1m ordinary shares in issue, a level unchanged since November 2017. As shown in Exhibit 15, TRG has a significant level of retail investor ownership, with the top three shareholders (accounting for 24.1% of the share base) being direct-to-consumer platforms. However, the register also includes significant representation from more discount-focused institutions such as Wells Capital, City of London IM and Lazard, alongside traditional wealth managers such as Investec, Brewin Dolphin and Rathbones. There is a reasonable level of trading liquidity in the shares (Exhibit 16), with an average of 81,500 shares changing hands every day over the 12 months to 19 March 2021.
The board
Exhibit 17: TRG’s board of directors
Board member |
Year of appointment |
Remuneration in FY20 |
Shareholdings at end-H121 |
Christopher Casey (chairman) |
2010 (2019 as chairman) |
£38,000 |
6,000 |
Andrew Martin Smith |
2008 |
£30,000 |
10,000 |
Alexander Mettenheimer |
2011 |
£30,000 |
2,000 |
Simona Heidempergher |
2014 |
£30,000 |
1,600 |
Ann Grevelius |
2019 (September) |
£30,000* |
N/A |
Dan Burgess (audit cttee chair) |
2019 (November) |
£34,000* |
N/A |
Source: TR European Growth Trust. Note: *Equivalent fee for full year’s service.
Andrew Martin Smith had been due to retire from the board at the November 2020 AGM, but has agreed to stay on for one more year to help TRG navigate the unusual market and economic conditions arising from the COVID-19 pandemic. Historically the trust has had five directors rather than six, with three of the current board hailing from continental Europe.
|
|
Research: TMT
Boku reported strong results for FY20, with adjusted revenue and EBITDA growth of 20% and 106% respectively. The Payments business benefited from increased consumer demand during the pandemic, while the Identity business had a more difficult year. Trading year to date has been strong for both businesses and management is confident of meeting expectations for FY21. We have made minor changes to our FY21/22 forecasts. The evolution of the platform to address the wider alternative payments market provides upside potential to our forecasts and the share price.