Vermilion Energy’s geographically diverse portfolio spreads geopolitical and pricing risk across different economies. The company has grown both organically and inorganically, and has delivered on environmental, social and corporate governance (ESG) objectives, being highly rated across multiple ESG rating platforms. Notwithstanding this, Vermilion has been affected by COVID-19 and has had to reassess its strategy on cash returns to shareholders. The board suspended the dividend, appointed Lorenzo Donadeo and Curtis Hicks as executive chairman and president of the company respectively, and created an executive committee. The committee’s mission is to reinstate Vermilion’s core business principles and restore investor confidence in this diverse, flexible operating company. We have updated our valuation using FY21e metrics, resulting in a blended valuation of C$9.6/share. However, the valuation remains highly sensitive to commodity price assumptions.
Written by
Vermilion Energy |
Back to basics |
Financial update and outlook |
Oil & gas |
14 September 2020 |
Share price performance
Business description
Next events
Analysts
Vermilion Energy is a research client of Edison Investment Research Limited |
|||||||||||||||||||||||||||||||||||||||||||||||
Vermilion Energy’s geographically diverse portfolio spreads geopolitical and pricing risk across different economies. The company has grown both organically and inorganically, and has delivered on environmental, social and corporate governance (ESG) objectives, being highly rated across multiple ESG rating platforms. Notwithstanding this, Vermilion has been affected by COVID-19 and has had to reassess its strategy on cash returns to shareholders. The board suspended the dividend, appointed Lorenzo Donadeo and Curtis Hicks as executive chairman and president of the company respectively, and created an executive committee. The committee’s mission is to reinstate Vermilion’s core business principles and restore investor confidence in this diverse, flexible operating company. We have updated our valuation using FY21e metrics, resulting in a blended valuation of C$9.6/share. However, the valuation remains highly sensitive to commodity price assumptions.
Year-end |
Revenue (C$m) |
EBITDA* |
Operating cash |
Net debt** |
Capex*** |
Dividend |
12/18 |
1,526 |
1,037 |
816 |
1,769 |
(518) |
70 |
12/19 |
1,747 |
976 |
823 |
1,896 |
(523) |
71 |
12/20e |
1,094 |
569 |
523 |
1,972 |
(360) |
15 |
12/21e |
1,222 |
713 |
663 |
1,734 |
(401) |
0 |
Note: *Reported EBITDA includes hedging and FX gains/losses. **Net debt = long-term debt, plus short-term debt minus cash and equivalents. ***Excluding acquisitions.
Reinstating Vermilion’s core principles
In May 2020, Vermilion announced that Anthony Marino had stepped down as president and chief executive officer (CEO) of the company. In lieu of filling the role of CEO, Vermilion has created an executive committee. With the return of Mr Donadeo and Mr Hicks, the executive committee is now focused on returning to Vermilion’s original core business principles based on a conservative, long-term focus on balance sheet strength and capital discipline to generate returns.
Focused on ESG while reducing debt levels
Vermilion’s main priority is to reduce its debt and to that end it has suspended the dividend and reduced current capex. It will continue to find additional operational efficiencies and cost reductions, but never at the expense of ESG. Vermilion recently received ‘AA’ in the MSCI ESG Ratings assessment, establishing it as one of the industry leaders in ESG. With general funds reducing exposure to energy stocks, having high ESG ratings could be critical for Vermilion to access capital, which is increasingly difficult.
Valuation: Blended valuation at C$9.6/share
Our valuation of Vermilion is now based on a blend of FY21e P/CF and EV/EBITDA multiples, and FY21e FCF + growth. Its peer group currently trades at a c 52% discount to end-2019 values, still reflecting the impact of COVID-19 on commodity prices. However, Vermilion is trading at a c 80% discount compared to end 2019. We believe this reflects its high leverage and FY20e net debt to EBITDA level of c 3.7x compared to its peers. Our blended valuation stands at C$9.6/share, up 9% due to higher forecast price realisations in FY21.
Investment summary
Pay down debt before revisiting cash returns to shareholders
Vermilion has production assets in a range of mature basins and developed economies: Canada, the US, France, the Netherlands, Ireland, Germany and Australia, and diverse exposure to different commodity prices. Like most oil & gas companies, Vermilion’s financial results were affected by COVID-19, although it recorded strong Q220 operational performance. Meanwhile the company’s board of directors decided that a new management team was required to navigate the current economic and commodity price volatility, and in May 2020 announced the appointments of Lorenzo Donadeo and Curtis Hicks as executive chairman and president of the company respectively. Both have been key contributors to Vermilion’s growth and business culture in the past and have now returned to reinstate the company’s core principles and return confidence to its investor base. The main priority is to pay down debt ahead of revisiting any future cash returns to shareholders. Vermilion has been awarded a Leadership Level rating of A- by CDP every year since 2017, and received an AA rating in the June 2020 MSCI ESG Ratings assessment, establishing it as one of the industry leaders in managing the most significant ESG risks and opportunities.
Valuation: C$9.6/share
Our blended valuation approach uses fundamental and market metrics, where we look across a peer group of 72 global listed E&Ps to establish comparable multiples and operational metrics for companies with similar levels of production and market capitalisation. Vermilion currently trades at an FY21e P/CF of 0.9x relative to Canadian, US and rest of the world group peers, which trade at 2.0x, 2.6x and 3.8x respectively. Vermilion’s EV/EBITDA multiple for FY21e stands at 3.8x and is also at a discount to Canadian and US peers, which trade at 4.5x and 5.1x respectively, and in line with the rest of the world group, which trades at 3.8x. We believe this discount may reflect Vermilion’s current reduced yield and its relatively high leverage metrics such as a net debt to EBITDA ratio of 3.7x for FY20e, while peers trade at lower multiples of 3.4x, 2.9x and 2.1x. In combination with our free cash flow (FCF) (plus growth projects) valuation, this results in a blended valuation of C$9.6/share, a 147% premium to the current share price.
Financials: Net debt/EBITDA below covenant at current prices
Low financial leverage, capital discipline and cost reductions have enabled Vermilion to withstand commodity price volatility for over 15 years. More recently, the company had deviated from these principles to maintain its dividend. However, the new management team is committed to return to Vermilion’s core business principles and the priority is to pay down debt. With most of the capex for the year already invested, we stress test the impact of differing commodity price scenarios on total debt to EBITDA. Under our commodity price assumptions, we anticipate end-FY20e net debt of c C$2.0bn at an FY20 estimated total debt/EBITDA ratio of 3.6x, which is below current covenants of 4.0x. At a 10% discount to the base case scenario, estimated FY20 total debt/EBITDA increases to 4.1x. However, we believe that at these levels Vermilion would be able to renegotiate its debt. We also stress test management’s target of net debt to FFO under 1.5x.
Risks and sensitivities
Vermilion is highly leveraged to commodity prices. Despite its hedging portfolio, any significant drop in commodity prices to the levels seen in March 2020, with Brent trading under US$30/bbl, would leave the company’s balance sheet in a delicate position. However, Lorenzo Donadeo and Curtis Hicks have proved in the past that they are capable of leading the company even during periods of high volatility in the market and their main focus is to strengthen Vermilion’s balance sheet.
Diverse E&P portfolio to spread risk
Vermilion is a global E&P with operations spanning developed economies including Europe, North America and Australia. A detailed description of Vermilion’s diverse asset base can be found in Appendix A or in our initiation note published on 23 May 2018. Commodity price exposure is also diversified, with realisations spread across several global oil and gas benchmarks including Brent, WTI, Henry Hub, TTF and NBP.
Vermilion has grown organically and inorganically. It chose to focus on three regions that offer relatively stable political, fiscal and regulatory regimes: Europe, North America and Australia. For 2020, management estimates that the contributions to FFO from oil (Brent), European gas, North American gas and oil/condensate (WTI) will be 24%, 20%, 8% and 48%, respectively. It estimates the 2020 geographical breakdown as Canada 42%, France 15%, Ireland 14%, Netherlands 11%, Australia 10%, US 6% and Germany 2%.
|
Exhibit 1: Vermilion’s geographic presence |
|
|
Source: Edison Investment Research, Vermilion Energy |
Restoring Vermilion’s core business principles
In May 2020, Vermilion announced that Anthony Marino had stepped down as president and CEO of the company. The board also announced the appointments of Lorenzo Donadeo as executive chairman and the Curtis Hicks as president. Mr Donadeo was a co-founder of Vermilion in 1994, served as CEO between 2003 and 2016 and has been chairman of the board since March 2016. Mr Hicks was executive VP and CFO of Vermilion from 2003 to 2018, and a key contributor to the company’s growth and business culture.
In lieu of filling the role of CEO, Vermilion has created an executive committee consisting of a minimum of five senior executives. This will include the executive chairman, president, chief operating officer (COO), chief financial officer (CFO), executive VP of People and Culture and the VP of Business Development. The Executive Committee will review and approve key organisational, financial, operational and strategic decisions for the company. This structure has been used by Vermilion in the past and facilitates collaborative decision-making based on the collective knowledge and experience of the team.
With the return of Mr Donadeo and Mr Hicks to the company’s leadership, Vermilion is now focused on returning to its original core business principles as a relatively low-risk operator with a diverse portfolio and exposure to different commodity prices. These principles are based on a conservative, long-term focus on balance sheet strength and capital discipline to generate strong returns.
In recent years, the company had drifted from these principles, with debt escalating while management remained overly committed to the dividend strategy. The focus is now to return to the original business principles, which include maintaining a strong balance sheet with low financial leverage, consistently delivering results that meet or exceed expectations (as has already been observed in Q220), and to protect equity and minimise dilution.
Through its 26-year history, Vermilion has experienced severe downturns. However, it has recovered and learned from them by abiding with these principles, which provide flexibility and balance sheet headroom during periods of low commodity prices. The new management believes the company will be able to get back on a strong footing.
Paying down debt at the top of Vermilion’s near-term priorities
Management’s current main priority is to pay down debt, with a longer-term target of reducing its net debt to fund flows from operations ratio to below 1.5x from the end-June 2020 level of 3.2x. To that end, Vermilion will continue to navigate through COVID-19 and its economic consequences with a primary focus on health and safety, and preserving cash flow generation through capex and cost reductions. Projects are under review to determine appropriate capital allocation, with a focus on profitable production. However, we note that this could be at the expense of production growth in the short term.
In the future, management intends to revisit cash returns to shareholders, either through dividends (more modest than before) or share buybacks. However, the company has no timetable defined as debt reduction is the priority and this will be driven by commodity price realisations.
Environmental sustainability central to strategy
Vermilion is committed to playing a meaningful role in energy transition and aims to be a best-in -class producer as the world moves towards low carbon. To achieve this, it continues to implement energy and emissions efficiency projects throughout its operations, while in France it has developed geothermal projects, deploying renewable energy that has synergies with its expertise in areas such as geoscience and drilling. By focusing on reducing the environmental impacts of traditional energy production while developing renewable energy projects, Vermilion believes it will attract sustainability-oriented investors, governments and citizens and that this will also enhance its licence to operate across its portfolio.
The company has been awarded a Leadership Level rating of A- by CDP (formerly known as Carbon Disclosure Project) every year since 2017 and is one of only two Canadian and 16 global oil and gas sector companies to achieve this in 2019. Vermilion also received a rating of ‘AA’ on a scale of AAA (leader) to CCC (laggard) in the June 2020 MSCI ESG Ratings assessment, which reflects exposure to industry-specific ESG risks and the ability to manage those risks.
Lower carbon fuels and reducing emissions
The company has a track record of diversifying its production portfolio, and currently produces a mix of light oil and liquids-rich natural gas in Canada and the US, together with natural gas across its European assets. Between 2012 and 2018, Vermilion shifted its production mix from a 67% weighting of oil compared to natural gas and natural gas liquids to 44%. In addition, a focus on reducing flaring and venting in SE Saskatchewan has exceeded emissions reduction targets and seen a year-on-year emissions reduction of 11,484tCO2e between 2007 and 2018.
|
Exhibit 2: SE Saskatchewan emissions intensity per boe (2018 increase due to Spartan asset acquisition) |
Exhibit 3: SE Saskatchewan emissions compared to operated production |
|
|
|
Source: Vermilion Energy |
|
Exhibit 2: SE Saskatchewan emissions intensity per boe (2018 increase due to Spartan asset acquisition) |
|
|
Source: Vermilion Energy |
|
Exhibit 3: SE Saskatchewan emissions compared to operated production |
|
|
Source: Vermilion Energy |
The Spartan assets, acquired in 2018, had an emissions intensity c 3.5x the company’s existing Canadian production and resulted in an increase in emission intensity, reflected in Exhibits 2 and 3. Vermilion is committed to reducing these emissions, as it did with its original SE Saskatchewan production, and is targeting a 50% reduction in flaring and venting emissions from the Spartan assets by 2024. The company succeeded in reducing emissions intensity by 45% between 2014 and 2017, even as it increased energy production.
Renewable energy: Harnessing geothermal heat
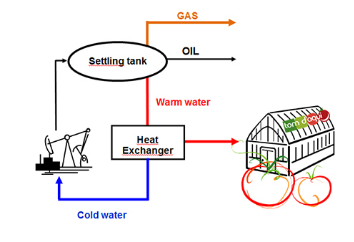
Vermilion has been providing heat free of charge and free of carbon emissions to the Tom d’Aqui tomato growing operative in France since 2012. The project utilises naturally heated water produced from the company’s nearby Parentis field to heat the Tom d’Aqui greenhouses, resulting in a reduction in CO2 emissions of 10,000 tonnes a year. The success of the project served as a catalyst for three new similar projects independent of Vermilion.
|
Exhibit 4: Schematic of extraction of geothermal heat for industrial scaled agriculture |
|
|
Source: Vermilion Energy |
Vermilion is also using a similar geothermal concept to support an eco-neighbourhood in La-Teste, France. It uses recycled geothermal energy from its three oil producing fields in the Arcachon Basin to heat 550 apartments, saving 50% of the heating bill for the residents and 500 tonnes per year of CO2. Vermilion is now expanding this to Itteville in France where it will provide geothermal heat to a planned eco-district of 900 social housing apartments until 2040. Construction is expected to take four to five years.
Delivered positive cash flows despite pandemic
Vermilion’s operations are focused across its three core regions of North America, Europe and Australia. North America provides the largest contribution to total production at a FY20 management estimate of c 66%, and is dominated by production from Canada, while Europe is expected to deliver c 29% and Australia c 5%. In addition to being diversified geographically, the asset base is allocated across both oil and gas resources and, since the majority of these are conventional, experiences lower decline rates.
In 2020, the company had front-loaded its capital programme so that most of its drilling and completion activity (primarily in Canada and the US) had been completed before COVID-19 measures were introduced. The second quarter of 2020 was a challenging period for the oil and gas industry. The COVID-19 pandemic resulted in unprecedented negative oil prices for the WTI benchmark as global demand diminished, inventories swelled and European gas prices decreased to record lows.
European natural gas prices under pressure
The COVID-19 pandemic exacerbated the natural gas glut European markets were already facing. Dutch TTF and UK NBP prices have been at historic lows due to increased oversupply in the European and global LNG markets. Russia has traditionally been the main supplier of natural gas to Europe. However, the ramp-up of new LNG facilities in the US led to an overflow of natural gas in European terminals. The average TTF price was US$4.8/mmBtu in 2019, down from US$7.7/mmBtu in 2018. The price has recently fallen even further and is currently US$3.0/mmBtu.
We believe prices will remain low throughout Q320, and only start to recover in Q420 with the arrival of winter and as growing seasonal consumption is observed. Utilisation rates for LNG plants in the US have already fallen below 70% and are likely to decline further in Q320, although this will depend on prices in Europe and Asia, and the continued impact of COVID-19 in Europe.
|
Exhibit 5: TTF prices since 2018 |
Exhibit 6: NBP prices since 2018 |
|
|
|
Source: Edison Investment Research, Bloomberg |
|
Exhibit 5: TTF prices since 2018 |
|
|
Source: Edison Investment Research, Bloomberg |
|
Exhibit 6: NBP prices since 2018 |
|
|
Source: Edison Investment Research, Bloomberg |
Nonetheless, Vermilion was able to manage its business effectively, with relatively little operational impact from COVID-19. Production averaged 100,366boed in Q220, a 3% increase on Q120. Most of the increase came from the North American operations, which benefited from new production coming online following an active Q120 drilling programme. Growth in North American production volumes more than offset the c 3,000bbld of curtailed oil production in France, which was temporarily shut in due to a local refinery being offline during the COVID-19 confinement period. The refinery has recently restarted and the company is resuming production in France.
As a result of lower commodity prices in Q220, FFO decreased 52% vs Q120 to C$82m. However, due to a capital investment of only C$42m, free cash flow for the quarter was positive and stood at c C$40m. Net debt at the end of H120 stood at C$2.1bn. Capital activity for the remainder of the year will be minimal and focused predominantly on maintenance activities. Our revised forecasts include the following changes:
1.
Slightly higher production forecast for FY20 and FY21. Q220 production was higher than our last estimate by 2% at 100.4kboed. Our 2020 production estimate now stands at 96.8kboed, within the company’s updated guidance range of 94–98kboed.
2.
Our short-term commodity price forecasts. These include an increase in FY20 Brent to US$41.42/bbl (+25%) and WTI to US$35.50/bbl (+21%). Our FY20 and FY21 commodity price forecasts are based on EIA estimates (11 August 2020) and imply that given H120 price realisations, Brent and WTI would stand at an average of US$43.11/bbl and US$33.99/bbl for the remainder of the year, respectively.
3.
We have updated our 2020 forecast to incorporate realised production and capital expenditure in H120 and guidance for the year. For more detail on Vermilion’s current assets and H120 performance, please refer to the appendix.
The net impact of these changes on FFO is negligible, with our forecast FFO for FY20 at C$449m, in line with Vermilion estimates. These figures are highly leveraged to underlying commodity prices.
Exhibit 7: Edison changes to forecasts
Actuals |
Edison new |
Edison old |
Change |
||||
2019 |
2020e |
2021e |
2020e |
2021e |
2020e |
2021e |
|
Production (kboed) |
100.3 |
96.8 |
91.2 |
95.5 |
90.5 |
1% |
1% |
Revenues (C$m) |
1,747 |
1,094 |
1,222 |
1,115 |
1,164 |
-2% |
5% |
Adjusted EBITDA (C$m) |
962 |
455 |
672 |
488 |
620 |
-7% |
8% |
EBITDA (C$m) |
976 |
569 |
713 |
532 |
607 |
7% |
17% |
FFO (C$m) |
908 |
449 |
523 |
456 |
541 |
-2% |
-3% |
Capex ex acquisitions (C$m) |
523 |
360 |
401 |
360 |
401 |
0% |
0% |
Brent (US$/bbl) |
64.36 |
41.42 |
49.53 |
33.04 |
45.62 |
25% |
9% |
Source: Vermilion Energy, Edison Investment Research.
Vermilion is in the process of reviewing its projects with a view to allocating capital appropriately. In 2021, we expect oil projects across Canada and France to absorb more investment under current conditions, and for this to be mainly focused on workover and maintenance activities.
Risks and sensitivities
Key risks include:
■
Commodity price sensitivity: We provide a valuation sensitivity to key benchmark prices in the valuation section of this note. As with most companies in the E&P sector, the valuation is highly sensitive to underlying commodity prices.
■
Debt covenants: In this note we stress test Vermilion’s ability to keep total debt to EBITDA below 4.0x. Under our current commodity price assumptions, Vermilion’s estimated FY20 total debt/EBITDA stands at 3.6x and is highly sensitive to underlying price assumptions. However, we believe the company would be able to renegotiate its debt in the event the covenants were broken, as has happened in the past in times of high commodity price volatility. We also test Vermilion’s ability to reach its internal target of net debt to FFO below 1.5x. Net debt to FFO stood at 3.2x in June 2020, and it will take time, as well as rising commodity prices, for the company to reach its goal.
■
Subsurface risk: Estimates of 1P and 2P reserves are underpinned by assets that are already in production, hence the uncertainty of the reserve range is likely to be well defined. As with all companies in the sector, reserves and resources are defined by distributions, and the amount of oil and gas recovered can differ from published point values.
Executive Committee
Lorenzo Donadeo – executive chairman: Mr Donadeo has more than 35 years’ experience in the oil and gas business, including mergers and acquisitions, gas marketing, production, exploitation, and field operations in western Canada and internationally in Australia, France, the Netherlands, Germany, Ireland, and Trinidad and Tobago. He was a co-founder of Vermilion Resources (1994), now Vermilion Energy, and currently serves as chairman of the board. In 2015, Mr Donadeo was recognised for his outstanding service to France, with official appointment to the National Order of the Legion of Honour at the rank of Chevalier.
Curtis Hicks – president: Mr Hicks has over 35 years’ industry experience in the financial area of oil and gas operations, as well as property and corporate acquisitions. He was made president of Vermilion Energy in 2020 and prior to this was executive VP and CFO from 2004 to 2018. Mr Hicks joined Vermilion in 2003 as VP, Finance and CFO. In these roles, he helped guide Vermilion to expand operations from two countries in 2003 to 10 in 2018. From 2000 to 2003, he was VP, Finance and CFO at NAL Oil & Gas Trust, and from 1998 to 2000 he was CEO of Caravan Oil & Gas. Mr Hicks began his career with ELAN Energy in 1983, serving as VP, Finance and CFO.
Michael Kaluza – executive VP and COO: Mr Kaluza has spent over 32 years delivering results in North America and overseas in the energy business. He joined Vermilion in 2013 as director of the Canada Business Unit and prior to that was VP, Corporate Development and Planning at Baytex Energy. In 2016, he was appointed executive VP & COO of Vermilion Energy. His earlier roles included COO, at Delphi Energy and various technical and management positions at Dominion E&P/Dominion Exploration Canada and Phillips Petroleum Company.
Lars Glemser – VP and CFO: Mr Glemser has over 15 years’ experience, primarily in the financial area of oil and gas operations. He joined Vermilion in 2015 as operations controller and moved into an investor relations role in 2017, before advancing to director of finance in January 2018. In April 2018, he was appointed VP and CFO. He has more than a decade of industry experience with diverse roles in finance/treasury, corporate planning and corporate development with Vermilion, and previously with Lightstream Resources and Tristar Oil & Gas.
Mona Jasinski – VP, People and Culture: Ms Jasinski has over 27 years’ experience in human resources and organisational effectiveness, primarily in the oil and gas industry, including operations and mergers & acquisitions. Before joining Vermilion, she spent five years with Royal Dutch Shell, most recently as manager of Onshore Productions, North America, and Human Resources. Prior to that she worked at TransCanada Pipelines and in management consulting, specialising in strategy, leadership effectiveness and talent management. Ms Jasinski served on the board of directors of the Calgary YWCA from 2012 to 2017 as chair of the governance committee. She currently serves on the board of directors of the Calgary Petroleum Club as board governor.
Jenson Tan – VP, Business Development: Mr Tan has over 15 years’ experience in exploration, development, and commercial negotiation in North America, Europe, Australia and Asia in both technical and managerial roles. He joined Vermilion in 2010 in the business development group. Mr Tan became director of New Ventures in 2013 and was made VP of Business Development in 2017. Prior to joining Vermilion, he was asset team leader at ConocoPhillips Canada, managing production and development activities in Alberta and Saskatchewan. His earlier commercial and technical experience included work in various ConocoPhillips operating subsidiaries in the US Gulf Coast, China and Indonesia.
Valuation
We use a blended approach when valuing Vermilion. We have rolled forward our inputs by one year to include a combination of FY21e P/CF, EV/EBITDA and free cash flow (FCF) (plus growth projects). We have arrived at a valuation range of C$6.1–13.0/share, resulting in an average blended valuation of C$9.6/share (up 9%). This reflects the effects of higher price realisations in 2021. Exhibit 8 shows the differentials in the valuation metrics when we compare the market-based valuation (first two bars of exhibit) and the fundamentals-based valuation (last bar of exhibit).
|
Exhibit 8: Edison revised valuation with updated assumptions |
|
|
Source: Edison Investment Research. Note: Share price as at 11 September 2020. |
An important sensitivity to our forecasts and valuation lies in the prices of key commodities. Oil prices experienced a drastic decrease on 9 March 2020 (down c 60% from January 2020), as can be seen in Exhibit 9. As mentioned above, we have updated our short-term base case oil price forecasts for FY20 and FY21 to align them with the latest EIA guidance (11 August 2020).
|
Exhibit 9: Vermilion share price performance vs S&P oil & gas peers and Brent in 2020 |
|
|
Source: Edison Investment Research, Refinitiv as at 11 September 2020 |
We also note that since mid-March 2020, following the initial reaction to the coronavirus pandemic and to low oil prices, oil and gas companies’ market capitalisations have slightly recovered. It may be that the market is reacting positively to the industry response to lower commodity prices, including measures such as capex and dividend cuts/suspension to protect balance sheets, as well as possible OPEC+ production cuts.
In Exhibit 10, we provide sensitivities to commodity prices to reflect various oil price scenarios. We note that a 10% reduction in all key commodities (WTI, Brent, NBP, AECO and TTF) vs our base case forecasts would result in a c 31% fall in Vermilion’s FFO after including the impact of realised hedges on FY20.
Exhibit 10: FY20e FFO sensitivity to commodity prices
Brent (US$/bbl) |
29.0 |
33.1 |
37.3 |
41.4* |
45.6 |
49.7 |
53.8 |
WTI (US$/bbl) |
24.9 |
28.4 |
32.0 |
35.5 |
39.1 |
42.6 |
46.2 |
NBP (C$/mmBtu) |
2.4 |
2.7 |
3.1 |
3.4 |
3.7 |
4.1 |
4.4 |
AECO (C$/mmBtu) |
1.7 |
1.9 |
2.1 |
2.4 |
2.6 |
2.8 |
3.1 |
TTF (C$/mmBtu) |
3.0 |
3.4 |
3.8 |
4.3 |
4.7 |
5.1 |
5.5 |
Realisation vs base (%) |
-30% |
-20% |
-10% |
0% |
10% |
20% |
30% |
FY20e FFO (C$m) |
16 |
167 |
308 |
449 |
590 |
725 |
867 |
Valuation (C$/share) |
-2.1 |
1.8 |
5.7 |
9.6 |
13.5 |
17.3 |
21.2 |
Source: Edison Investment Research. Note: *Column represents Edison base case forecasts for FY20.
Trading at a discount versus Canadian peers on P/CF multiple
In Exhibit 11, we provide a peer group valuation as at 11 September 2020, which reflects the impact of the macroeconomic headwinds the oil and gas industry is facing. The table shows that Vermilion’s FY21e P/CF and EV/EBITDA multiples are currently 0.9 and 3.8x, respectively. On a P/CF basis for FY21, we see that Vermilion trades at a significant discount to Canadian, US and rest of the world group peers, which trade at 2.0x, 2.6x and 3.8x respectively. Vermilion’s EV/EBITDA multiple for FY21 also trades at a discount to Canadian and US peers, which trade at 4.5x and 5.1x respectively, and in line with the rest of the world group, which trades at 3.8x. We believe this discount probably reflects Vermilion’s recent dividend yield reduction and its relatively high leverage metrics such as a net debt to EBITDA ratio of 3.7x for FY20e, while peers trade at lower multiples of 3.4x, 2.9x and 1.9x.
Exhibit 11: Peer group valuation table
Company |
Market cap |
EV |
P/CF FY20e |
P/CF FY21e |
EV/EBITDA FY20e |
EV/EBITDA FY21e |
FCF Yield FY20e |
FCF Yield FY21e |
Net debt/ |
Net debt/ |
Dividend yield FY20e |
Production FY20e |
Prod growth FY20e |
EV/kboed FY20e |
Edison estimate - Vermilion |
450 |
2,011 |
1.2 |
0.9 |
4.8 |
3.8 |
26.5% |
42.8% |
3.7 |
3.0 |
14.8% |
96.8 |
-3.5% |
20.8 |
Canada |
1,420 |
2,962 |
2.6 |
2.0 |
6.1 |
4.5 |
-6.2% |
0.5% |
3.4 |
2.6 |
2.1% |
129.9 |
1.5% |
17.6 |
Junior E&P<30kboed |
114 |
334 |
2.3 |
1.7 |
6.8 |
5.0 |
-8.9% |
-7.3% |
4.6 |
3.4 |
1.8% |
19.1 |
2.9% |
17.8 |
Bonterra Energy |
33 |
258 |
1.3 |
0.9 |
9.3 |
5.7 |
-5.7% |
-12.2% |
8.1 |
5.0 |
1.6% |
10.8 |
0.7% |
24.0 |
Crew Energy |
44 |
298 |
1.6 |
1.2 |
7.7 |
5.6 |
-29.0% |
-17.1% |
7.0 |
5.1 |
0.0% |
21.1 |
0.9% |
14.1 |
Kelt Exploration |
209 |
517 |
4.6 |
3.9 |
9.6 |
10.0 |
-28.9% |
-5.2% |
5.4 |
5.6 |
0.0% |
24.5 |
-28.0% |
21.1 |
Pipestone Energy |
90 |
268 |
2.7 |
1.1 |
7.2 |
3.0 |
-56.5% |
-81.3% |
3.9 |
1.6 |
0.0% |
16.6 |
51.0% |
16.1 |
Storm Resources |
184 |
283 |
4.4 |
3.0 |
5.5 |
3.8 |
2.8% |
11.3% |
1.9 |
1.3 |
0.0% |
23.7 |
9.8% |
12.0 |
Surge Energy |
66 |
384 |
1.3 |
1.3 |
6.8 |
5.7 |
5.5% |
11.2% |
5.9 |
4.9 |
10.6% |
17.9 |
-2.3% |
21.4 |
Tamarack Valley Energy |
125 |
289 |
1.4 |
1.3 |
3.0 |
3.0 |
7.6% |
0.6% |
1.7 |
1.7 |
0.0% |
21.3 |
0.0% |
13.6 |
TORC Oil & Gas |
240 |
523 |
2.6 |
2.0 |
6.7 |
4.3 |
5.9% |
15.3% |
3.1 |
2.0 |
3.7% |
25.9 |
-2.2% |
20.2 |
Yangarra Resources |
34 |
186 |
1.0 |
0.9 |
5.7 |
4.2 |
18.7% |
12.0% |
4.6 |
3.4 |
0.0% |
10.4 |
-3.9% |
17.9 |
Intermediate E&P>30kboed |
430 |
927 |
2.6 |
1.9 |
5.2 |
3.8 |
-11.8% |
1.2% |
2.5 |
2.0 |
2.0% |
61.5 |
1.4% |
15.8 |
Advantage Oil & Gas |
256 |
520 |
3.1 |
2.0 |
5.6 |
3.7 |
-7.8% |
0.7% |
2.4 |
1.6 |
0.0% |
45.4 |
-0.7% |
11.5 |
Baytex Energy |
243 |
1,699 |
1.0 |
1.0 |
5.8 |
4.9 |
-2.6% |
-10.6% |
4.8 |
4.1 |
0.0% |
80.3 |
-4.8% |
21.2 |
Birchcliff Energy |
293 |
945 |
2.3 |
1.3 |
6.0 |
3.8 |
-34.5% |
17.1% |
3.3 |
2.1 |
2.5% |
77.9 |
2.8% |
12.1 |
Canacol Energy |
488 |
800 |
3.8 |
3.0 |
3.7 |
3.1 |
9.1% |
9.6% |
1.5 |
1.3 |
2.3% |
31.1 |
15.3% |
25.8 |
Enerplus |
437 |
828 |
1.7 |
1.7 |
3.2 |
3.0 |
3.9% |
4.6% |
1.5 |
1.4 |
4.1% |
88.9 |
-4.4% |
9.3 |
Frontera Energy |
170 |
345 |
1.6 |
1.0 |
2.4 |
1.7 |
-23.2% |
2.4% |
0.5 |
0.4 |
7.4% |
47.3 |
-8.0% |
7.3 |
Nuvista Energy |
122 |
701 |
1.2 |
1.1 |
5.3 |
5.0 |
-26.4% |
-21.5% |
3.7 |
3.5 |
0.0% |
50.6 |
-0.5% |
13.8 |
Paramount Resources |
238 |
829 |
2.9 |
1.7 |
7.7 |
4.8 |
-35.2% |
-6.2% |
4.7 |
2.9 |
0.0% |
68.5 |
-1.9% |
12.1 |
Parex Resources |
1,735 |
1,402 |
6.7 |
4.5 |
5.9 |
3.3 |
7.3% |
11.6% |
(1.7) |
(0.9) |
0.0% |
46.4 |
12.4% |
30.2 |
Peyto Expl. & Dev. |
317 |
1,198 |
1.9 |
1.4 |
6.2 |
4.8 |
-8.3% |
4.1% |
4.5 |
3.4 |
3.5% |
78.8 |
3.5% |
15.2 |
Large E&P>100kboed |
5,029 |
10,296 |
2.9 |
2.4 |
6.6 |
4.9 |
7.1% |
11.0% |
3.1 |
2.5 |
2.9% |
410.1 |
-0.5% |
20.0 |
ARC Resources |
1,595 |
2,335 |
3.6 |
3.1 |
10.3 |
4.9 |
10.5% |
10.6% |
3.1 |
1.5 |
3.9% |
155.3 |
1.4% |
15.0 |
Canadian Natural Resources |
21,346 |
39,693 |
5.9 |
4.1 |
9.8 |
6.5 |
4.2% |
9.6% |
4.3 |
2.8 |
5.2% |
1,163.2 |
2.9% |
34.1 |
Crescent Point Energy |
754 |
2,802 |
1.2 |
1.5 |
3.6 |
5.0 |
16.1% |
6.8% |
3.0 |
4.2 |
3.1% |
120.6 |
-7.7% |
23.2 |
Ovintiv Inc |
2,256 |
9,658 |
1.3 |
1.2 |
4.8 |
4.4 |
-5.2% |
12.6% |
3.5 |
3.2 |
3.0% |
533.2 |
-3.2% |
18.1 |
Seven Generations Energy |
956 |
2,587 |
1.6 |
1.5 |
5.6 |
3.8 |
12.8% |
15.8% |
3.4 |
2.3 |
0.0% |
181.7 |
-0.7% |
14.2 |
Tourmaline Oil |
3,268 |
4,700 |
4.1 |
3.2 |
5.6 |
4.6 |
3.9% |
10.6% |
1.5 |
1.2 |
2.3% |
306.3 |
4.5% |
15.3 |
US intermediate/large E&P |
4,559 |
9,182 |
3.1 |
2.6 |
5.8 |
5.1 |
3.7% |
7.4% |
2.9 |
2.6 |
2.3% |
299.5 |
0.2% |
29.6 |
RoW intermediate/large E&P |
1,820 |
3,485 |
4.2 |
3.8 |
5.0 |
3.8 |
11.0% |
27.0% |
2.1 |
1.8 |
0.2% |
67.6 |
7.8% |
54.9 |
Average |
2,999 |
6,060 |
3.1 |
2.6 |
5.8 |
4.7 |
1.9% |
8.7% |
2.9 |
2.5 |
2.1% |
201.9 |
1.8% |
29.5 |
Source: Edison Investment Research, Refinitiv estimates. Note: Prices as at 11 September 2020.
Financials
In March 2020, Vermilion reduced its monthly dividend by 50% to C$0.115/share, as an initial response to weakness in commodity prices and global economic activity following the coronavirus outbreak. However, following the Russia/Saudi Arabia oil price war, coupled with the prospects of lower global oil demand for FY20, the company decided to further reduce its monthly dividend to C$0.02/share on 16 March 2020. On 15 April 2020, however, the board of directors decided to suspend the monthly dividend in tandem with a capex and cost reduction programme to protect the company’s balance sheet and preserve cash. This results in declared dividends for FY20 of c C$90m. Cash dividends in FY20 include the December 2019 dividend, and amount to c C$118m. The weakness in commodity prices also affected H120 financial results, with Vermilion recording a net loss of C$1,390m in the six months to June 2020, reflecting an impairment charge of C$1,635m. Impairment charges were incurred due to global commodity price forecasts deteriorating and decreases in demand due to COVID-19.
For 2020, we forecast operating cash flow of C$523m and funds from operations (FFO) of C$449m (Vermilion defines FFO as oil and natural gas revenues minus transportation, operating costs, general and administration, Petroleum Resource Rent Tax (PRRT), corporate income taxes, interest expense, realised gain on derivative instruments and foreign exchange, which excludes changes in working capital and asset retirement obligations). This does not cover the full amount of our combined estimated cash outflows of C$478m for the year, encompassing sustaining capex of C$360m, in line with company guidance, and cash dividends of C$118m, already paid. We expect year-end net debt (we assume net long-term debt, plus short-term debt minus cash and equivalents) of c C$2.0bn (C$2.1bn at end June 2020). Vermilion’s presented net debt is based on long-term debt plus current liabilities minus current assets and stood at C$2.2bn at end June 2020 (very slightly different to the Edison method, which shows C$2.1bn). In Exhibit 13 below, we show that at a 10% discount to our current commodity price assumptions, cash dividends already paid are covered. However, management may need to take further measures to cover planned sustaining capital. These could include additional cuts to sustaining capex and/or taking on more debt, although Vermilion needs to maintain gearing below current covenant limits.
Exhibit 12: Financial covenants and company target
Covenants |
Limit |
Jun-20 |
Dec-19 |
Consolidated total debt to consolidated EBITDA |
Less than 4.0 |
2.83 |
1.94 |
Consolidated total senior debt to consolidated EBITDA |
Less than 3.5 |
2.30 |
1.56 |
Consolidated EBITDA to consolidated interest expense |
Greater than 2.5 |
10.57 |
13.4 |
Management target |
|||
Net debt to FFO |
Less than 1.5 |
3.16 |
2.20 |
Source: Vermilion Energy, Edison Investment Research
We have stress tested our model for differing commodity prices. At our current commodity price assumptions, and assuming sustaining capex of C$360m for FY20, we calculate that the company could need to raise c C$29m by year end. At a 10% discount to the base case, Vermilion would need to raise c C$170m to cover the current (already paid) dividends and sustaining capex, or cut capex by the same amount. This would result in an estimated FY20 total debt to EBITDA ratio of 4.1x, slightly in breach of the 4.0X covenant. However, we believe Vermilion would be able to renegotiate its debt.
|
Exhibit 13: Vermilion FY20e FFO, dividend and sustaining capex |
|
|
Source: Edison Investment Research. Note: *Discount/premium on commodity prices. |
In Exhibit 14, we model the stress test for Vermilion’s total debt to EBITDA covenant. Since the company’s reported balance does not at present break down the debt components for the covenant calculation, we utilise long-term debt plus finance leases as a proxy for debt to EBITDA metric. We stress test total debt/EBITDA at a 10% discount to our base case commodity price scenario, corresponding to a realised Brent price of c US$35/bbl average for the remainder of the year, driving estimated FY20 total debt/EBITDA to 4.1x. We also stress test the balance sheet at a 20% discount to our base case commodity price scenario, corresponding to a realised Brent price of c US$26/bbl average for the remainder of 2020. With no further cuts in sustaining capex, this would drive estimated FY20 total debt/EBITDA to 4.9x. This analysis shows that, even after the capex reduction and dividend suspension, Vermilion’s balance sheet is highly sensitive to oil price assumptions. At low commodity price levels, its gearing multiples exceed the current total debt to EBITDA covenants. However, the company has room to cut capex and/or renegotiate debt and respective covenants. For FY21, assuming the dividend remains suspended and capex increases to C$401m, at our current price assumption and even at a 10% discount, the debt covenants are not exceeded. Vermilion has not provided any capex or production guidance for FY21 at this time, but we expect to see a slight increase in capex as commodity prices recover and demand normalises.
|
Exhibit 14: Debt, FFO and EBITDA base case sensitivities |
|
|
Source: Edison Investment Research. Note: *Impact of incremental net debt required in low case scenario (10% commodity prices: US$35/bbl Brent) maintaining sustaining capex in line with guidance. **Impact of incremental net debt required in low case scenario (-20% commodity prices: US$26/bbl Brent) preserving/maintaining sustaining capex in line with guidance. ***Impact of 10% lower commodity prices on net debt to FFO in FY21. ****Impact of 10% higher commodity prices on net debt to FFO in FY21. |
In Exhibit 14 we also present the impact of our estimated FFO for FY20 on management’s longer-term target metric of net debt to FFO below 1.5x. For FY20, under our current assumptions this will increase to 4.5x and starts decreasing in FY21 to 3.4x as commodity prices recover and the company focuses on reducing debt. If commodity prices in 2021 are 10% lower than our current assumption, net debt/FFO would increase from 3.4x to 5.1x. On the other hand, if commodity prices are 10% higher than our current assumption, net debt/FFO would decrease to 2.4x.
Exhibit 15: Financial summary
|
C$m |
2017 |
2018 |
2019 |
2020e |
2021e |
||
Year-end 31 December |
IFRS |
IFRS |
IFRS |
IFRS |
IFRS |
|||
PROFIT & LOSS |
|
|
|
|
|
|||
Revenue |
1,024 |
1,526 |
1,747 |
1,094 |
1,222 |
|||
Cost of Sales |
(286) |
(409) |
(513) |
(503) |
(489) |
|||
Gross Profit |
739 |
1,117 |
1,235 |
591 |
733 |
|||
EBITDA |
673 |
1,037 |
976 |
569 |
713 |
|||
Operating Profit (before amort. and except.) |
182 |
427 |
301 |
50 |
243 |
|||
Intangible Amortisation |
0 |
0 |
0 |
0 |
0 |
|||
Exceptionals |
0 |
0 |
(46) |
(1,635) |
0 |
|||
Other |
41 |
46 |
(114) |
35 |
(29) |
|||
Operating Profit |
223 |
474 |
141 |
(1,549) |
214 |
|||
Net Interest |
(57) |
(73) |
(81) |
(78) |
(71) |
|||
Profit Before Tax (norm) |
124 |
355 |
220 |
(28) |
172 |
|||
Profit Before Tax (FRS 3) |
166 |
401 |
60 |
(1,628) |
143 |
|||
Tax |
(62) |
(83) |
(108) |
296 |
(14) |
|||
Profit After Tax (norm) |
104 |
318 |
30 |
335 |
158 |
|||
Profit After Tax (FRS 3) |
104 |
318 |
(48) |
(1,331) |
129 |
|||
|
||||||||
Average Number of Shares Outstanding (m) |
121 |
141 |
154 |
157 |
156 |
|||
EPS - normalised (c) |
86 |
226 |
20 |
214 |
101 |
|||
Dividend per share (C$/share) |
2.6 |
2.7 |
2.8 |
0.6 |
0.0 |
|||
|
||||||||
Gross Margin (%) |
72 |
73 |
71 |
54 |
60 |
|||
EBITDA Margin (%) |
66 |
68 |
56 |
52 |
58 |
|||
Operating Margin (before GW and except.) (%) |
18 |
28 |
17 |
5 |
20 |
|||
|
||||||||
BALANCE SHEET |
||||||||
Fixed Assets |
3,713 |
5,841 |
5,518 |
3,846 |
3,776 |
|||
Intangible Assets |
293 |
303 |
286 |
289 |
293 |
|||
Tangible Assets |
3,338 |
5,317 |
5,016 |
3,090 |
3,016 |
|||
Investments |
82 |
221 |
217 |
467 |
467 |
|||
Current Assets |
262 |
430 |
348 |
475 |
450 |
|||
Stocks |
17 |
28 |
29 |
22 |
22 |
|||
Debtors |
166 |
260 |
211 |
233 |
233 |
|||
Cash |
47 |
27 |
29 |
137 |
113 |
|||
Other |
32 |
115 |
78 |
83 |
83 |
|||
Current Liabilities |
(363) |
(563) |
(416) |
(368) |
(368) |
|||
Creditors |
(258) |
(487) |
(318) |
(333) |
(333) |
|||
Other short-term liabilities |
(105) |
(76) |
(98) |
(35) |
(35) |
|||
Long Term Liabilities |
(2,069) |
(2,890) |
(2,997) |
(2,930) |
(2,670) |
|||
Long term borrowings |
(1,270) |
(1,796) |
(1,925) |
(2,109) |
(1,847) |
|||
Other long-term liabilities |
(798) |
(1,094) |
(1,072) |
(821) |
(824) |
|||
Net Assets |
1,543 |
2,817 |
2,453 |
1,023 |
1,188 |
|||
|
||||||||
CASH FLOW |
||||||||
Operating Cash Flow |
594 |
816 |
823 |
523 |
663 |
|||
Capex |
(320) |
(518) |
(523) |
(360) |
(401) |
|||
Acquisitions/disposals |
(28) |
(276) |
(38) |
(14) |
0 |
|||
Financing |
(4) |
37 |
(83) |
(45) |
(25) |
|||
Dividends |
(200) |
(330) |
(392) |
(118) |
0 |
|||
Net Cash Flow |
41 |
(272) |
(213) |
(14) |
238 |
|||
Opening net debt/(cash) |
1,299 |
1,224 |
1,769 |
1,896 |
1,972 |
|||
HP finance leases initiated |
0 |
0 |
0 |
0 |
0 |
|||
Other |
34 |
(273) |
87 |
(62) |
0 |
|||
Closing net debt/(cash) |
1,224 |
1,769 |
1,896 |
1,972 |
1,734 |
Source: Vermilion Energy accounts, Edison Investment Research. Note: *Impairment charges incurred due to global commodity price forecasts deteriorating and decreases in demand as a result of COVID-19.
Appendix
Canada: Largest contributor to production
Vermilion’s Canadian assets cover resource plays across Alberta and Southeast Saskatchewan and deliver over 60% of the company’s total production. In West Pembina, Alberta, the company is producing Cardium light oil and a condensate-rich natural gas in the Mannville. In Southeast Saskatchewan, Vermilion holds an average WI of 85% across an area of over 500,000 net acres. Development here and in Cardium includes open hole wells and horizontal wells, with multi-stage fractured completions, and the plays all benefit from a significant inventory of undrilled prospects.
In 2020, the company drilled 77 gross wells during Q1 and two gross wells in Q2, of which 64 were drilled in Saskatchewan and 15 in Alberta. This completed the planned drilling activity for the year, and all wells were completed and tied in. Early production performance was strong, with several wells performing ahead of expectations. Following the initial production drop from first flush production, decline rates from the Canadian assets generally settle into low-base decline rates of c 10% pa, although the light oil and tight Mississippian wells in Saskatchewan can have decline rates ranging from 20% to 30%.
US: Continued organic growth
Since entering the US in 2014, Vermilion has continued to consolidate its position in the Turner Sand project area in the Powder River Basin of north-eastern Wyoming. In the US, Vermilion completed and brought on production the remaining six wells of its nine well programme.
|
Exhibit 16: Canada asset location map |
Exhibit 17: US asset location map |
|
|
|
Source: Vermilion Energy |
|
Exhibit 16: Canada asset location map |
|
|
Source: Vermilion Energy |
|
Exhibit 17: US asset location map |
|
|
Source: Vermilion Energy |
France: Production affected by COVID-19
Vermilion is the largest oil producer in France with a c 75% share of the domestic market, and historically the country has delivered the highest production for the company outside Canada, at average 7,046boe/d in Q220. The assets are located across the Paris and Aquitaine Basins and can be characterised as conventional fields with high original oil in place, high working interests and low decline rates. France was affected by the COVID-19 measures put in place by the French government, which included the temporary shutdown of the Total-operated Grandpuits refinery at the end of March. This resulted in the curtailment of c 3,000bopd production for Vermilion and was the largest factor in the 13% decrease (3,700bopd) in production from the company’s European business units in Q220 relative to Q120.
Netherlands: Permitting for Weststellingwerf well
Vermilion is the second largest onshore gas operator in the Netherlands and has assets located in the north-west of the country. It operates all 26 of its onshore licences and holds non-operated interests in 17 offshore licences. The licences cover more than 930,000 net acres of land. Vermilion recently received the final production permit for the Weststellingwerf well, which was flowed during Q120, and expects to bring it into production during H220. In Q220, production decreased 2% from the prior quarter to 7,972boed, primarily due to planned and unplanned downtime.
|
Exhibit 18: France asset location map |
Exhibit 19: Netherlands asset location map |
|
|
|
Source: Vermilion Energy |
|
Exhibit 18: France asset location map |
|
|
Source: Vermilion Energy |
|
Exhibit 19: Netherlands asset location map |
|
|
Source: Vermilion Energy |
Germany: Strategic position in Europe’s largest gas market
Vermilion holds established production operations and substantial exploration acreage in the Lower Saxony region of Northern Germany. Producing assets consist of seven gas and eight oil-producing fields with extensive infrastructure in place. The oil and natural gas assets are all conventional and are all being explored, developed and produced to meet domestic demand. Q220 production decreased 3% from the prior quarter to 3,244boed primarily due to unplanned downtime, which was partially offset by strong performance from well workovers completed in the previous quarter.
Ireland: Corrib gas field operator
Vermilion holds a 20% working interest and is the operator in the Corrib gas field, offshore Ireland. The field commenced production in December 2015 and delivers c 90% of Ireland’s domestic natural gas production. Q220 production decreased 7% from the prior quarter to 6,428boed, primarily due to natural decline and unplanned downtime.
|
Exhibit 20: Germany asset location map |
Exhibit 21: Ireland asset location map |
|
|
|
Source: Vermilion Energy |
|
Exhibit 20: Germany asset location map |
|
|
Source: Vermilion Energy |
|
Exhibit 21: Ireland asset location map |
|
|
Source: Vermilion Energy |
Central and Eastern Europe: Hungarian production
Vermilion has established sizeable early entry positions in Croatia, Hungary and Slovakia covering acreage that is prospective for both oil and gas. The company’s position in Croatia covers almost 2.35m net acres, making it the largest onshore landholder in the country. The Hungarian acreage is over 650,00 acres across three concessions, and in Slovakia Vermilion has partnered with the country’s dominant E&P company NAFTA on a 50/50 basis to explore 490,000 acres over two licences. The company also holds a 50% working interest in two exploration licences in Ukraine, partnering with Ukrainian state-owned gas producer UkrGasVydobuvannya (UGV).
|
Exhibit 22: CEE asset location map |
Exhibit 23: Ukraine asset location map |
|
|
|
Source: Vermilion Energy |
|
Exhibit 22: CEE asset location map |
|
|
Source: Vermilion Energy |
|
Exhibit 23: Ukraine asset location map |
|
|
Source: Vermilion Energy |
Australia: ESPs boost production
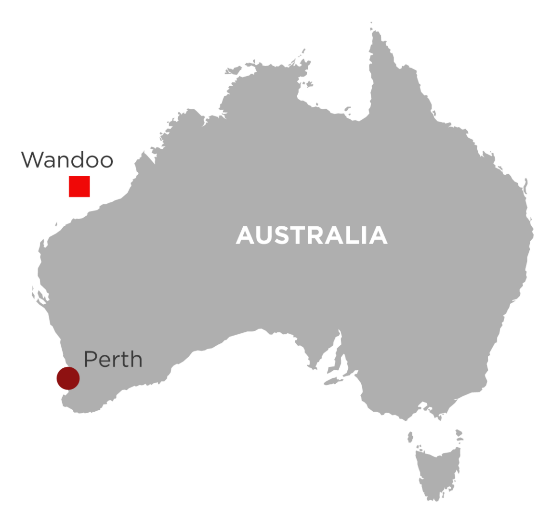
Vermilion holds a 100% interest in the Wandoo field, c 80km offshore the north-west coast of Australia. Current production is from five dual lateral wells, and 10 additional drilling opportunities have been identified targeting undrained oil trapped in the reservoir. Electrical submersible pumps (ESPs) were installed in two of the wells in Q419 and came onstream during Q120, resulting in production of 5,299bbl/d in Q220, an increase of 31% over the prior quarter.
|
Exhibit 24: Australia asset location map |
|
|
Source: Vermilion Energy |
|
|||||||||||||||||||||||||||||||||||||
|
|
Research: Industrials
IBU-tec is continuing its programme to reduce dependence on individual customers and market segments and to improve the profitability of BNT Chemicals, which was acquired in June 2018. It is expanding the group’s presence in markets with long-term growth potential. These include a range of materials used in electric vehicle batteries and organotin compounds used in the synthesis of drugs to treat hypertension and the manufacture of coatings for glass packaging.