Vermilion Energy is an international E&P with assets in Europe, North America and Australia. Its defensive qualities include asset and commodity diversification, low financial leverage, high margins and low finding and development (F&D) costs. Management has distributed a consistent and growing dividend yield to shareholders since 2003, while retaining sufficient capital to grow production by 13% CAGR (five years). The company’s 6.6% forecast dividend yield remains one of the highest in the E&P sector. Our valuation stands at C$48.2/share and is based on a number of approaches including P/CF, EV/EBIDAX, Gordon’s growth model and SOTP based on sustainable FCF and drilling inventory NPV10.
Written by
Vermilion Energy |
Sustainable yield and growth |
Initiation of coverage |
Oil & gas |
12 March 2018 |
Share price performance
Business description
Next events
Analysts
Vermilion Energy is a research client of Edison Investment Research Limited |
|||||||||||||||||||||||||||||||||||||||||||||||
Vermilion Energy is an international E&P with assets in Europe, North America and Australia. Its defensive qualities include asset and commodity diversification, low financial leverage, high margins and low finding and development (F&D) costs. Management has distributed a consistent and growing dividend yield to shareholders since 2003, while retaining sufficient capital to grow production by 13% CAGR (five years). The company’s 6.6% forecast dividend yield remains one of the highest in the E&P sector. Our valuation stands at C$48.2/share and is based on a number of approaches including P/CF, EV/EBIDAX, Gordon’s growth model and SOTP based on sustainable FCF and drilling inventory NPV10.
Year end |
Revenue |
EBITDA* |
Operating cash |
Net (debt)/ |
Capex ex |
Yield |
12/16 |
828.5 |
361.7 |
509.5 |
(1,298.9) |
(242.4) |
6.5 |
12/17 |
1,024.4 |
673.5 |
593.9 |
(1,223.8) |
(320.4) |
6.5 |
12/18e |
1,198.3 |
732.6 |
698.5 |
(1,191.3) |
(327.0) |
6.6 |
12/19e |
1,310.0 |
830.2 |
787.7 |
(1,022.8) |
(356.5) |
6.9 |
Note: *Reported EBITDA includes hedging and FX gains/losses. **Net debt = long-term debt, short-term debt minus cash and equivalents.
FCF to drive growth in production and dividend
We forecast a material increase in free cash flow, post-maintenance capex and dividend payments in FY18/19, based on current commodity prices. We believe this should enable organic investment in the company’s drilling inventory, where well costs average c C$3m and unrisked returns are typically in excess of 50%. In addition, we expect FCF to be used to fund bolt-on acquisitions, dividend growth and debt repayment. Current leverage remains undemanding at FY18e total debt/ EBITDA of 1.5x.
Aligned management and strong governance
Management is highly aligned with shareholder interests, with over 87% of CEO pay in 2016 being variable and paid in shares. Key management objectives include delivery of peer-leading total shareholder return and production per share growth, while maintaining the highest safety, ethical and environmental standards. Vermilion is ranked by the Carbon Disclosure Project (CDP) as within the top 4% of energy companies globally on the basis of emissions disclosure and emissions intensity reduction.
Valuation: Blended valuation of C$48.2/share
We compare Vermilion to an 85-strong international E&P peer group – companies with capitalisations in excess of US$1bn and production ranging from 25kboed to 250kboed. Vermilion stands out on a number of metrics including dividend yield, unit netbacks, and low F&D costs, and trades just above the peer group average on a P/CF of 6.6x 2019e based on Edison forecasts.
Investment summary
Vermilion Energy: Diverse OECD producer
Vermilion has production assets in a range of mature basins and developed economies: Canada, the US, France, the Netherlands, Ireland, Germany and Australia. Management reported production of 68.0kboed in FY17, growing to 75-77.5kboed in FY18 based on company guidance (Edison: 77.8kboed). Based on our commodity price assumptions, this will drive fund flows from operations (FFO) from C$603m FY17 to C$758m in FY18.
Edison valuation: C$48.2/share
We look across a peer group of 85 global listed E&Ps to establish comparable multiples and operational metrics for companies with similar levels of production and market capitalisation. We find that on the basis of 2019e cash flow (Bloomberg consensus) valuations range from 2x P/CF up to 12x depending on the company’s growth profile, development pipeline, contingent resource base and the extent of financial leverage. Given this wide range in peer group cash flow multiples, we have valued Vermilion on the basis of levered and unlevered cash flow metrics, using the Gordon growth dividend discount model and a SOTP valuation basis that incorporates maintenance FCF and the NPV of identified growth projects. Our valuation range extends from a low of C$36.2/share to C$48.2/share, with a midpoint of C$42.2/share. We believe Vermilion should trade towards the top end of this range based on its defensive qualities, high netbacks, low F&D costs and OECD operations with low subsurface risk.
|
Exhibit 1: Average P/CF multiple by exchange for selected peer group |
Exhibit 2: Valuation range |
|
|
|
Source: Edison Investment Research, Bloomberg consensus data. US = US, CN = Canada, IN = India, HK = Hong Kong, RM = Russia, NO = Norway, LN = UK, AU = Australia, JP = Japan, SS = Sweden. |
Source: Edison Investment Research |
|
Exhibit 1: Average P/CF multiple by exchange for selected peer group |
|
|
Source: Edison Investment Research, Bloomberg consensus data. US = US, CN = Canada, IN = India, HK = Hong Kong, RM = Russia, NO = Norway, LN = UK, AU = Australia, JP = Japan, SS = Sweden. |
|
Exhibit 2: Valuation range |
|
|
Source: Edison Investment Research |
Sensitivities: Commodity price and political uncertainty
Key sensitivities to our valuation include commodity price sensitivity. A 10% increase in our commodity price assumptions for FY19 would increase our valuation to C$58.7/share and a 10% decrease would take this down to C$38.3/share. Political risks pertain to changes in fiscal terms, planning and operating regulations, and government perspectives on the hydrocarbon sector.
Diverse, self-funded growth and income model
Operations: Geographic and commodity benchmark diversity
Vermilion is a global E&P with a diverse business model and operations spanning developed economies including Europe, North America and Australia. Commodity price exposure is also diversified, with realisations spread across several global oil and gas benchmarks including Brent, WTI, Henry Hub, TTF and NBP.
Vermilion versus an 85-company global E&P peer group
|
Exhibit 3: Vermilion versus E&P peer group on valuation, growth, leverage and yield metrics |
|
|
Source: Bloomberg, Edison Investment Research |
Group strategy: Sustainable, self-funded growth and income
Vermilion’s self-funded growth and income strategy is underpinned by a focus on economic, environmental and socially sustainable operating practices. Environmental risk plays a key part in Vermilion’s development decision criteria and acts as a differentiating factor among the company’s listed E&P peer group. Low financial and operating leverage enable Vermilion to maintain dividend distributions (6.6% yield forecast for 2018) in the current commodity price environment, while production and free cash flow growth provides the opportunity to accelerate high IRR development investments or increase distributions.
Management: Track record of value creation and SRI focus
Vermilion Energy is led by CEO Anthony Marino, who has a track record of shareholder value creation in the energy sector including CEO at Baytex Energy Corporation and Dominion Exploration. Management has built a sustainable business model, focusing on a high rate of return on conventional and semi-conventional assets. A deep and diverse project inventory is largely onshore and in mature basins, offering capital efficiencies and scalability. Vermilion is recognised for its sustainability leadership, ranking highly in sustainable performance reviews. Vermilion was recognised as a CDP Climate Leadership level (A-) performer in 2017, and is the only Canadian energy company and one of only two in North America to receive this designation, ranking it in the top 4% of energy companies globally. Since 2010, Vermilion has been ranked among the top 35 best workplaces in Canada and France.
Track record of production and reserve growth
Vermilion Energy listed on the Alberta stock exchange in April 1994 at $0.30/share and has since grown organically and inorganically through a series of new country entries. Management chose to focus on three regions that offered relatively stable political, fiscal and regulatory regimes: Europe, North America and Australia.
|
Exhibit 4: Vermilion history of country entries |
|
|
Source: Vermilion Energy |
Vermilion has demonstrated the ability to consistently grow production while replacing produced reserves through-cycle. Momentum has accelerated in recent years, despite the downturn in commodity markets, through new country entries and via acquisition. Management intends to continue to grow production through self-funded selective organic and inorganic investments, which should support further growth in shareholder distributions.
Low financial leverage, capital discipline and cost reductions have enabled Vermilion to sustain dividend payments for over 14 years despite commodity price volatility. Many of its peers have had to resort to recapitalisations and/or reductions in dividend payments as oil prices fell in 2014/15. Vermilion’s monthly dividend has never been reduced and increased four times since 2003 and most recently was increased by 7% to C$0.23/month on 1 March 2018, effective with the April 2018 dividend.
|
Exhibit 5: Long-term production growth |
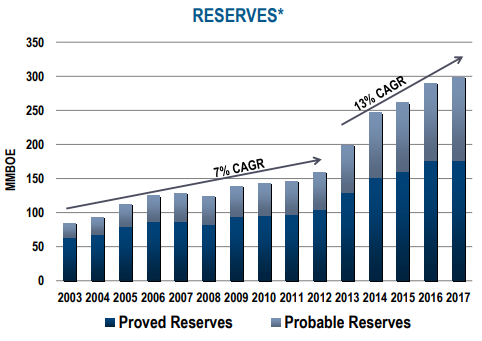
Exhibit 6: Long-term reserve growth |
|
|
|
Source: Vermilion Energy |
|
Exhibit 5: Long-term production growth |
|
|
Source: Vermilion Energy |
|
Exhibit 6: Long-term reserve growth |
|
|
Source: Vermilion Energy |
Ability to sustain growth and distributions going forward
Vermilion’s ability to sustain historic levels of growth in production, reserve/resource additions combined with servicing debt and dividend payouts is reliant on the company generating sufficient levels of cash flow from operations. Below we look at Vermilion’s reported and forecast unit fund flows from operations (FFO) relative to gross dividend payment per boe, and maintenance capex per boe. We assume maintenance capex of C$235m in FY17 and C$9/boe thereafter. Our estimates show a material increase in cash flow available for debt service, investment and/or distribution from 2018 to 2020. This is combined with a relatively undemanding leverage position relative to existing total debt to EBITDA and capitalisation covenants, as shown in Exhibit 8. Leverage has steadily fallen over the last two-years as a commodity price recovery and improved capital efficiency have increased free cash flow generation.
|
Exhibit 7: Excess cash flow after dividend payments and dividend |
Exhibit 8: Debt position versus covenants |
|
|
|
Source: Edison Investment Research |
|
Exhibit 7: Excess cash flow after dividend payments and dividend |
|
|
Source: Edison Investment Research |
|
Exhibit 8: Debt position versus covenants |
|
|
Source: Edison Investment Research |
High netbacks, low decline and low F&D costs
Vermilion offers investors access to a geographically diverse oil and gas production base benefiting from high netbacks, and low base production decline rates with growth underpinned by low finding and development (F&D) costs. F&D costs stand at just over C$10.6/boe, delivering 2P reserves growth of 13% CAGR over the last five years. Capital is being in deployed on short-cycle projects with high returns and short payback, in addition to a generous dividend payout, currently a 6.6% yield forecast for 2018. Expected risked IRRs from development projects are in the 50-100% range at current commodity prices, and are predominantly capital-efficient extensions to existing assets rather than standalone, large-scale projects, thereby reducing execution risk. Vermilion benefits from relatively low production decline rates (Vermilion’s investor presentation points to a corporate composite effective annual decline rate of c10%) across its diverse asset base which reduces the capital required to sustain/grow current production.
Vermilion’s geographic asset diversification adds an element of complexity to the group, but we note that all operations are in OECD countries and predominantly onshore; political, operational and subsurface risk is well spread. Vermilion benefits from realisations based on a number of regional commodity prices including Brent, WTI crude and Henry Hub, TTF, NBP and AECO gas.
The company’s 2P reserve base is dominated by Canada and Western Europe, and continues to grow both through organic and inorganic means. Organic growth is driven by a healthy well inventory across the company’s existing asset base, which continues to move contingent/ prospective resource to reserves and is augmented by bolt-on acquisitions that are complementary to existing operations.
|
Exhibit 9: Net 2P reserves FY17 by geography |
Exhibit 10: Unrisked resources FY17 |
|
|
|
Source: Edison Investment Research, Vermilion Energy |
|
Exhibit 9: Net 2P reserves FY17 by geography |
|
|
Source: Edison Investment Research, Vermilion Energy |
|
Exhibit 10: Unrisked resources FY17 |
|
|
Source: Edison Investment Research, Vermilion Energy |
Our forecast outlook for production is based on visibility from existing assets as well as identified drilling projects. Vermilion expects to drill a total of 53 wells across its inventory in 2018; with well costs averaging just C$3m gross capital demands are low. This is reflected in 2017 F&D costs of C$10.6/boe. Our modelled group production profiles, including growth projects, are shown below split by geography and commodity benchmark.
|
Exhibit 11: Production by commodity benchmark |
Exhibit 12: Production by geography |
|
|
|
Source: Edison Investment Research, Vermilion Energy |
|
Exhibit 11: Production by commodity benchmark |
|
|
Source: Edison Investment Research, Vermilion Energy |
|
Exhibit 12: Production by geography |
|
|
Source: Edison Investment Research, Vermilion Energy |
On a relative basis, Vermilion benefits from netbacks and F&D costs lower than the peer group average which, combined with the company’s distribution yield and strong corporate governance, should provide the basis for a premium valuation, in our view.
|
Exhibit 13: Vermilion cash cost break-even versus peers |
|
|
Source: Bloomberg, Edison Investment Research |
Valuation
We have considered Vermilion’s valuation in the context of the global E&P sector, given the diversification of the company’s asset base. We have selected a peer group of E&Ps that have similar production scale (>25kboed excluding integrated majors) and investment strategies, and have not limited our screens to the North America-listed market. Our peer group includes a total of 85 companies across a total of 10 exchanges with market caps ranging from US$1bn to US$12bn.
Preferred analyst valuation methodologies vary from market to market with the Europe-listed E&P analysts generally willing to include risked value for contingent and prospective resource. North American domestic E&Ps are more commonly valued on the basis of existing production and proved undeveloped reserves, or on the basis of held acreage. As such, the P/CF multiple at which stocks trade across the peer group is wide, with the standout (top end) being high dividend royalty and mineral title companies with low-risk asset portfolios.
|
Exhibit 14: Peer group P/CF 2019e by exchange |
|
|
Source: Edison Investment Research, Bloomberg consensus data. US = US, CN = Canada, IN = India, HK = Hong Kong, RM = Russia, NO = Norway, LN = UK, AU = Australia, JP = Japan, SS = Sweden. |
Average P/CF multiples are more representative when the sample size is meaningful, as for the Canadian, US and Australian exchanges across our peer group. The average 2018e P/CF multiple across the three exchanges ranges from 5.6x (US) to 7.5x (Australia), and falls to 4.2x and 7.0x for 2019e P/CF. We have attempted to value Vermilion using a variety of approaches based on publicly available information on the company’s asset base and its growth potential. We describe each of our valuation approaches in detail in the following sections of this note, and provide a summary of the results of our group valuation below. The average of our proposed valuation range for Vermilion Energy is C$36.2/share to C$48.2/share with a mid-point of C$42.2/share.
|
Exhibit 15: Valuation range |
Exhibit 16: Valuation sensitivity to commodity price FY19e* |
|
|
|
Source: Edison Investment Research. Note: Ke = required rate of return. |
Source: Edison Investment Research. Note: *Base case commodity benchmark prices in Exhibit 17. |
|
Exhibit 15: Valuation range |
|
|
Source: Edison Investment Research. Note: Ke = required rate of return. |
|
Exhibit 16: Valuation sensitivity to commodity price FY19e* |
|
|
Source: Edison Investment Research. Note: *Base case commodity benchmark prices in Exhibit 17. |
Commodity price leverage and valuation
A key sensitivity to our group valuation is the benchmark commodity price for FY19e. Exhibit 17 below indicates this sensitivity by flexing our commodity price inputs for 2019 by ±30%. Our valuation varies from C$20.8/share to C$81.2/share over this range, with the market implied discount to our commodity price deck for 2019 at c -5%.
Exhibit 17: Midpoint valuation sensitivity to commodity price input for FY19 (base case in bold)
Brent/(US$/bbl) |
43.0 |
49.1 |
55.3 |
61.4 |
67.6 |
73.7 |
79.9 |
WTI/(US$/bbl) |
40.2 |
45.9 |
51.7 |
57.4 |
63.2 |
68.9 |
74.7 |
NBP (C$/mmbtu) |
4.9 |
5.6 |
6.3 |
7.0 |
7.7 |
8.4 |
9.1 |
AECO (C$/GJ) |
1.6 |
1.8 |
2.1 |
2.3 |
2.5 |
2.8 |
3.0 |
TTF (C$/GJ) |
4.9 |
5.6 |
6.3 |
7 |
7.7 |
8.4 |
9.1 |
-30% |
-20% |
-10% |
0% |
10% |
20% |
30% |
|
C$/share |
20.8 |
29.2 |
38.3 |
48.2 |
58.7 |
69.6 |
81.2 |
Source: Edison Investment Research
P/CF and EV/EBIDAX-based valuation
We value Vermilion on the basis of 6-8x 2019e P/CF, in line with the range of valuations seen across the listed E&Ps in the US, Canada and Australia, which make up the bulk of our selected 85-company peer group. We use a debt-adjusted cash flow multiple range of 7-9x 2019e EBIDAX (earnings before interest, depreciation, amortisation and exploration expense).
|
Exhibit 18: Consensus average P/CF 2019e multiple by exchange for selected peer group |
Exhibit 19: Consensus average P/CF multiples for FY18e and FY19e |
|
|
|
Source: Edison Investment Research, Bloomberg consensus |
|
Exhibit 18: Consensus average P/CF 2019e multiple by exchange for selected peer group |
|
|
Source: Edison Investment Research, Bloomberg consensus |
|
Exhibit 19: Consensus average P/CF multiples for FY18e and FY19e |
|
|
Source: Edison Investment Research, Bloomberg consensus |
Given our projected growth profile for Vermilion, we see potential for share price appreciation if the stock remains in its current multiple trading range (see Exhibits 20 & 21 below).
|
Exhibit 20: P/CF trading range (6-8x) |
Exhibit 21: EV/EBIDAX trading range (7-9x) |
|
|
|
Source: Edison Investment Research |
|
Exhibit 20: P/CF trading range (6-8x) |
|
|
Source: Edison Investment Research |
|
Exhibit 21: EV/EBIDAX trading range (7-9x) |
|
|
Source: Edison Investment Research |
Dividend discount model
Given Vermilion’s focus on income, we have included a basic Gordon’s growth model to value the company. Key inputs include the one-year forward expected annual dividend per share, the required rate of investment return (Ke) and expected dividend growth (g). We provide a valuation sensitivity to the key inputs to this model below. Despite cash flow volatility inherent in any business operating in the oil and gas sector, management has demonstrated the sustainability of current payout in a low commodity price environment. We note a wide range in implied valuation using this methodology.
Based on this model, the current share price implied growth rate at an 8% required return is c 1.5%.
Exhibit 22: DDM valuation C$/share required return (Ke) and growth (g) sensitivity
Ke/g |
6% |
8% |
10% |
12% |
-2% |
33.9 |
27.2 |
22.6 |
19.4 |
-1% |
38.8 |
30.2 |
24.7 |
20.9 |
0% |
45.3 |
33.9 |
27.2 |
22.6 |
1% |
54.3 |
38.8 |
30.2 |
24.7 |
2% |
67.9 |
45.3 |
33.9 |
27.2 |
3% |
90.5 |
54.3 |
38.8 |
30.2 |
Source: Edison Investment Research
Sustainable FCF and growth
We also examine Vermilion using a sustainable FCF and growth approach, which values it on the basis of estimated FY19 sustainable FCF (CFO minus maintenance capex) multiplied by reserve life. This essentially values the company on the basis of sustaining current production at current realisations and maintenance capex costs (current maintenance FCF) for a period equal to the company’s reserve life (2P reserves divided by production). This approach does not include a terminal value or incremental value for contingent/prospective resource despite Vermilion’s deep drilling inventory. In order to include value beyond current 2P reserves, we add the NPV10 of 2018 committed drilling projects and a continuation of this drilling programme out to 2022. A breakdown of this NPV10 is provided in Exhibit 24 below and equates to a total of C$976m for the five-year period. We note that this valuation is discounted for time value but unrisked as the bulk of this development upside carries minimal geological or execution risk and is largely onshore in-fill drilling at existing assets.
|
Exhibit 23: Sustaining FCF* and reserve life |
Exhibit 24: Five-year NPV10 of drilling inventory – assumed 2018 programme continuation to 2022 |
|
|
|
Source: Edison Investment Research. Note: *EBIDAX minus sustaining capex. |
Source: Edison Investment Research |
|
Exhibit 23: Sustaining FCF* and reserve life |
|
|
Source: Edison Investment Research. Note: *EBIDAX minus sustaining capex. |
|
Exhibit 24: Five-year NPV10 of drilling inventory – assumed 2018 programme continuation to 2022 |
|
|
Source: Edison Investment Research |
A summary of Vermilion’s development drilling inventory is provided below, including well costs, typical post-tax rates of return and 2018 committed capex. The NPV10 per location is calculated by Vermilion based on a price deck of US$60/bbl Brent and US$3/mcf Henry Hub.
Exhibit 25: Vermilion 2018 committed projects and development inventory
Potential investments |
Well cost |
IP365 |
EUR |
ATAX |
Recycle |
ATAX payout |
Net well |
2018e wells planned |
2018e capex |
NPV10 C$m per location* |
NPV10 C$m for |
(C$m) |
(boed) |
(mboe) |
(ROR) |
(ratio) |
(years) |
inventory |
(C$m) |
|
|
||
European Gas |
|||||||||||
Netherlands E&D |
9.2 |
1260 |
1350 |
>100% |
6.0 |
1.1 |
81 |
1.5 |
13.8 |
15.4 |
115.5 |
Germany development |
4.0 |
280 |
780 |
36% |
2.4 |
3.0 |
30 |
0 |
0 |
4.9 |
0 |
Brent Crude |
|||||||||||
Champotran Dev (France) |
4.4 |
205 |
325 |
64% |
2.7 |
1.7 |
38 |
3.0 |
13.2 |
6.7 |
100.5 |
Neocomian Dev (France) |
2.7 |
112 |
150 |
60% |
2.1 |
1.8 |
30 |
4.0 |
10.8 |
2.4 |
48.0 |
Australia Dev |
25.6 |
1800 |
1000 |
82% |
3.7 |
0.8 |
12 |
0 |
0.0 |
14.3 |
0.0 |
North American light crude |
|||||||||||
SE Saskatchewan Dev |
1.7 |
115 |
135 |
>100% |
3.4 |
1.0 |
211 |
20.5 |
34.9 |
2.0 |
205.0 |
Cardium Dev |
3.2 |
157 |
195 |
47% |
3.0 |
1.6 |
250 |
4.2 |
13.4 |
2.3 |
48.3 |
Turner Sand Dev |
4.1 |
260 |
415 |
64% |
4.1 |
1.4 |
148 |
5.0 |
20.5 |
4.7 |
117.5 |
Canadian condensate rich gas |
|||||||||||
Lower Mannville/Ellerslie Dev |
3.4 |
450 |
685 |
>100% |
4.8 |
1.1 |
135 |
10.6 |
36.0 |
5.6 |
296.8 |
Canadian liquids rich gas |
|||||||||||
Upper Mannville Dev |
3.7 |
660 |
810 |
46% |
2.5 |
1.9 |
164 |
3.2 |
11.8 |
2.8 |
44.8 |
Total |
|
|
|
|
|
|
|
|
154.5 |
|
976.4 |
Source: Vermilion Energy, Edison Investment Research. Note: *Last published company estimates and price deck.
NAV valuation: Large uncertainty range
NAV valuation is often considered the most appropriate valuation methodology for small/mid-cap E&Ps, especially in the case of Vermilion’s global exploration or development-biased E&P peers. This approach captures value for existing 2P reserves, as well as risked contingent and prospective resource. While we employ a detailed NAV approach for our small-cap E&P coverage, we feel it is less relevant for Vermilion given the company’s bias towards producing, developed assets. Also, the ability to estimate NAV accurately is limited by lack of company disclosure of committed capex projects, over and above maintenance capex, beyond 2018.
Global E&P: Relative valuation
Below we look at how Vermilion stacks up relative to our peer group of 85 global E&Ps. Exhibit 26 below shows where Vermilion stands relative to the peer group mean and distribution on the basis of a number of valuation and operational metrics.
■
Current EV/debt-adjusted cash flow (DACF): Vermilion trades broadly in line with the peer group on this basis at 10.2x vs a mean 9.7x, and is ranked in the 74th percentile.
■
Gross dividend yield: Vermilion offers one of the highest yields in the sector at 6.6% and is ranked in the 97th percentile on this metric.
■
Netback 2017 $/boe: Vermilion’s reported netback US$/boe is above the peer group average at US$22.7/boe (Bloomberg) and is ranked in the 56th percentile.
■
P/CF 2019e: Valuation based on our 2019 cash flow forecasts is at 6.9x versus a peer group mean of 4.6x and is ranked in the 84th percentile.
■
Production growth 2018e relative to 2017e: Production growth at 12.4% (Bloomberg consensus) is less than the peer group mean, which is elevated by several companies experiencing a short-term step change in growth, for example in the US onshore unconventional sector. It ranks in the 47th percentile with growth close to the median of 14.1%.
■
EV/1P: Vermilion trades above the peer group average on this metric at US$27.8/boe and is in the 83rd percentile.
■
Current Net debt/EBITDA: Balance sheet leverage is low and net debt/EBITDA at 1.5x (current) is a significant step away from a 4x covenant (total debt to adjusted EBITDA). The peer group mean is 1.4x and Vermilion sits in the 56th percentile.
|
Exhibit 26: Vermilion versus E&P peer group on valuation, growth, leverage and yield metrics |
|
|
Source: Bloomberg, Edison Investment Research . Priced at 5 March 2018 |
In this section we look at key correlations among operational and valuation metrics across our 85-strong E&P peer group. We display some of the strongest correlations below, including Vermilion’s position versus the peer group.
|
Exhibit 27: Netback US$/boe vs EV/1P US$/boe |
Exhibit 28: P/CF 2019e versus leverage (current net debt/EBITDA) |
|
|
|
Source: Bloomberg, Edison Investment Research |
|
Exhibit 27: Netback US$/boe vs EV/1P US$/boe |
|
|
Source: Bloomberg, Edison Investment Research |
|
Exhibit 28: P/CF 2019e versus leverage (current net debt/EBITDA) |
|
|
Source: Bloomberg, Edison Investment Research |
Operational highlights
Vermilion operates in three core areas: North America, Europe and Australia. Reserves and production by geography are discussed earlier in this note. Operational performance in 2017 was strong across the asset base with the exception of an extended period of downtime at the partner-operated Corrib asset in Ireland. Corrib remains under operatorship of Royal Dutch Shell, with transfer of title to Vermilion expected during H118. We briefly discuss the key components of Vermilion’s asset base below; however, we deemed a detailed subsurface and technical review of each asset to be beyond the scope of this report.
Canada: Largest component of production with high post-tax netbacks
Vermilion holds an expansive onshore position encompassing three resource plays that share surface infrastructure: Cardium light oil; Mannville condensate-rich gas; and Duvernay condensate-rich gas. Cash flows are expected to be sheltered from tax for the coming 10 years with tax pools in excess of C$1.5bn, which drove a FFO netback of C$17.7/boe for FY17. The Cardium light oil play is developed using horizontal wells with multi-stage completions with fluids exported to an operated 15kbod oil facility and two gas plants. Vermilion holds a significant inventory of undrilled prospects and a 90,000 net acre position.
The Mannville condensate-rich gas development is a multi-zone development across 215,000 net acres that are largely held by production. Only a small portion of the company’s Mannville inventory has been drilled, providing for significant growth potential.
The Duvernay liquids-rich gas play is currently in the appraisal phase and the company’s 82,000 net acres underlie existing development rights, providing an option for future development.
As of 15 January 2018, Vermilion has added an additional 6.7mmboe of crude oil to its 2P reserve base and c 1kbod of light oil production through the acquisition of a private producer in south-east Saskatchewan for a total cash consideration of C$90.8m. The acquisition complements the company’s existing Saskatchewan operations, which are located 55km to the south-west. The assets have low base decline rates at c 15% pa and less than 10% when under waterflood.
|
Exhibit 29: Canada asset overview |
Exhibit 30: Canada FFO netback and capex C$/boe |
|
|
|
Source: Vermilion Energy |
Source: Vermilion Energy, Edison Investment Research |
|
Exhibit 29: Canada asset overview |
|
|
Source: Vermilion Energy |
|
Exhibit 30: Canada FFO netback and capex C$/boe |
|
|
Source: Vermilion Energy, Edison Investment Research |
US: Step change in production through organic growth
Vermilion entered the US in 2014 through acquisition and has since consolidated its position in the Turner Sand play in the Powder River Basin of north-eastern Wyoming. Production is expected to double in FY18 as the company drills light oil targets in the Turner Sand play.
|
Exhibit 31: US asset overview |
Exhibit 32: US FFO netback and capex C$/boe |
|
|
|
Source: Vermilion Energy |
Source: Vermilion Energy, Edison Investment Research |
|
Exhibit 31: US asset overview |
|
|
Source: Vermilion Energy |
|
Exhibit 32: US FFO netback and capex C$/boe |
|
|
Source: Vermilion Energy, Edison Investment Research |
France: Largest oil producer with 75% share of domestic market
Vermilion’s oil assets are located in the Aquitaine and Paris Basins; assets are conventional with large original oil in place (OOIP) at more than 1.7bnbbls with a low base decline rate. Vermilion has an inventory of low-risk infill drilling, workover and optimisation opportunities, and benefits from a 100% appraisal success rate in the 18 wells that have been drilled in the Champotran field since 2013.
|
Exhibit 33: France asset overview |
Exhibit 34: France FFO netback and capex C$/boe |
|
|
|
Source: Vermilion Energy |
Source: Vermilion Energy, Edison Investment Research |
|
Exhibit 33: France asset overview |
|
|
Source: Vermilion Energy |
|
Exhibit 34: France FFO netback and capex C$/boe |
|
|
Source: Vermilion Energy, Edison Investment Research |
Netherlands: Second largest onshore natural gas producer in country
Vermilion’s gas-producing assets are in the north-west part of the country with the company holding c 800,000 net acres. It has drilled 14 extension and discovery wells since 2009 with an average success rate of 67%. Wells are low cost (c $8.5m) and typically produce 10-20mmscfd, and with favourable European natural gas prices generate high returns (at strip per well, returns exceed 100% IRR).
|
Exhibit 35: Netherlands asset overview |
Exhibit 36: Netherlands FFO netback & capex C$/boe |
|
|
|
Source: Vermilion Energy |
Source: Vermilion Energy, Edison Investment Research |
|
Exhibit 35: Netherlands asset overview |
|
|
Source: Vermilion Energy |
|
Exhibit 36: Netherlands FFO netback & capex C$/boe |
|
|
Source: Vermilion Energy, Edison Investment Research |
Germany: Strategic position in Europe’s largest gas market
Vermilion’s operations are located in Lower Saxony and are focused on the exploration, development and production of conventional oil and natural gas to meet domestic demand. Vermilion entered the country in 2014 through the acquisition of non-operated interests in 2.5kboed and followed up with several transactions including farming-in with ExxonMobil and Shell on 850,000 net undeveloped acres. In June 2016, Vermilion acquired the interests in nine oil and four natural gas fields from ENGIE E&P (formerly GDF Suez), thereby becoming an operator in Germany. In aggregate, Vermilion has established a land position of approximately 1.1million net acres (97% undeveloped) representing one-quarter of the total licensed land in the North German Basin.
|
Exhibit 37: Germany asset overview |
Exhibit 38: Germany FFO netback and capex C$/boe |
|
|
|
Source: Vermilion Energy |
Source: Vermilion Energy, Edison Investment Research |
|
Exhibit 37: Germany asset overview |
|
|
Source: Vermilion Energy |
|
Exhibit 38: Germany FFO netback and capex C$/boe |
|
|
Source: Vermilion Energy, Edison Investment Research |
Ireland: 20% interest in the Corrib gas field
The Corrib gas field, offshore Ireland, commenced production in December 2015.Volumes reached peak supply of 350mmscfd by the end of June 2016, supplying 60-65% of Ireland’s natural gas needs and accounting for 95% of domestic production. In July 2017, Vermilion signed a strategic partnership with the Canada Pension Plan Investment Board (CPPIB) leading to a net increase in its Corrib interest from 18.5% to 20% and transfer of operatorship from Shell to Vermilion. On closure of the deal, expected in H118, CPPIB will hold 43.5% interest in the project, and Statoil 36.5%.
Corrib production fell quarter-on-quarter in Q317 (-23%) due to extended downtime following a plant turnaround resulting from unodorised gas detected in the distribution network. Production was resumed on 11 October, but resulted in a net annualised impact of 900boed to Vermilion.
|
Exhibit 39: Ireland asset overview |
Exhibit 40: Ireland FFO netback and capex C$/boe |
|
|
|
Source: Vermilion Energy |
Source: Vermilion Energy, Edison Investment Research |
|
Exhibit 39: Ireland asset overview |
|
|
Source: Vermilion Energy |
|
Exhibit 40: Ireland FFO netback and capex C$/boe |
|
|
Source: Vermilion Energy, Edison Investment Research |
Other Europe: European growth strategy
Vermilion has established a footprint in Croatia, Hungary and Slovakia. At this stage the company has modest commitments focusing on early-stage exploration. The company’s Croatia position covers some 2.35m net acres making it the largest onshore landholder in the country, and in Hungary its position extends to 320,000 acres. In Slovakia, the company has partnered with NAFTA, the country’s dominant E&P, in a farm-in arrangement that grants Vermilion a 50% working interest in a joint 183,000 acres. Vermilion drilled and tested its first exploration well in the Hungary, South Battonya concession in early 2018 with a natural gas test rate of 5.8mmcfd which is expected to be brought into production in mid-2018.
Australia: High-return oil infill drilling
Vermilion has a 100% interest in the Wandoo field 80km off the north-west shelf. Production is maintained a c 6kbod through in-fill drilling (long reach laterals). Despite wells costing c C$25-26m to drill, each well can add up to 1.8kboed to production once put onstream, generating IRRs close to 100% in a $60/bbl Brent crude price environment. The company is planning its next drilling campaign in 2019 which is expected to restore production to 6,000kbod.
|
Exhibit 41: Australia asset overview |
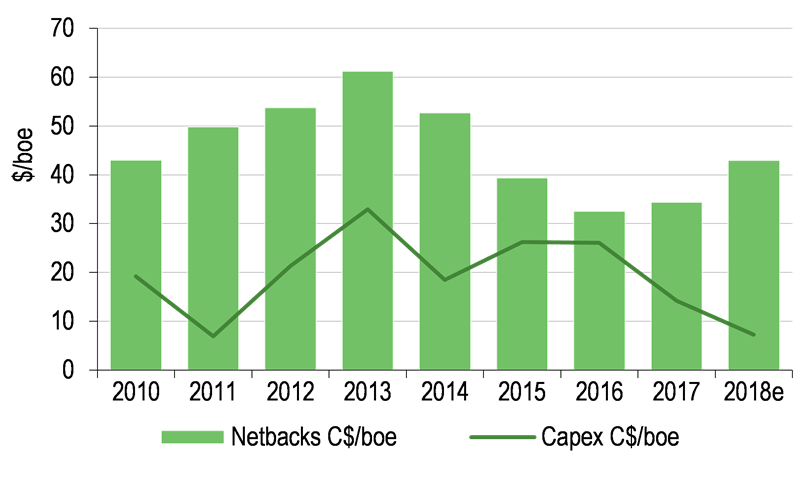
Exhibit 42: Australia FFO netback and capex C$/boe |
|
|
|
Source: Vermilion Energy |
Source: Vermilion Energy, Edison Investment Research |
|
Exhibit 41: Australia asset overview |
|
|
Source: Vermilion Energy |
|
Exhibit 42: Australia FFO netback and capex C$/boe |
|
|
Source: Vermilion Energy, Edison Investment Research |

Management
Lorenzo Donadeo – chairman: Mr Donadeo has more than 35 years’ experience in the oil and gas business, including mergers and acquisitions, gas marketing, production, exploitation, and field operations in western Canada and internationally in Australia, France, the Netherlands, Germany, Ireland, Trinidad and Tobago. He was a co-founder of Vermilion Resources (1994), now Vermilion Energy and currently serves as chairman of the board. In 2015, Mr Donadeo was recognized for his outstanding service to France with official appointment to the National Order of the Legion of Honour at the rank of Chevalier.
Anthony Marino – president and CEO: Mr Marino is an accomplished senior executive with a proven track record of high shareholder returns during his 35+ year career in the energy industry. He joined Vermilion in June 2012 as chief operating officer and was appointed president in March 2014. He became Vermilion’s CEO in March 2016. Prior to joining Vermilion, Mr Marino held the position of president and CEO of Baytex Energy Corporation, after initially serving as Baytex's COO. Previously, he held the role of president and CEO of Dominion Exploration Canada, a division of Dominion Resources. Earlier in his career, Mr Marino held a variety of technical and management positions with AEC Oil and Gas (USA) Inc, Santa Fe Snyder Corp and Atlantic Richfield Company. He brings a wide range of experience in operations management, business development and capital markets to his role as CEO of Vermilion.
Curtis Hicks – executive vice president and CFO: Mr Hicks has over 33 years of industry experience, primarily in the financial area of oil and gas operations, as well as property and corporate acquisitions. He joined Vermilion in 2003 as VP, finance and CFO. In 2004 he was named executive VP and CFO and is accountable for finance, accounting, treasury, tax and IT. From 2000 to 2003 Mr Hicks was VP, finance and CFO with NAL Oil & Gas Trust, and prior to this he was CEO of Caravan Oil & Gas from 1998 to 2000. He began his career with Elan Energy in 1983, serving as VP, finance and CFO as ELAN grew from 200bbls/d to over 35,000bbls/d.
Curtis Hicks is retiring effective April 2018 and will be succeeded by Lars Glemser, currently director of finance. Mr Glemser joined Vermilion in 2015 as operations controller, and progressed through a developmental assignment in investor relations before becoming Vermilion’s director of finance. Prior to joining Vermilion, he had management experience in audit, financial reporting, treasury and corporate planning. Mr. Glemser is a member of the Chartered Professional Accountants of Alberta.
Risks and sensitivities
Key company-specific risks and sensitivities include:
■
Political risks: Vermilion is exposed to fiscal and political changes in countries of operation. We see the greatest risk to operations in Europe, where the French Parliament recently approved a law banning all new exploration and production of oil and gas from 2040. This is in addition to a ban on fracking, which came into place in 2011.
■
Dividend risks: Cash dividends are paid at the discretion of the Vermilion board of directors and can fluctuate. Dividend payments will depend on the outlook for commodity prices, operational performance, fund flows from operations and anticipated capex spend. As such, we expect gross cash dividends to be maintained, with potential to be increased over our forecast period.
Key sector-specific sensitivities include:
■
Commodity price sensitivity: We provide valuation sensitivity (Exhibit 17 to key benchmark prices in the valuation section of this note. As with most companies in the E&P sector, valuation is highly sensitive to the underlying commodity price.
■
Subsurface risk: Estimates of 1P and 2P reserves are underpinned by assets that are already in production, hence uncertainty of the reserve range is likely to be well defined. As with all companies in the sector, reserves and resources are defined by distributions and the amount of oil and gas recovered can differ from published point values.
■
Funding risks: Vermilion is relatively unlevered and cash generative and, based on current capex plans, we do not see funding as a risk. We forecast Vermilion to be significantly cash generative over the forecast period, with minimal risk to debt coverage, capex spend or dividend payout.
Financials
Edison versus consensus
Looking at Edison forecasts vs current consensus, our forecasts are higher than consensus for 2019 revenues and CFPS (cash flow per share), as we include the positive impact of Vermilion’s recent US production acquisition and assume continued drilling activity across the company’s asset portfolio in line with its announced 2018 capex programme. It is unclear how much incremental activity consensus includes over and above maintenance capex in future forecasts.
Our forecasts are below consensus EBITDA for 2018e, although we do not include commodity mark to market or FX gains in our forecast for 2018, which could explain this difference.
Exhibit 43: Edison forecast versus Bloomberg consensus
|
Edison |
Consensus |
Delta |
|||
|
2018e |
2019e |
2018e |
2019e |
2018e |
2019e |
Production |
77.8 |
81.0 |
76.5 |
79.6 |
2% |
2% |
Revenues |
1198 |
1310 |
1214 |
1290 |
-1% |
2% |
Adj EBITDA* |
761 |
858 |
816 |
864 |
-7% |
-1% |
EBIDAX |
691 |
774 |
N/A |
N/A |
|
|
FFO |
759 |
845 |
N/A |
N/A |
|
|
CFPS |
5.6 |
6.3 |
5.6 |
5.9 |
1% |
6% |
Capex ex acquisitions |
327 |
357 |
324 |
391 |
1% |
-9% |
Source: Edison Investment Research, Bloomberg *Adjusted for non-cash items
|
Exhibit 44: Revenue and EBIDAX forecasts |
Exhibit 45: CFPS and DPS forecasts |
|
|
|
Source: Edison Investment Research, Vermilion Energy |
|
Exhibit 44: Revenue and EBIDAX forecasts |
|
|
Source: Edison Investment Research, Vermilion Energy |
|
Exhibit 45: CFPS and DPS forecasts |
|
|
Source: Edison Investment Research, Vermilion Energy |
Exhibit 46: Financial summary
|
|
C$m |
2015 |
2016 |
2017 |
2018e |
2019e |
2020e |
Dec |
|
|
IFRS |
IFRS |
IFRS |
IFRS |
IFRS |
IFRS |
PROFIT & LOSS |
|
|
|
|
|
|
|
|
Revenue |
|
|
|
829 |
1,024 |
1,198 |
1,310 |
1,450 |
Cost of Sales |
|
|
(262) |
(286) |
(321) |
(335) |
(344) |
|
Gross Profit |
|
|
567 |
739 |
878 |
975 |
1,106 |
|
EBITDA |
|
|
|
362 |
673 |
733 |
830 |
961 |
Operating Profit (before amort. and except.) |
|
(166) |
182 |
117 |
200 |
316 |
||
Intangible Amortisation |
|
0 |
0 |
0 |
0 |
0 |
||
Exceptionals |
|
|
0 |
0 |
0 |
0 |
0 |
|
Other |
|
|
|
0 |
0 |
0 |
0 |
0 |
Operating Profit |
|
|
(166) |
182 |
117 |
200 |
316 |
|
Net Interest |
|
|
|
(57) |
(57) |
(55) |
(52) |
(41) |
Profit Before Tax (norm) |
|
(223) |
124 |
62 |
148 |
275 |
||
Profit Before Tax (FRS 3) |
|
(223) |
124 |
62 |
148 |
275 |
||
Tax |
|
|
|
63 |
(62) |
(69) |
(85) |
(98) |
Profit After Tax (norm) |
|
|
(243) |
104 |
(7) |
64 |
176 |
|
Profit After Tax (FRS 3) |
|
|
(160) |
62 |
(7) |
64 |
176 |
|
Average Number of Shares Outstanding (m) |
|
116 |
121 |
123 |
125 |
127 |
||
EPS - normalised (C$/share) |
|
(2.1) |
0.9 |
(0.1) |
0.5 |
1.4 |
||
Dividend per share (C$/share) |
|
2.6 |
2.6 |
2.7 |
2.8 |
2.8 |
||
Gross Margin (%) |
|
|
68 |
72 |
73 |
74 |
76 |
|
EBITDA Margin (%) |
|
|
44 |
66 |
61 |
63 |
66 |
|
Operating Margin (before GW and except.) (%) |
|
(20) |
18 |
10 |
15 |
22 |
||
BALANCE SHEET |
|
|
|
|
|
|
|
|
Fixed Assets |
|
|
3,861 |
3,713 |
3,516 |
3,242 |
2,924 |
|
Intangible Assets |
|
|
275 |
293 |
293 |
318 |
318 |
|
Tangible Assets |
|
|
3,433 |
3,338 |
3,140 |
2,841 |
2,522 |
|
Investments |
|
|
153 |
82 |
83 |
83 |
83 |
|
Current Assets |
|
|
226 |
262 |
259 |
321 |
354 |
|
Stocks |
|
|
|
15 |
17 |
17 |
17 |
17 |
Debtors |
|
|
|
132 |
166 |
166 |
166 |
166 |
Cash |
|
|
|
63 |
47 |
44 |
106 |
139 |
Other |
|
|
|
17 |
32 |
32 |
32 |
32 |
Current Liabilities |
|
|
(291) |
(363) |
(363) |
(363) |
(363) |
|
Creditors |
|
|
|
(218) |
(258) |
(258) |
(258) |
(258) |
Other short term liabilities |
|
(73) |
(105) |
(105) |
(105) |
(105) |
||
Long Term Liabilities |
|
|
(2,218) |
(2,069) |
(2,058) |
(1,978) |
(1,717) |
|
Long term borrowings |
|
|
(1,362) |
(1,270) |
(1,235) |
(1,128) |
(837) |
|
Other long term liabilities |
|
(856) |
(798) |
(822) |
(849) |
(879) |
||
Net Assets |
|
|
|
1,578 |
1,543 |
1,354 |
1,222 |
1,198 |
CASH FLOW |
|
|
|
|
|
|
|
|
Operating Cash Flow |
|
|
510 |
594 |
699 |
788 |
918 |
|
Capex |
|
|
|
(242) |
(320) |
(327) |
(357) |
(327) |
Acquisitions/disposals |
|
(99) |
(28) |
(91) |
0 |
0 |
||
Financing |
|
|
|
(17) |
(4) |
(5) |
(5) |
(5) |
Dividends |
|
|
|
(105) |
(200) |
(243) |
(258) |
(262) |
Net Cash Flow |
|
|
47 |
41 |
32 |
168 |
324 |
|
Opening net debt/(cash) |
|
1,346 |
1,299 |
1,224 |
1,191 |
1,023 |
||
HP finance leases initiated |
|
0 |
0 |
0 |
0 |
0 |
||
Other |
|
|
|
0 |
34 |
0 |
0 |
0 |
Closing net debt/(cash) |
|
|
1,299 |
1,224 |
1,191 |
1,023 |
699 |
|
Source: Vermilion Energy, Edison Investment Research. Note: Edison calculates net debt as long-term debt, plus short-term debt minus cash and cash equivalents.
|
|||||||||||||||||||||||||||||||||||||||||||
|
|
Research: Real Estate
The Russian economy returned to growth in 2017 and the FX market was relatively calm, creating the conditions for a significant improvement in the warehouse market supply-demand balance, with rents stabilising. Against this backdrop, Raven produced strong headline earnings, including land sale gains, and a solid underlying performance, including a first benefit from 2017 accretive acquisitions. Although not reflected in our forecast, further acquisitions are likely, funded by existing cash resources, with the potential to more than offset rent reversion to market levels and return the company to growth.