Last close As at 05/08/2026
—
— 0.00 (0.00%)
Market capitalisation
—
Research: Industrials
Following a visit to paragon’s expanded Delbrück facility and the successful €50m bond issue, we have revisited and upwardly revised our medium-term growth and margin outlook for the group. With 2016 results having met forecasts despite some timing headwinds and future years underpinned by substantial contract wins across the electromobility division, we believe paragon is on the cusp of further accelerated growth. With proceeds from both the October 2016 capital increase and June 2017 bond issue being invested to support this accelerated growth, we raise our fair value to €82.1/share based on our updated DCF scenarios.
Written by
paragon |
Automation to drive enhanced returns |
Site visit, bond issue |
Automotive electronics |
16 August 2017 |
Share price performance
Business description
Next events
Analyst
paragon is a research client of Edison Investment Research Limited |
|||||||||||||||||||||||||||||||||||||||||||||
Following a visit to paragon’s expanded Delbrück facility and the successful €50m bond issue, we have revisited and upwardly revised our medium-term growth and margin outlook for the group. With 2016 results having met forecasts despite some timing headwinds and future years underpinned by substantial contract wins across the electromobility division, we believe paragon is on the cusp of further accelerated growth. With proceeds from both the October 2016 capital increase and June 2017 bond issue being invested to support this accelerated growth, we raise our fair value to €82.1/share based on our updated DCF scenarios.
Year end |
Revenue (€m) |
PBT* |
EPS* |
DPS |
P/E |
Yield |
12/16 |
102.8 |
5.8 |
0.84 |
0.00 |
77.1 |
N/A |
12/17e |
123.8 |
7.8 |
1.16 |
0.00 |
55.8 |
N/A |
12/18e |
155.7 |
13.1 |
1.95 |
0.00 |
33.2 |
N/A |
12/19e |
205.0 |
20.1 |
2.99 |
0.00 |
21.7 |
N/A |
Note: *PBT and EPS are normalised, excluding amortisation of acquired intangibles, exceptional items and share-based payments.
Markets developing – electromobility deals aplenty
paragon has continued to develop its electromobility exposure through a series of agreements with customers in several end-markets. This approach of partnering with leading players in each subsector, where demand already exists and substitution is taking place, is significant as it de-risks adoption and provides ready-made markets for paragon’s technology. In parallel to the rapid growth in electromobility, the group continues to expand the core automotive markets where it remains a leader based upon innovation in support of global mega trends.
Automation key to value creation in intralogistics
As paragon’s results have shown, with top-line growth of 8% in 2016 continuing at 13% in H117, demand for its products is not in question. The key for value creation in our view is the ability to drive efficiency and enhanced margins across the whole group. On a recent site visit to Delbrück, we saw both the expanded footprint of the facility and the newly installed automated production line for intralogistics which, once fully operational, is forecast by management to improve throughput over 3x greater than the manual process while utilising a third of employees, helping to drive our forecast 300bps mid-term improvement in margins as the significant volume ramp up occurs.
Valuation: Uplift resulting from improved outlook
Following full year results, continued strength in H117 and our site visit, we have reassessed the medium-term outlook potential for the group and lifted our mid- to long-term forecasts. As a result, our DCF-based fair value has increased to €82.1/share (€40.1/share in October 2016) to reflect our increased confidence in paragon’s ability to turn significant top-line growth into bottom-line profit. An indication of the benefit of the automated line showing through in results is likely to act as a catalyst to another re-rating.
Investment summary
Company description: Transitioning to high growth
paragon was founded in1988, originally as an industrial electronics subcontract manufacturer, but subsequently concentrating on the automotive market. Its strategy is to develop products and systems ahead of OEM demand to capture market-leading positions in niche applications. This has been consistently demonstrated and the group is currently commencing a significant growth phase based on: 1) a strong underlying automotive core with increasing systems content and revenue per vehicle, worth several times product sales, offsetting potential cyclicality; and 2) new market segments such as electromobility and body kinematics.
Valuation: Uplift derived from benefits of automation
We believe that paragon should be rated as a high growth, technology-rich automotive supplier. While the group is trading on a significant premium to its nearest peers, we believe this premium is justified by the company’s substantial above average market growth profile. To gain a true appreciation of the intrinsic value within paragon, we feel that a DCF valuation provides a more complete view of both its growth and margin potential. Our updated DCF fair value, reflecting our improved medium-term growth and margin forecasts yields an increased fair value of €82.1/share (from €40.1/share in October 2016).
Financials: Growth continues aplenty
With significant growth drivers across the business, we forecast a three-year CAGR in revenues of some 26% driven by the €1.2bn lifetime order backlog, over half of which is in the fast growth electromobility division. With highly automated production lines in place, margin expansion is anticipated, supporting a three-year CAGR in EPS of 63%. An elevated investment phase, which has seen €56m invested over the past two years is beginning to ease, and we forecast the group to transition to a cash generative delivery phase with improving free cash flow from FY18.
Sensitivities: Decreasing exposure to direct automotive
With the majority of sales direct to the automotive market, paragon is sensitive to economic conditions and automotive trends; however, it is less correlated to mass market cyclicality.
■
Decoupling from direct end-market fortunes – 70% of group revenues are from the German premium manufacturers, while increasing revenue per car being won in new systems provides a non-linear relationship to underlying automotive volumes. Automotive cost pressures and competition exist; however, the group designs technologically advanced products through a best-cost design for manufacture approach, with a high degree of automation.
■
Expansion to new market segments – to provide a further balancing of the group’s exposure to direct automotive factors, paragon has expanded to adjacent markets where similar high-quality systems engineering requirements exist, particularly in electromobility. It approaches this through relationships with strong partners in each target market, supported by good contract visibility and dedicated production facilities, mitigating inherent risks in this strategy.
■
Management and ownership concentration – the group is reliant on a small number of key personnel, in particular CEO Klaus Dieter Frers. This is mitigated by the three-man supervisory board, as well as the recent appointment of Dr Stefan Schwehr as CTO, providing governance as well as broadening management bandwidth.
Company description: From strength to strength
paragon was established by founder and major shareholder, Klaus Dieter Frers in March 1988, originally as an industrial electronics subcontract manufacturer, but subsequently concentrating primarily on the automotive market. Exhibit 1 below highlights the group’s timeline:
|
Exhibit 1: Timeline of development/major milestones |
|
|
Source: Edison Investment Research |
The group has undergone six key phases: 1988-1995: start-up in industrial electronics; 1996-2000: entry into automotive electronics; 2001-2008: emergence as a systems supplier; 2009-2011: concentration on automotive; 2012-2015: expansion to higher-quality systems and adjacent markets; and 2016 on: optimisation of the operation. The approach has been to identify emerging trends and develop products ahead of OEMs. Acquisitions have also played a part, such as SphereDesign in February 2015, which expanded the group’s capability into digital cockpit displays.
The group is organised by product divisions and following a reorganisation at the start of 2017, the divisional structure is as shown in Exhibit 2, supported by a central manufacturing organisation, productronic, which provides efficiencies of scale in manufacturing and is charged to divisions based on utilisation rates.
|
Exhibit 2: paragon divisional structure (since 1 January 2017) |
|
|
Source: Edison Investment Research |
paragon operates a centralised, highly-automated manufacturing approach with products designed for ease of production from the outset, giving the company a competitive edge over many of its peers. While there appear to be many competitors, in reality very few participate in more than one or two specific product lines. Exhibit 3 shows the locations of paragon’s operations.
|
Exhibit 3: paragon global locations |
|
|
Source: paragon |
As the graphic shows, the group has expanded beyond its traditional German roots with the Voltabox of Texas facility opened in July 2015 complying with the Buy American Act and providing some protection against US administrative changes. Likewise, the paragon Automotive Kunshan production facility was opened in autumn 2015 and has provided the group with local capability that has seen significant indigenous OEM wins.
In June 2017, the group reorganised its corporate structure at its German Voltabox subsidiary from a GmbH into a stock corporation (AG) and transferred the shares in the American subsidiary to the German subsidiary to provide greater strategic flexibility. Exhibit 4 highlights the new structure:
|
Exhibit 4: Updated corporate structure |
|
|
Source: paragon |
Strategy of innovation to support global megatrends
Paragon has followed a strategy of evolution built upon strong principles of technology and innovation supporting megatrends with the purpose of enhancing the driving experience for passengers of modern cars.
Management philosophy key to success
Key to paragon’s approach is the management philosophy that has been instilled by the founder and CEO Klaus Dieter Frers since the group’s creation in 1988, whereby product development is guided through analysis of what the end user will require in the future. As the group has grown, the same approach to creativity has been fostered and enhanced, maintaining the family-owned agile and entrepreneurial culture, while benefitting from the larger corporate integration capability. In April 2014, the management board was expanded with the appointment of Dr Stefan Schwehr to the post of chief technology officer (CTO), responsible for development, sales, and customer management. The appointment allowed Mr Frers to concentrate on new growth segments and internationalisation.
The business invests in product innovation using a push principle, only taking products to the OEMs once working prototypes are available and patents filed. This keeps IP with paragon and allows it to maintain an advantage over competitors who tend to be more reactive. It also allows paragon to occupy lucrative market niches in the premium segment at an early stage. The group’s growth strategy can be summarised as follows:
■
Constant development of product innovations based on megatrends (product development)
■
Gaining new automotive manufacturers as customers (market penetration)
■
Tapping into new sales areas (market development)
■
Tapping into new submarkets with new product offers (diversification)
This growth strategy is built upon both the strong historic foundation and an inherent focus on cost efficiency with a design for manufacture approach undertaken from the start. This focus is shown in the rapid uptake in automation across the group, a key feature that will ensure bottom line growth also follows the top line.
A leading tier 1 partner of premium OEMs – diversifying the base
paragon’s innovative approach has allowed it to build a position as a leading tier one partner of premium OEMs, originally focused in Germany, but now expanded across the globe as shown in Exhibit 5 below:
|
Exhibit 5: paragon customer mix (H117 revenues) |
|
|
Source: paragon |
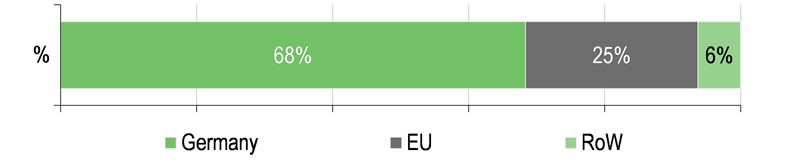
While c 70% of the group’s revenues are derived from the German automakers VW Group, Daimler and BMW due to the historic uptake of enhanced features in the premium segment, the group has seen demand extend further through the OEM customer base as such features become more common across further model segments. For example, following the opening of the group’s Chinese production operation in 2015, there are several indigenous Chinese OEMs within the “other” segment such as GAC Motor, Changan and Sanden. In addition, the US auto manufacturers are responding to European quality by increasing their own comfort features increasing the opportunity with the likes of GM and Ford.
As a result of the rapid growth of the electromobility division, two of the strategic partners that paragon is supplying, Triathlon and Kiepe Electric now respectively account for 9% and 4% of group revenues from a standing start less than three years ago, showing the significant growth in this division, which now accounts for 14.5% of revenue in total in H117.
R&D investment key to approach and margin retention
With innovation a key component of paragon’s strategy, the group spends an above-average level on R&D, averaging c 10% of revenue pa over the past five years and reaching 14.8% in FY16. This compares to an average spend of mid-single percentages for other automotive electronics firms such as Hella, which intends to spend about 8% of sales on R&D. The group has a unique combination of capabilities across systems engineering, electronics, software, sensor chemistry and physics, as well as electromechanics, which positions it to develop products with unique selling points that OEMs demand. In return, paragon maintains significant IP and superior margin performance compared to typical peers in the automotive equipment supply chain.
paragon has also moved from a provider of simply components and products to a developer of entire systems, increasing the content per vehicle to many times that of a single product and becoming increasingly involved with development with OEMs as a strategic partner.
An emerging leader in electromobility – doing what it said it would do
Following the decision to directly enter the electromobility market through creation of its Voltabox subsidiary in 2013, the group has followed a clear strategy to expand into several niches of the electromobility market, focused on the capital goods segments with key strategic partners who already have established distribution networks and clients. This has seen the group deliver over >21MWh of energy capacity installed since 2013:
■
Local public transportation. This was the first subsector paragon entered and it secured an initial contract with Vossloh-Kiepe (now Kiepe Electric) in June 2013 to supply 42 backup power modules for trolley buses in Geneva and Lucerne providing combined battery, power management and electronics control with stringent automotive safety quality. This was subsequently extended in May 2014 when paragon’s US subsidiary, Voltabox of Texas, received a major order for battery packs, worth double-digit millions of dollars for the supply of backup power supply batteries for a new fleet of 200 electric trolley buses in Seattle and San Francisco, with initial production commencing in 2014 and contributing to growth in 2015 and 2016. In total, the group has supplied over 270 battery systems so far, equating to some 7.5MWh of installed capacity.
■
Intralogistics. paragon has focused on building out its presence in various segments of the intralogistics market through partnerships with key players in the sector.
•
Forklifts. In March 2015, paragon announced that it had entered into a strategic partnership for the European market with Triathlon Batterien in an exclusive agreement for the supply of lithium ion batteries for the intralogistics market. The key area here is forklift battery substitution replacing the traditional lead-acid batteries conventionally found in the warehouse environment. Triathlon is one of the leading providers in Germany of traditional lead acid batteries to this market and is driving the switch to Voltabox’s high performance lithium-ion batteries. The long-term agreement covers production of several thousand battery modules a year. Initial production of several hundred modules commenced in 2015 and since then has seen >2,500 battery modules delivered in total and over 7.5Mwh of capacity installed.
•
Automated Guided Vehicles (AGVs). The strategic partnership with Kuka’s robotics business announced in October 2016 was a key indication of the importance placed on electromobility globally. Kuka is a clear leader in the field of industrial automation and the partnership is for the group’s German Voltabox subsidiary to develop and supply batteries to power Kuka’s automated guided vehicle, which is used in areas such as automotive production. First deliveries of 96V batteries began in Q117 and we saw them on our Delbrück site visit. Given the increasing use of networked production via industry 4.0, we see this as another significant step forward for the group.
■
Mining equipment. paragon’s Voltabox of Texas subsidiary entered into a strategic partnership with Joy Global (subsequently acquired by Komatsu) in June 2016. Voltabox is to develop a range of smart battery systems for various mining equipment with first deliveries already made in Q217. This was the largest single electromobility contract won by the group and in the first stage the group will develop batteries for use in the underground mining equipment. This will be extended across all platforms through the long-term co-operation which will roll out a development programme over the next few years with significant revenue contribution from FY18. Given the size and power requirements in this segment it is a game changer for both paragon and Komatsu and sees the group partnered with a company that has global distribution in 20 countries.
With each strategic submarket opened up by paragon, there is a clear economic driver for participants to convert to lithium ion batteries from existing lead-acid battery sources and hence it tends to be a substitution process rather than new development. This significantly de-risks the uptake of the technology and hence provides greater visibility for the group than in mass market automotive areas. Where there are niche opportunities however, the group will participate such as the July 2015 €72m, six-year contract from a well-known German automotive OEM for battery packs to be used as starter motors within conventionally powered vehicles. Likewise, a development team of experienced experts has been established at the newly created facility in Aachen focused on drivetrain components including power electronics providing paragon with the full range of capabilities. The 48V lithium-ion mild hybrid technology developed by paragon holds additional potential for specific mass market applications.
Automation improving efficiency to drive margins
We recently visited the group’s Delbrück operations to witness first-hand the change since we first visited the site in 2015. There are several key observations we made that will ensure that paragon both has the necessary capacity to support the substantial growth requirements from its clients and to drive further margin accretion through increased efficiency:
Doubling of site footprint and increased workforce in place
Following the group’s 2016 capital raise, the group invested in expanding the footprint of the Delbrück site taking the total footprint of the group to c 25,000 square meters of production and storage facilities. At the same time the structure of the production line was improved along increasingly lean operational principles with a total of 21 production robots across the group by the end of 2016. This has enabled the throughput and capacity utilising existing workforce practices to increase substantially and has contributed to the group’s ability to rapidly scale up the business in-line with demand.
Automation the next stage of efficiency
While the group has utilised the concept of design for manufacture and cost from the outset, the introduction of the new automated production line for intralogistics at Delbrück provides the group with substantial future efficiency gains. Exhibit 6 below highlights management’s guidance on the key operational improvements that the line will provide:
Exhibit 6: Impact of highly automated electromobility production line for intralogistics
Manual |
Automated |
|
Cycle time in seconds (eg NMC modules) |
~575 |
311 |
Overall equipment effectiveness (OEE) |
90% |
>90% |
Limiting factors |
EOL tester, laser welding |
Defined cycle times |
Production capacity – modules/week (1 shift) |
~250 |
~415 |
Total capacity – modules/week (including US) |
~250 |
~830 |
Number of employees |
12 |
4 |
Source: paragon
The introduction of increased automation in the electromobility division will provide paragon with greater flexibility as volumes ramp up and allow margins to significantly increase from the largely fixed cost base. The benefit of this can be seen in the electronics division, where the high degree of automation allows paragon to achieve divisional margins of c 15% vs group margins of 9% in 2016.
A scalable architecture at home and abroad
Importantly the group has designed the automated intralogistics line with growth and scalability in mind through a modular approach. The machines were provided by Aumann, with the first line commissioned in June and room for a second line already available as demand ramps up. Each line costs c €1.5m to install and commission.
With the knowledge gained at the Delbrück site, paragon could replicate the line in its Voltabox, Texas, facility as demand ramps up. Likewise, while the line currently supplies cylindrical and prismatic batteries, developments are in place to allow production of pouch cells, which would open up further market opportunities for the group. These developments highlight that the evaluation of the division is likely to continue.
Financials: Showing growth trajectory
paragon’s FY16 and Q217 results clearly showed that the company is on a firm growth trajectory, having met management’s guidance despite some timing issues as old programmes ended ahead of new product introductions. With the confidence that this provided, management has reaffirmed its guidance for FY17 revenues of between €120-125m at an EBIT margin of 9.0-9.5%.
Positive full year results plus further growth in H117
FY16 results demonstrated the positive developments at the group, reaching management’s guidance and in line with our forecasts. The group delivered revenue up 8.2%, EBITDA up 13.2% and EBIT up 14.4% at an EBIT margin of 8.7%. Electromobility remained the key growth driver, up c 93% to €14.3m or 14% of group revenue from a standing start barely two years ago and despite some project delays into 2017. With other areas of the group also contributing strongly (Cockpit and Acoustics, in particular), the group achieved our revenue and profit forecasts.
This was followed up by H117 results, which demonstrated a continuation of the strong growth, with revenues up 13.3% to €55.3m, driven largely by Electromobility (up 78.1%) and now accounting for c 14% group share of revenue. EBITDA increased by 17.7% to €8.0m despite a step-up in personnel and EBIT was up 5.3% at €3.7m following the increase in D&A. H117 also saw the construction of the new automated production line for Voltabox in Q1, which we subsequently visited.
Cash flow reflects stage of growth and delivery
Given the investment phase that paragon has been undertaking over the past three years, free cash flow has been negative following the substantial investment in new business ventures, production facilities and R&D. Over the past two years, the group has invested c €56m across the business with a further €27m planned in 2017 to accelerate the delivery capability of the group. We subsequently see this progressively dropping to a run rate of c €8m pa. With the group moving into a delivery ramp up phase, we expect this cash outflow to ease and turn positive, albeit the group will continue to identify and use funds to drive further top-line growth where new opportunities present themselves.
Oversubscribed bond issue further strengthens balance sheet
In June 2017, paragon announced that it was pursuing a bond issue to support accelerated growth in 2017. Following an extremely successful marketing period, the group closed the issue early in an accelerated fashion. This allowed paragon to close the bond issue at an elevated level of €50m versus the original target of €40m at an interest rate margin of 4.5%, the bottom end of the indicated range of 4.5-5.0%. This compares to the 2013 bond, which c €13m of the proceeds will be used to repay, and which had an interest rate of 7.25%, highlighting how the funding structure is being optimised.
The remaining proceeds from the issue will be utilised to provide further flexibility for growth projects. This includes: investment on working capital for orders under contract; further expansion of the Chinese business; potential acquisition activity in support of electromobility; further R&D with a particular focus on autonomous systems; potential further geographic expansion; and new capital expenditure of plant and production facilities as necessary. In total, investment is expected to increase to some €27m in 2017.
Forecasts driven by electromobility in the short term
The most significant driver of our short-term forecasts is the ramp up of the electromobility division, as the automated production lines come on stream and the significant order backlog is delivered. With over half the lifetime order book of some €1.4bn related to the electromobility division, this is set to become the largest contributor to growth over the next five years. There will also be a further kicker to growth from 2018 as the new production programmes ramp up in both Mechanics and Electronics. Detailed divisional forecast drivers are as follows:
Electronics set to expand at above market growth rate
The electronics division has several effects on the growth profile across the different units, driven by the combination of increasing take rates and model transitions as new products transition into serial production:
■
Sensors witnessed a slight decrease in H117 due to lifecycle effects and we expect that this will continue throughout 2017 as new models with increasing take rates come to the market. In the medium term we forecast steadily increasing revenue as this effect takes hold and the production of the sensors ramps up in China with indigenous OEMs. The introduction of the group’s DUSTDETECT particle sensor will provide a further boost from 2019. As a result, we see a long-term growth rate above the global automotive market growth at c 10% pa, driven by increasing penetration and the exposure to Chinese growth.
■
The Cockpit unit grew 6% in H1 as a result of the beginning of serial production of a new generation of cockpit instruments for a longstanding customer. We forecast that this growth will continue in FY17 before normalising again in FY18 and FY19. Longer-term cockpit revenues are likely to be supported by growth from the group’s development of the MirrorPilot smartphone integration system as this megatrend permeates through the entire model range.
■
Acoustics continued to record substantial increases, up some 29% in H1 as the volumes of the current generation of premium hands-free microphones increased, with increasing take rates and fitment into customers’ ranges. This is largely being driven by the continued focus on hands-free communication within the car, something we forecast will continue in the medium term. Longer-term developments include the 3D+ In-Car-Audio (ICA) system being developed in conjunction with Audionet, which allows decentralised components to be networked via a digital data bus system, reducing weight and allowing greater sound quality.
Electromobility: Visibility afforded by contracts; delivery key
The Electromobility division has demonstrated its ability to ramp up significantly as new contracts have come on stream even before the fully optimised automated production line was on stream. Exhibit 7 below shows the growth in installed energy capacity, which highlights this step up.
|
Exhibit 7: >21MWh of energy installed since 2013 (MWh) |
|
|
Source: paragon |
We forecast that the significant ramp up in electromobility is set to continue as the new contracts across the subsectors come on stream, supported by the newly installed automated production line. We assume the following key inflection points for each contract:
■
Public transportation. The Kiepe Electric contract has an option for a further 330 trolleybuses, which we assume will be delivered over the next three years following a pause in 2017.
■
Intralogistics. We forecast that intralogistics will continue to step-up and then reach a steady state of c 2,000 units per year from 2017.
■
Mining equipment. We forecast that there are a series of points at which new products will come on stream, starting with Joy Battery Haulers, which started development in Q316, with the first prototype delivered in Q217. This is expected to be followed by fully electric load haul dumpers whose development started in Q416 with first prototype expected in Q417, then face drilling jumbos (development Q118; prototype Q318). Further extension to the whole portfolio is then expected to occur on a progressive roll-out. As a result, we expect the Joy Global contract to only start making a real impact from late 2018.
■
Automated guided vehicle (AGV). paragon’s entry into the AGV is via the contract with Kuka, with the group providing a tailored electrification solution initially to Kuka’s KMP 1500 AGV suited to car body production facilities. Delivery of the first 96V battery took place in Q117 and batteries are due to be delivered throughout 2017. This is then set to ramp up in 2018 with further growth in later years. Longer-term drivers are expected to be the increased automation in factories as a result of the Industry 4.0 revolution, which would support further ramp ups.
■
Motorcycle starter battery. While initial production of the starter motor was delayed into 2017 from 2016, we now forecast that the six-year programme will commence in Q317. We expect the programme to ramp up during 2017 and 2018 and then reach a steady state before coming to an end. This programme is expected to lead to more opportunities for use in this application across a broader range of products once demonstrated.
Mechanics reflects transition to serial production
The Body Kinematics unit of Mechanics revenue was up 23% in H1, as the unit moves from development phase into serial production of new product generations of adaptive rear spoilers. Serial production of the first programme began in Q2, with another four series planned for production by the end of the fiscal year. As a result, we forecast that FY17 will start to see some year-on-year growth, arresting the decline of the last couple of years due to programme phasing, and is set to ramp up over FY18 and FY19 as the serial production runs begin in earnest. We saw on our visit to Delbrück the initial production runs commencing, and the lean manufacturing setup of the new expanded facility. With longer-term drivers for adaptive aerodynamic surfaces, the Body Kinematics unit is supported by the megatrend of fuel efficiency, which will be equally important in electric cars as in traditional fuel burning variants.
Group-wide forecasts highlight significant growth still to come
Exhibit 8 below highlights the key divisional and group-wide assumptions. As can be seen, there is a significant step up in our forecasts in our introduced FY19 numbers, which reflect the fact that each of the strategic markets currently being addressed in electromobility will have ramped up and be running in parallel. With a lifetime order backlog of over €600m in electromobility already, our forecast simply reflects delivery of the order book and easily supports our forecasts without any further orders being received.
Exhibit 8: Updated Edison forecasts
Year-end December (€m) |
FY16e 'old' |
FY16 |
Change |
FY17e 'old' |
FY17e 'new' |
Change |
FY18e 'old' |
FY18e 'new' |
Change |
FY19e 'new' |
Revenue |
||||||||||
Electronics |
85 |
85 |
1% |
88 |
89 |
1% |
94 |
95 |
1% |
102.8 |
Electromobility |
14 |
14 |
2% |
30 |
31 |
2% |
51 |
52 |
2% |
89.1 |
Mechanics |
4 |
3 |
(23%) |
6 |
4 |
(23%) |
14 |
9 |
(39%) |
13.1 |
Group |
103 |
103 |
0% |
124 |
124 |
0% |
159 |
156 |
(2%) |
205.0 |
Other income |
14 |
15 |
7% |
14 |
10 |
(27%) |
14 |
10 |
(26%) |
8.3 |
Group operating performance |
117 |
118 |
1% |
138 |
134 |
(3%) |
173 |
166 |
(4%) |
213.3 |
COGS |
(58) |
(58) |
0% |
-68 |
(67) |
(1%) |
(87) |
(85) |
(3%) |
(112) |
Gross Profit |
59 |
61 |
3% |
70 |
67 |
(5%) |
86 |
81 |
(5%) |
101.6 |
Personnel expenses |
(27) |
(29) |
6% |
(32) |
(33) |
3% |
(41) |
(39) |
(5%) |
(48.7) |
Depreciation of PPE & amortisation of intangibles |
(7) |
(7) |
2% |
(7) |
(8) |
12% |
(8) |
(9) |
17% |
(9.9) |
Impairment of PPE & intangibles |
0 |
0 |
N/M |
0 |
0 |
N/M |
0 |
0 |
N/M |
0.0 |
Other operating expenses |
(16) |
(15) |
(5%) |
(19) |
(14) |
(22%) |
(21) |
(17) |
(22%) |
(19.9) |
Group EBIT |
9 |
9 |
(1%) |
12 |
11 |
(7%) |
16 |
17 |
5% |
23.1 |
Underlying Net Interest |
(2.5) |
(3.2) |
27% |
(2.7) |
(3.4) |
26% |
(2.5) |
(3.5) |
40% |
(3.0) |
PBT (EBT) |
6.4 |
5.8 |
(10%) |
9.4 |
7.8 |
(16%) |
13.3 |
13.1 |
(2%) |
20.1 |
Tax |
(2.1) |
(2.2) |
5% |
(3.1) |
(2.6) |
(16%) |
(4.4) |
(4.3) |
(2%) |
(6.6) |
Net Profit |
4.3 |
3.6 |
(17%) |
6.3 |
5.2 |
(16%) |
8.9 |
8.8 |
(1%) |
13.5 |
EPS (normalised) (€) |
1.02 |
0.84 |
(17%) |
1.39 |
1.16 |
(16%) |
1.97 |
1.95 |
(1%) |
2.99 |
Source: paragon accounts, Edison Investment Research
Sensitivities around rate of change in end-markets
As a supplier into the automotive and related markets, paragon’s development is linked to an extent to global economic growth and automotive market drivers. The group is also influenced by evolving corporate development, as it grows to address adjacent markets:
■
Decoupling from direct end-market fortunes – while paragon will be affected by global economic growth and drivers in the automotive market, there are a number of factors that provide the group with above-market growth potential. These include c 70% exposure to the German premium manufacturers, as well as the increasing revenue per car being won in new systems, which provides a non-linear relationship to underlying automotive volumes.
■
Automotive cost pressures – traditional automotive cost pressures and competition exist for the group. It mitigates this through a design for manufacture approach and a high degree of automation, as well as its positioning as a design leader.
■
Expansion to new market segments – to provide a further balancing of the group’s exposure to direct automotive factors, paragon has expanded its reach to adjacent market segments, where similar requirements for high-quality systems engineering exist, particularly in electromobility. The ability of the group to deliver suitable contracts and performance in these markets will influence EPS growth over the next three years. This expansion has been enhanced through paragon’s relationship with strong partners in each target market, supported by good contract visibility and dedicated production facilities.
■
Management and ownership concentration – given the high degree of management ownership and reliance on CEO Klaus Dieter Frers, the group is exposed to a high reliance on a small number of key personnel. This is mitigated from a management perspective by the three-person supervisory board, as well as the recent appointment of Dr Schwehr as CTO. This provides an improved governance structure as well as broadening the management bandwidth to pursue new markets and internationalisation of the group.
Valuation: Re-rating has occurred; further on delivery
Since our initiation of coverage of paragon in September 2015, the shares have rallied by 343% as the potential of the group has been recognised and significant newsflow has validated the demand for the electromobility division. While this leaves short-term relative ratings appearing stretched, we believe that as the group continues to deliver the growth and demonstrates the benefits of the investment in automation and efficiency, a further re-rating may be possible. With the combination of strong FY16 and Q117 results and the operational improvements we witnessed on our visit to Delbrück, we have reassessed our medium-term prospects for the group and raised our assumptions. This has resulted in an increase in our fair value to €82.3/share.
Short-term relative rating appears stretched, growth key
As can be seen in Exhibit 9 below, paragon trades at a substantial premium to its nearest listed peers in the automotive electronics & interior sector. We believe, however, that the premium is justified by the superior above-market growth rates, with a c 26% 2014-17 CAGR in revenues many times the peer group average, which we expect to continue as the company is entering the next growth phase. As a result, we believe that paragon should be viewed as a high-growth, technology-rich, automotive supplier, which reflects the business model rather than the traditional electronics and interiors peers. This is also highlighted by a PEG ratio of 0.8x (2017e EPS divided by 2014-17e EPS CAGR) compared to the group average of only 1.3x.
Exhibit 9: Relative peer ratings for electronics / interiors peers
Price (local ccy) |
Mkt cap (€m) |
3-yr CAGR |
P/E (x) |
EV/sales (x) |
EV/EBITDA (x) |
EBITDA margin (%) |
EV/EBIT (x) |
EBIT margin (%) |
||||||||||
Sales |
EPS |
2017e |
2018e |
2017e |
2018e |
2017e |
2018e |
2017e |
2018e |
2017e |
2018e |
2017e |
2018e |
|||||
Continental (GER) |
190 |
37,971 |
6.1 |
8.6 |
11.7 |
10.7 |
1.0 |
0.9 |
6.1 |
5.6 |
15.8 |
16.2 |
8.8 |
8.0 |
11.0 |
11.4 |
||
Denso (JP) |
5361 |
50,616 |
3.6 |
9.6 |
14.5 |
12.5 |
1.3 |
1.3 |
9.7 |
9.2 |
13.4 |
13.7 |
16.8 |
15.8 |
7.8 |
8.0 |
||
Delphi (US) |
93 |
21,953 |
4.2 |
8.4 |
14.1 |
12.9 |
1.7 |
1.6 |
9.4 |
8.9 |
17.7 |
17.8 |
12.4 |
11.6 |
13.5 |
13.6 |
||
Magna (US) |
59 |
19,173 |
6.3 |
10.5 |
10.2 |
9.2 |
0.6 |
0.6 |
5.7 |
5.6 |
11.2 |
10.5 |
7.8 |
7.9 |
8.2 |
7.5 |
||
Lear (US) |
142 |
9 |
3.9 |
5.1 |
8.8 |
8.4 |
0.0 |
0.0 |
0.3 |
0.3 |
10.5 |
10.3 |
0.4 |
0.4 |
8.3 |
8.1 |
||
Hella (GER) |
45 |
5,026 |
5.9 |
12.8 |
14.1 |
12.6 |
0.8 |
0.7 |
5.9 |
5.4 |
13.4 |
13.9 |
10.7 |
9.6 |
7.4 |
7.8 |
||
Visteon (US) |
114 |
3,138 |
3.7 |
13.4 |
19.6 |
17.1 |
1.0 |
0.9 |
8.4 |
7.7 |
11.6 |
12.1 |
10.9 |
10.1 |
8.9 |
9.2 |
||
Average |
5.0 |
9.2 |
12.2 |
11.0 |
0.9 |
0.9 |
6.2 |
5.8 |
13.7 |
13.7 |
9.5 |
8.9 |
9.3 |
|||||
paragon |
67.0 |
275.5 |
25.9 |
64.2 |
57.7 |
34.4 |
2.4 |
1.9 |
15.1 |
11.5 |
15.7 |
16.5 |
26.2 |
17.7 |
9.1 |
10.7 |
||
Source: Edison Investment Research, Bloomberg data. Note: Priced at 15 August 2017.
To gain a true appreciation of the value potential of the group, we instead prefer to utilise a longer-term DCF valuation approach.
Uplift in medium-term forecasts drives DCF increase
Following our visit to Delbrück and reflecting recent results and the June bond issue, we have updated our long-term financial assumptions for an increased EBIT margin potential (long-term target of 12% versus 10.5% before and 8.7% in 2016), driven by investment in automation and efficiency, and reduced our WACC to 7% (from 8%) to reflect the stronger balance sheet and cheaper debt. We use a terminal growth rate of 2%. As a result, our updated DCF fair value has increased to €82.1/share, as shown in Exhibit 10. With a strong backlog and order visibility supported by a transition from investment to production, we believe that execution is now the major focus and value driver for the group. As the ramp occurs, we forecast that free cash flow will improve, debt will further reduce and the fair value will respond accordingly.
Exhibit 10: DCF fair value assessment
Year ended 31 December (€m) |
2017e |
2018e |
2019e |
2020e |
2021e |
2022e |
2023e |
2024e |
2025e |
2026e |
2027e |
|||||||||
Assumptions |
|
|
|
|
|
|
|
|
|
|
|
|||||||||
Sales |
124 |
156 |
205 |
246 |
283 |
297 |
312 |
321 |
331 |
337 |
344 |
|||||||||
% change |
n/a |
25.8% |
31.6% |
20.00% |
15.00% |
5.00% |
5.00% |
3.00% |
3.00% |
2.00% |
2.00% |
|||||||||
EBIT |
11 |
17 |
23 |
28 |
34 |
36 |
37 |
39 |
40 |
40 |
41 |
|||||||||
% margin |
9.1% |
10.7% |
11.3% |
11.5% |
12.0% |
12.0% |
12.0% |
12.0% |
12.0% |
12.0% |
12.0% |
|||||||||
% change |
n/a |
47.8% |
38.9% |
22.6% |
20.0% |
5.0% |
5.0% |
3.0% |
3.0% |
2.0% |
2.0% |
|||||||||
Tax |
(3) |
(4) |
(7) |
(9) |
(11) |
(12) |
(12) |
(13) |
(13) |
(13) |
(14) |
|||||||||
% tax rate |
33.0% |
32.8% |
33.0% |
33.0% |
33.0% |
33.0% |
33.0% |
33.0% |
33.0% |
33.0% |
33.0% |
|||||||||
NOPAT |
9 |
12 |
17 |
19 |
23 |
24 |
25 |
26 |
27 |
27 |
28 |
|||||||||
% margin |
7.0% |
7.9% |
8.1% |
7.7% |
8.0% |
8.0% |
8.0% |
8.0% |
8.0% |
8.0% |
8.0% |
|||||||||
% change |
n/a |
42.3% |
34.3% |
14.7% |
20.0% |
5.0% |
5.0% |
3.0% |
3.0% |
2.0% |
2.0% |
|||||||||
Depreciation & Amortisation |
8 |
9 |
10 |
10 |
10 |
10 |
11 |
11 |
11 |
12 |
12 |
|||||||||
Change in working capital |
(5) |
(5) |
(5) |
(5) |
(5) |
(5) |
(4) |
(4) |
(4) |
(4) |
(4) |
|||||||||
Capex |
(27) |
(16) |
(14) |
(8) |
(4) |
(4) |
(4) |
(4) |
(4) |
(4) |
(4) |
|||||||||
Free cash flow to firm |
(15) |
0 |
7 |
16 |
24 |
25 |
28 |
29 |
30 |
31 |
32 |
|||||||||
WACC |
7.0% |
7.0% |
7.0% |
7.0% |
7.0% |
7.0% |
7.0% |
7.0% |
7.0% |
7.0% |
7.0% |
|||||||||
Year |
1 |
2 |
3 |
4 |
5 |
6 |
7 |
8 |
9 |
10 |
11 |
|||||||||
Discount factor |
1.07 |
1.14 |
1.23 |
1.31 |
1.40 |
1.50 |
1.61 |
1.72 |
1.84 |
1.97 |
2.10 |
|||||||||
Present value free cash flow |
(14) |
0 |
6 |
12 |
17 |
17 |
17 |
17 |
16 |
16 |
15 |
|||||||||
Cumulative present value |
(14) |
(14) |
(8) |
4 |
21 |
38 |
55 |
72 |
88 |
104 |
119 |
|||||||||
|
|
|
||||||||||||||||||
Net present value – forecast FCF |
119 |
|
Fair value (€) |
WACC |
||||||||||||||||
Net present value – terminal value |
287 |
|
5.0% |
6.0% |
7.0% |
8.0% |
9.0% |
|||||||||||||
Enterprise Value |
406 |
|
Terminal growth |
0.0% |
101.0 |
79.3 |
63.9 |
52.5 |
43.7 |
|||||||||||
|
|
|
1.0% |
120.6 |
91.0 |
71.5 |
57.6 |
47.3 |
||||||||||||
Net debt |
(35) |
|
2.0% |
153.1 |
108.6 |
82.1 |
64.4 |
51.9 |
||||||||||||
Minorities |
0 |
|
3.0% |
218.2 |
138.0 |
97.9 |
74.0 |
58.1 |
||||||||||||
Value attributable to shareholders |
371 |
|
4.0% |
413.4 |
196.6 |
124.4 |
88.3 |
66.7 |
||||||||||||
Shares outstanding, m |
4.5 |
|
||||||||||||||||||
Value per share (€) |
82.1 |
|
||||||||||||||||||
Source: Edison Investment Research
A 2% reduction in our long-range revenue forecasts would reduce the DCF fair value by 11% to €74.1/share, while a 2% reduction in our margin assumption would result in a 17% decrease in fair value to €70.3/share.
Exhibit 11: Financial summary
€m |
2014 |
2015 |
2016 |
2017e |
2018e |
2019e |
||
Year end 31 December |
IFRS |
IFRS |
IFRS |
IFRS |
IFRS |
IFRS |
||
PROFIT & LOSS |
||||||||
Revenue |
|
|
79.0 |
95.0 |
102.8 |
123.8 |
155.7 |
205.0 |
Other operating income |
1.4 |
3.2 |
1.1 |
1.2 |
1.2 |
1.2 |
||
Increase or decrease in inventory of finished goods / WIP |
0.8 |
1.4 |
(0.9) |
(0.9) |
(0.9) |
(0.9) |
||
Other own work capitalised |
5.2 |
12.8 |
15.3 |
10.0 |
10.0 |
8.0 |
||
Group operating performance |
|
|
86.3 |
112.4 |
118.3 |
134.1 |
166.0 |
213.3 |
Cost of Sales |
(41.8) |
(55.5) |
(57.7) |
(67.5) |
(84.9) |
(111.7) |
||
Gross Profit |
44.5 |
56.9 |
60.5 |
66.7 |
81.2 |
101.6 |
||
EBITDA |
|
|
10.5 |
14.1 |
16.1 |
19.4 |
25.6 |
33.0 |
Operating Profit (before amort. and except.) |
|
|
6.2 |
7.8 |
8.9 |
11.2 |
16.6 |
23.1 |
Intangible Amortisation |
0.0 |
0.0 |
0.0 |
0.0 |
0.0 |
0.0 |
||
Exceptionals |
0.0 |
0.0 |
0.0 |
0.0 |
0.0 |
0.0 |
||
Other |
0.0 |
0.0 |
0.0 |
0.0 |
0.0 |
0.0 |
||
Operating Profit |
6.2 |
7.8 |
8.9 |
11.2 |
16.6 |
23.1 |
||
Net Interest |
(2.0) |
(2.8) |
(3.2) |
(3.4) |
(3.5) |
(3.0) |
||
Profit Before Tax (norm) |
|
|
4.3 |
5.0 |
5.8 |
7.8 |
13.1 |
20.1 |
Profit Before Tax (FRS 3) |
|
|
4.3 |
5.0 |
5.8 |
7.8 |
13.1 |
20.1 |
Tax |
(1.5) |
(1.6) |
(2.2) |
(2.6) |
(4.3) |
(6.6) |
||
Profit After Tax (norm) |
2.8 |
3.4 |
3.6 |
5.2 |
8.8 |
13.5 |
||
Profit After Tax (FRS 3) |
2.8 |
3.4 |
3.6 |
5.2 |
8.8 |
13.5 |
||
Average Number of Shares Outstanding (m) |
4.1 |
4.1 |
4.2 |
4.5 |
4.5 |
4.5 |
||
EPS - normalised (c) |
|
|
67.4 |
82.7 |
84.4 |
116.0 |
194.5 |
298.7 |
EPS - normalised fully diluted (c) |
|
|
67.4 |
82.7 |
84.4 |
116.0 |
194.5 |
298.7 |
EPS - (IFRS) (€) |
|
|
0.7 |
0.8 |
0.8 |
1.2 |
1.9 |
3.0 |
Dividend per share (€) |
0.00 |
0.00 |
0.00 |
0.00 |
0.00 |
0.00 |
||
Gross Margin (%) |
56.3 |
59.8 |
58.9 |
53.8 |
52.1 |
49.6 |
||
EBITDA Margin (%) |
13.3 |
14.8 |
15.6 |
15.7 |
16.5 |
16.1 |
||
Operating Margin (before GW and except.) (%) |
7.9 |
8.2 |
8.7 |
9.1 |
10.7 |
11.3 |
||
BALANCE SHEET |
||||||||
Fixed Assets |
|
|
30.1 |
59.7 |
75.8 |
81.6 |
77.6 |
72.7 |
Intangible Assets |
9.4 |
24.7 |
38.0 |
36.0 |
34.0 |
32.0 |
||
Tangible Assets |
20.2 |
34.6 |
37.4 |
45.2 |
43.2 |
40.3 |
||
Investments |
0.5 |
0.4 |
0.4 |
0.4 |
0.4 |
0.4 |
||
Current Assets |
|
|
32.3 |
32.9 |
39.7 |
82.7 |
88.7 |
94.7 |
Stocks |
6.9 |
11.2 |
13.7 |
16.7 |
19.7 |
22.7 |
||
Debtors |
12.2 |
13.2 |
11.7 |
14.7 |
17.7 |
20.7 |
||
Cash |
11.8 |
8.5 |
14.3 |
51.3 |
51.3 |
51.3 |
||
Other |
1.5 |
0.0 |
0.0 |
0.0 |
0.0 |
0.0 |
||
Current Liabilities |
|
|
(16.2) |
(27.1) |
(36.0) |
(18.6) |
(17.6) |
(16.6) |
Creditors |
(10.7) |
(17.8) |
(22.6) |
(5.2) |
(4.2) |
(3.2) |
||
Short term borrowings |
(5.5) |
(9.3) |
(13.4) |
(13.4) |
(13.4) |
(13.4) |
||
Long Term Liabilities |
|
|
(41.9) |
(59.2) |
(58.0) |
(114.6) |
(118.8) |
(115.4) |
Long term borrowings |
(24.7) |
(38.5) |
(35.8) |
(92.4) |
(96.6) |
(93.2) |
||
Other long term liabilities |
(17.1) |
(20.7) |
(22.3) |
(22.3) |
(22.3) |
(22.3) |
||
Net Assets |
|
|
4.3 |
6.2 |
21.5 |
31.1 |
29.9 |
35.4 |
CASH FLOW |
||||||||
Operating Cash Flow |
|
|
10.3 |
16.4 |
20.1 |
14.4 |
20.6 |
28.0 |
Net Interest |
(1.9) |
(2.9) |
(3.2) |
(3.4) |
(3.5) |
(3.0) |
||
Tax |
(1.4) |
(0.7) |
(0.2) |
(2.6) |
(4.3) |
(6.6) |
||
Capex |
(10.5) |
(18.8) |
(22.0) |
(27.0) |
(16.0) |
(14.0) |
||
Acquisitions/disposals |
(5.2) |
(13.5) |
0.0 |
0.0 |
0.0 |
0.0 |
||
Financing |
0.0 |
0.0 |
12.0 |
0.0 |
0.0 |
0.0 |
||
Dividends |
(1.0) |
(1.0) |
(1.0) |
(1.0) |
(1.0) |
(1.0) |
||
Net Cash Flow |
(9.7) |
(20.5) |
5.7 |
(19.6) |
(4.2) |
3.4 |
||
Opening net debt/(cash) |
|
|
6.7 |
18.4 |
39.4 |
34.9 |
54.5 |
58.7 |
HP finance leases initiated |
0.0 |
0.0 |
0.0 |
0.0 |
0.0 |
0.0 |
||
Other |
(1.9) |
(0.5) |
(1.2) |
0.0 |
0.0 |
0.0 |
||
Closing net debt/(cash) |
|
|
18.4 |
39.4 |
34.9 |
54.5 |
58.7 |
55.3 |
Source: paragon accounts, Edison Investment Research
|
|||||||||||||||||||||||||||||||||||||||||
|
|
Research: TMT
EQS’s first half results show good revenue growth in its domestic market, boosted by the consolidation of ARIVA (67.5% owned). The build-up of business in new markets is starting to register, with Asia now breaking even. The costs of this expansion and investment in a number of new products and services is constraining operating profits, which were marginally (3%) below the comparative period. The group remains well positioned to benefit from trends in digitisation and globalisation and the growing complexity of corporate compliance requirements.