Is Yatirim’s (ISY) Q117 results showed a strong performance by the investment banking business, driven by robust equity, debt and derivatives markets, slight increases to some commission margins as well as continued growth in AUM, particularly from higher-fee pension fund assets. Is Investment (the investment bank) posted net profits more than 50% up on Q116, which was the strongest quarter in that year. With the exception of the NPL business, all the consolidated segments beat our expectations and we have revised our estimates upwards as a result. The government’s success in the 16 April referendum may bring greater stability to the turbulent political scene in Turkey, contributing to a better outlook in 2017.
Written by
Is Yatirim Menkul Degerler |
Ahead of expectations |
Q117 results |
Financial services |
11 May 2017 |
Share price performance
Business description
Next events
Analysts
|
||||||||||||||||||||||||||||||||||||||||||||||||
Is Yatirim’s (ISY) Q117 results showed a strong performance by the investment banking business, driven by robust equity, debt and derivatives markets, slight increases to some commission margins as well as continued growth in AUM, particularly from higher-fee pension fund assets. Is Investment (the investment bank) posted net profits more than 50% up on Q116, which was the strongest quarter in that year. With the exception of the NPL business, all the consolidated segments beat our expectations and we have revised our estimates upwards as a result. The government’s success in the 16 April referendum may bring greater stability to the turbulent political scene in Turkey, contributing to a better outlook in 2017.
Year end |
Revenue (TRYm) |
PBT* |
EPS* |
DPS |
P/E |
Yield |
12/14 |
372.4 |
100.5 |
17.7 |
13.2 |
7.9 |
9.4 |
12/15 |
377.5 |
33.7 |
11.4 |
10.0 |
12.3 |
7.1 |
12/16 |
438.9 |
41.6 |
15.2 |
12.7 |
9.2 |
9.1 |
12/17e |
508.2 |
119.8 |
22.1 |
12.7 |
6.3 |
9.1 |
12/18e |
535.0 |
134.9 |
24.7 |
12.7 |
5.7 |
9.1 |
Note: *PBT and EPS are normalised, excluding amortisation of acquired intangibles, exceptional items and share-based payments.
A healthy start to the year
Is Investment reported Q117 revenues 34% ahead year-on-year, including commission revenues up 43%, while interest and trading income advanced 27%. Within commissions, corporate finance and brokerage recorded the strongest growth. This drove a 56% increase in net profit. Among the subsidiary businesses, Efes NPL Asset Management and Is Private Equity continued to record losses but were stable and lower respectively on a sequential basis. The other segments all performed better than expected, particularly Is Asset Management, which saw net profits rise 26% year-on-year. Consolidated net profit more than doubled to TRY27.2m from TRY12.6m in Q116.
Estimates increased
Given the improved political, and potentially economic, outlook and ISY’s strong Q1 performance, we have made conservative increases to our revenue growth assumptions for Is Investment (they now feed through to net profit of TRY93.3m for the year vs TRY81.1m previously, vs TRY46.0m in Q117) and maintained our forecasts for the consolidated segments. Our new forecasts give FY17 ROE of 13.0%, up from 11.2%, and our dividend assumption is unchanged.
Valuation: Room for gains
On a P/E basis, ISY is valued more conservatively than our chosen peer group of European banks, and although it is more in line on a price to book ratio, ISY has a higher prospective ROE (13.0%) and dividend yield (9.1%) than the peer group (3.1% and 5.8%). The shares reacted well to the Q117 results and continued strong performance could see further gains given the undemanding current valuation.
Leading Turkish investment bank
Is Yatirim’s parent, İşbank, is Turkey’s largest private bank by assets and owns over 70% of Is Yatirim’s shares directly and through affiliates. ISY’s core investment banking division has leading or high market shares in many areas of investment banking in Turkey, including equity trading, derivatives and debt securities. It is also active in equity IPOs, bond issue, asset management, non-performing loan management and private equity.
Turkey’s economic outlook
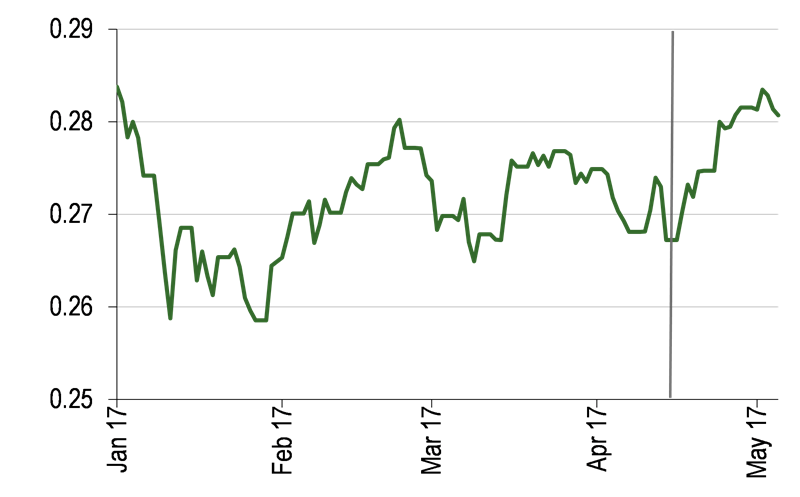
Following the turbulent political climate of 2016, the result of the constitutional referendum held on 16 April 2017 has reduced uncertainty and consolidated the executive powers of the incumbent president. Some indicators have reacted positively: the BIST 100 index had already risen c 16% in 2017 at that date, and continued to climb following the result, rising a further 4% by 5 May (Exhibit 1). The Turkish lira has climbed a similar amount vs the US dollar since the vote (Exhibit 2).
|
Exhibit 1: BIST 100 index |
Exhibit 2: TRY vs US$ in 2017 |
|
|
|
Source: Bloomberg. 2 January 2017 = 1 |
Source: Bloomberg. The vertical line shows the date of the referendum. |
|
Exhibit 1: BIST 100 index |
|
|
Source: Bloomberg. 2 January 2017 = 1 |
|
Exhibit 2: TRY vs US$ in 2017 |
|
|
Source: Bloomberg. The vertical line shows the date of the referendum. |
The apparently positive reaction in currency and equity markets may be reflected in economic forecasts. While the IMF and the OECD have not yet revised their expectations for Turkish growth, the Institute of International Finance (IIF) has reportedly upgraded its estimates of GDP growth in 2017 from 3.0% to 4.2% and from 3.2% to 3.5% in 2018. TURKSTAT (equivalent to the Office for National Statistics) reported in April that Q416 saw 3.8% growth quarter-on-quarter (and 3.5% year-on-year), and revised its estimates for the first nine months of 2016 upwards. The central bank issued a cautiously positive summary of its monetary policy committee meeting on 28 April: it noted that a mild economic recovery continued, kept its main interest rates steady (8% weekly repo rate) and raised the late liquidity window lending rate to help control inflation, running at over 11.5%, which it expects to remain high in the near term.
The government has launched a new credit guarantee fund (CGF) of TRY250bn (c $70bn) aimed at SMEs that have insufficient collateral to obtain credit, which may help encourage growth and investment. More generally, sustained fiscal discipline, greater political clarity and possibly a better security situation could add to that effect. The situation in Syria shows glimmers of improvement too: talks held in Astana between the Syrian government and rebel factions have established some non-combat zones for the delivery of aid. The talks are sponsored by Russia, Turkey and Iran, and Turkey’s continued rapprochement with Russia (despite backing opposing sides in Syria), which has been a major trade partner and source of tourists, may also have economic benefits.
Summary of Q117 results
The Q117 segmental results were largely ahead of our expectations. In this section we examine operational performance in each area, which is summarised in Exhibit 3, before looking at segmental revenues, costs and profits.
The biggest year-on-year change was in the derivatives market, where trading volumes increased 26% in Q117 compared with Q116. An excellent quarter with 110% growth in volume saw ISY’s market share increase to 15.4%, re-establishing the company as the market leader. Equity market trading volume increased as well, up 9.6% on Q116, and ISY again captured a greater share (7.9%, up from 7.7%). As well as benefiting from higher volumes, we understand that ISY has been able to widen its commission margins slightly, partially compensating for increased exchange costs, after two years of margin pressure.
ISY remained Turkey’s biggest issuer of debt securities with 21% (TRY5.6bn) of the total TRY27.2bn of issuance in the quarter. The private placement market in particular was strong and is expected to remain so. Other capital markets activity included an M&A deal, which had been expected to complete in the middle of the year, but which went through in Q1. The company still has a pipeline of other deals on which it is advising.
ISY’s equity margin trading continued to decline, as it has in recent quarters, and although the market actually increased in size, ISY is still market leader with a c 20% share. ISY has been able to increase its interest rates on equity margin and believes FY17 as a whole could be in line with FY16.
Turkish pension and mutual funds continue to grow in size, up 26% and 22% year-on-year to TRY65.0bn and TRY45.4bn respectively. ISY’s pension fund AUM grew 28% to TRY12.0bn and by 22% to TRY10.5bn in mutual funds. Other AUM including private assets, alternative investments and IS Investment Trust grew 57% to TRY5.5bn. ISY earns a higher fee for managing pension assets than mutual funds, so the rising share of pension fund AUM in the total will be beneficial to revenues.
Exhibit 3: Operational performance
TRYm |
ISY |
Market size |
Market share |
||||||
Performance by market area |
Q116 |
Q117 |
Y-o-y (%) |
Q116 |
Q117 |
Y-o-y (%) |
Q116 |
Q117 |
Change (pp) |
Derivatives trading (TRYbn) |
28.2 |
59.3 |
110 |
305 |
385 |
26 |
9.2% |
15.4% |
6.2 |
Equities trading (TRYbn) |
44.4 |
49.5 |
11 |
576 |
631 |
10 |
7.7% |
7.8% |
0.1 |
FX margin trading (TRYbn) |
|||||||||
debt private |
2.8 |
3.3 |
18 |
13.3 |
22.5 |
69 |
21.1% |
14.7% |
-6.4 |
debt IPOs |
2.2 |
2.3 |
5 |
7.4 |
4.7 |
(36) |
29.7% |
48.9% |
19.2 |
Debt securities issuance (TRYbn) |
5.0 |
5.6 |
12 |
20.7 |
27.2 |
31 |
24.2% |
20.6% |
-3.6 |
Equity margin trading loans o/s (TRYm) |
273 |
262 |
(4) |
941.4 |
1,190.9 |
27 |
29.0% |
22.0% |
-7.0 |
Assets under management (TRYbn) |
21.5 |
28.0 |
30 |
||||||
of which: |
|||||||||
Mutual funds |
8.6 |
10.5 |
22 |
37.3 |
45.4 |
22 |
23.1% |
23.1% |
0.1 |
Pension funds |
9.4 |
12.0 |
28 |
51.6 |
65.0 |
26 |
18.2% |
18.5% |
0.2 |
Other funds |
3.5 |
5.5 |
57 |
||||||
Source: Company data
As shown in Exhibit 4, interest and trading income increased 27% and commission revenue was up 43% in Q117 vs Q116. The strong overall growth included a contribution from FX margin trading revenue. Although new regulation has capped leverage levels in this area, reducing investor appetite and therefore ISY’s revenue from the spreads, the impact is limited because the contribution is relatively small (c TRY7m in Q117).
Exhibit 4: Revenue analysis
TRY000s |
Q116 |
Q117 |
Change (%) |
Interest and trading income |
61,654 |
78,338 |
27 |
Commission revenues |
45,376 |
64,890 |
43 |
Brokerage |
32,241 |
47,079 |
46 |
Corporate finance |
3,837 |
8,197 |
114 |
Asset management |
8,394 |
11,362 |
35 |
Other commissions |
904 |
280 |
(69) |
Total revenue* |
107,030 |
145,256 |
36 |
Source: Company data. Note: *Elements of total revenue include FX margin trading revenue, which is excluded from commission revenue. Commission revenue of TRY64,890 is net of this.
Costs increased considerably less than revenues, despite a greater sales and marketing spend. Administration cost growth was kept well below inflation. These combined to increase the gross margin from 21% to 34%.
Exhibit 5: Cost analysis
TRY000s |
Q116 |
Q117 |
Change (%) |
Marketing, sales and distribution |
20,820 |
30,927 |
49 |
General administration |
62,499 |
64,052 |
2 |
Other operating expenses |
863 |
1,007 |
17 |
Total costs |
84,182 |
95,986 |
14 |
% of revenue |
79% |
66% |
Source: Company data
At the net profit level, the factors explained above made for a very strong performance in the core investment banking business and in asset management. These more than offset losses at foreign subsidiaries, at Is Private Equity (Is PE) and Efes NPL Asset Management. Although Is PE posted a higher loss than Q116, at TRY2.3m, it was less than the run rate of c TRY5m we had previously forecast. Better security and greater political stability following the referendum may help consumer confidence (Is PE’s investments are mainly consumer-facing businesses) and our forecasts for the segment may turn out to be overly pessimistic. Efes NPL was the only segment to perform less well than we had expected in Q117: our model allows for quarterly losses of c TRY2.3m, vs the TRY3.9m reported. Both Is PE’s companies and Efes NPL have undertaken capital increases to help fund their businesses and it is expected that both will face better conditions in 2017 than in 2016.
Exhibit 6: Net profit
TRYm |
Q116 |
Q117 |
Change (%) |
Is Investment only |
29.5 |
46 |
56 |
Foreign based subsidiaries |
0.0 |
(1.7) |
|
Is Investment Trust (28.9%) |
1.8 |
1.7 |
(6) |
Is Private Equity (29.1%) |
(2.0) |
(2.3) |
15 |
Is Asset Management (70.0%) |
2.7 |
3.4 |
26 |
Efes NPL Asset Management (74%) |
(0.4) |
(3.9) |
N/M |
Elimination adjustments* |
(19.0) |
(16.0) |
(16) |
Consolidated net profit |
12.6 |
27.2 |
116 |
Source: Company data. Note: *Dividend and revenue eliminations between subsidiaries.
Changes to estimates
Exhibit 7 summarises the changes to our forecasts. We have maintained our net profit forecasts for all the consolidated segments in FY17 and FY18, but note that Efes NPL has, on a pro rata basis, underperformed our FY17 expectation of a TRY9.2m loss, while the other segments have outperformed. Maxis, Is Investment’s London subsidiary, posted a TRY1.7m loss, but we expect it to break even in the year as per our previous forecasts. The core investment banking business as a whole has considerably outperformed our expectations and achieved net profit of TRY46m in Q117, vs our forecast of TRY81m for the whole year. Having previously assumed flat revenues and some cost growth at Is Investment, we now allow for 20% revenue growth, and maintain a 75% cost/income ratio assumption. We believe this is still conservative in light of the Q1 results, and it feeds through to 13% ROE for FY17 on our estimates, up from 11.2%.
Exhibit 7: Changes to estimates
Revenue (TRYm) |
Net profit (TRYm) |
EPS (Kr) |
DPS (Kr) |
|||||||||
Old |
New |
% change |
Old |
New |
% change |
Old |
New |
% change |
Old |
New |
% change |
|
2017e |
448.0 |
508.2 |
13.4% |
66.5 |
78.5 |
18.1% |
18.7 |
22.1 |
18.1% |
12.7 |
12.7 |
0.0% |
2018e |
486.8 |
535.0 |
9.9% |
78.1 |
87.8 |
12.3% |
22.0 |
24.7 |
12.3% |
12.7 |
12.7 |
0.0% |
Source: Edison Investment Research
Valuation
ISY’s shares reacted positively to the Q1 results, rising 10% on the day of their release and recovering to the cum-dividend level at which they traded in March, meaning that a shareholder since 27 March has enjoyed a 14% total return in the last five weeks. In the absence of other investment banks with the same geographic and business profile, we compare ISY to a basket of European banks with substantial investment banking operations, as in the past. ISY continues to have the highest yield and prospective returns on equity and assets, but the lowest P/E. However, ISY is near the average in terms of price to book value.
Exhibit 8: Peer valuation
P/E (x) |
P/BV (x) |
Dividend yield (%) |
Return on equity (%) |
Return on assets (%) |
||||||
2017e |
2018e |
2017e |
2018e |
2017e |
2018e |
2017e |
2018e |
2017e |
2018e |
|
Is Yatirim |
6.2 |
5.5 |
0.8 |
0.8 |
9.3 |
9.3 |
13.0 |
13.9 |
1.2 |
1.3 |
Average |
13.5 |
11.0 |
0.8 |
0.8 |
3.1 |
3.9 |
5.8 |
7.1 |
0.3 |
0.4 |
BNP PARIBAS |
11.5 |
10.7 |
0.9 |
0.9 |
4.2 |
4.5 |
7.9 |
8.1 |
0.4 |
0.4 |
UBS |
13.1 |
12.1 |
1.2 |
1.2 |
3.7 |
4.4 |
7.9 |
9.4 |
0.4 |
0.5 |
Credit Suisse |
18.8 |
12.2 |
0.8 |
0.8 |
4.3 |
4.2 |
4.6 |
7.0 |
0.2 |
0.3 |
Société Générale |
11.7 |
10.8 |
0.8 |
0.8 |
4.3 |
4.6 |
6.7 |
6.8 |
0.3 |
0.3 |
Barclays |
10.5 |
9.0 |
0.6 |
0.6 |
1.4 |
3.5 |
5.4 |
6.7 |
0.3 |
0.6 |
Deutsche Bank |
15.6 |
10.9 |
0.5 |
0.5 |
0.7 |
2.3 |
2.2 |
4.3 |
0.1 |
0.2 |
Source: Bloomberg, Edison Investment Research. Note: Prices as at close of business on 4 May 2017.
Our ROE/COE model, using a long-term growth rate of 4% and an estimated ROE of 7% for the peers, gives a derived COE for them of 7.9%. Performing the same calculation for ISY using 5% and 13% implies a 15.4% COE, well above the peer average and Bloomberg’s calculated figure of 13.7%. Both our numbers and Bloomberg’s are also above the current ROE. A reverse ROE/COE calculation, using a 5% growth rate and the Bloomberg-calculated COE, implies that the market expects ROE of 12%, in line with our old estimates. We believe the Q1 results indicate that there is potential for higher returns in FY17 and beyond. The ROE/COE model is inherently sensitive to the input assumptions, but we note ISY’s recent good share performance, which implies that the market is encouraged by the results. Continuation of positive trading performances and relative political stability could provide the basis for a further revaluation.
Exhibit 9: Financial summary
TRYm |
2014 |
2015 |
2016 |
2017e |
2018e |
||
Year end 31 December |
IFRS |
IFRS |
IFRS |
IFRS |
IFRS |
||
PROFIT & LOSS |
|||||||
Revenue |
|
|
372.4 |
377.5 |
438.9 |
508.2 |
535.0 |
Operating expenses |
(266.5) |
(314.5) |
(355.8) |
(391.4) |
(406.4) |
||
Other income/expense (net) |
(2.1) |
(8.5) |
(24.5) |
(6.0) |
(6.0) |
||
Operating profit |
|
|
103.8 |
54.6 |
58.6 |
110.9 |
122.6 |
Share of profit of equity accounted investees |
(.3) |
(.7) |
(4.0) |
(4.0) |
(4.0) |
||
Net financials |
(3.0) |
(20.1) |
(13.0) |
12.9 |
16.3 |
||
Exceptionals |
0.0 |
0.0 |
0.0 |
0.0 |
0.0 |
||
Profit Before Tax (norm) |
|
|
100.5 |
33.7 |
41.6 |
119.8 |
134.9 |
Profit Before Tax (FRS) |
|
|
100.5 |
33.7 |
41.6 |
119.8 |
134.9 |
Tax |
(7.9) |
(11.3) |
(20.8) |
(26.5) |
(29.1) |
||
Profit After Tax (norm) |
|
|
92.6 |
22.4 |
20.8 |
93.3 |
105.8 |
Profit After Tax (FRS) |
|
|
92.6 |
22.4 |
20.8 |
93.3 |
105.8 |
Minority interest |
29.7 |
(18.1) |
(33.1) |
14.7 |
18.1 |
||
Net income (norm) |
|
|
62.9 |
40.5 |
53.9 |
78.5 |
87.8 |
Net income (FRS) |
|
|
62.9 |
40.5 |
53.9 |
78.5 |
87.8 |
Average Number of Shares Outstanding (m) |
355.0 |
355.0 |
355 |
355 |
355 |
||
EPS - normalised fully diluted (kr) |
|
|
17.7 |
11.4 |
15.2 |
22.1 |
24.7 |
EPS - IFRS (kr) |
|
|
17.7 |
11.4 |
15.2 |
22.1 |
24.7 |
Dividend per share (Kr) |
13.24 |
10.00 |
12.68 |
12.68 |
12.68 |
||
By Operating entity |
|
|
|
|
|
|
|
Is Investment Only |
44.7 |
48.3 |
87.8 |
93.1 |
97.5 |
||
Is Investment Trust (28.9%) |
7.6 |
1.7 |
5.6 |
7.1 |
7.7 |
||
Is Private Equity (29.1%) |
2.2 |
(7.3) |
(9.1) |
(8.4) |
(8.4) |
||
Is Asset Management (70.0%) |
7.9 |
9.2 |
11.6 |
15.5 |
19.5 |
||
Efes NPL Asset Management (74%) |
16.6 |
12.9 |
(17.7) |
(9.2) |
(8.9) |
||
Elimination Adjustments (B) |
(15.5) |
(18.6) |
(21.6) |
(19.6) |
(19.6) |
||
Foreign based subsidiaries |
(0.6) |
(5.7) |
(2.7) |
0.0 |
0.0 |
||
Net income |
|
|
62.9 |
40.5 |
53.9 |
78.5 |
87.8 |
BALANCE SHEET |
|||||||
Fixed Assets |
|
|
168.8 |
194.8 |
190.3 |
195.0 |
195.0 |
Intangible Assets |
61.2 |
61.4 |
57.1 |
57.1 |
57.1 |
||
Tangible Assets |
34.8 |
32.8 |
34.2 |
34.2 |
34.2 |
||
Other |
72.7 |
100.6 |
99.0 |
103.7 |
103.7 |
||
Current Assets |
|
|
5,186.4 |
5,586.4 |
6,327.6 |
6,270.4 |
6,340.0 |
Investments |
708.6 |
768.4 |
400.9 |
400.9 |
400.9 |
||
Trade receivables |
1,380.8 |
1,815.0 |
1,737.5 |
1,737.5 |
1,737.5 |
||
Cash and equivalents |
2,907.0 |
2,733.8 |
3,939.3 |
3,939.3 |
3,939.3 |
||
Other |
189.9 |
269.2 |
249.8 |
192.6 |
262.2 |
||
Total Assets |
|
|
5,355.1 |
5,781.2 |
6,517.9 |
6,465.4 |
6,535.0 |
Current Liabilities |
|
|
(4,295.0) |
(4,697.5) |
(5,427.8) |
(5,317.9) |
(5,344.7) |
Short term borrowings |
(3,140.1) |
(3,177.6) |
(3,821.6) |
(3,821.6) |
(3,821.6) |
||
Trade payables |
(981.2) |
(1,337.3) |
(1,421.4) |
(1,421.4) |
(1,421.4) |
||
Other |
(173.7) |
(182.7) |
(184.8) |
(74.9) |
(101.7) |
||
Long Term Liabilities |
|
|
(102.2) |
(175.5) |
(209.8) |
(210.0) |
(210.0) |
Long term borrowings |
(90.1) |
(140.6) |
(171.0) |
(171.0) |
(171.0) |
||
Other long term liabilities |
(12.1) |
(34.9) |
(38.8) |
(39.0) |
(39.0) |
||
Total Liabilities |
|
|
(4,397.2) |
(4,873.0) |
(5,637.6) |
(5,527.9) |
(5,554.7) |
Equity attributable to ordinary shareholders |
|
|
557.3 |
558.2 |
563.4 |
605.8 |
630.5 |
Minority interest |
|
|
400.6 |
350.0 |
316.9 |
331.6 |
349.7 |
Total shareholders' equity |
|
|
958.0 |
908.2 |
880.3 |
937.5 |
980.2 |
Number of shares at year end (m) |
|
|
355 |
355 |
355 |
355 |
355 |
NAV per share |
|
|
1.57 |
1.57 |
1.59 |
1.71 |
1.78 |
ROE |
|
|
11.3% |
7.3% |
9.6% |
13.0% |
13.9% |
ROA |
1.2% |
0.7% |
0.8% |
1.2% |
1.3% |
||
Cost/income ratio |
71.6% |
83.3% |
81.1% |
77.0% |
76.0% |
||
Tangible Equity/Assets |
17% |
15% |
13% |
14% |
14% |
||
Tax rate |
8% |
34% |
50% |
22% |
22% |
Source: Company data, Edison Investment Research
|
|
Research: Industrials
FY16 earnings showed a good step forward without much help from markets. Acquisitions played a part in this as Epwin further built out its product portfolio offering and developed its multi-channel distribution strategy. Market conditions are likely to remain subdued this year; we expect the company to redouble operational efforts to position the business for further progress, both organic and acquisitive.