Last close As at 06/08/2026
GBP1.20
▲ 0.50 (0.42%)
Market capitalisation
—
Research: Industrials
FY16 earnings showed a good step forward without much help from markets. Acquisitions played a part in this as Epwin further built out its product portfolio offering and developed its multi-channel distribution strategy. Market conditions are likely to remain subdued this year; we expect the company to redouble operational efforts to position the business for further progress, both organic and acquisitive.
Written by
Epwin Group |
Good progress, cautious outlook |
FY16 results and strategy focus |
Construction & materials |
11 May 2017 |
Share price performance
Business description
Next events
Analysts
Epwin Group is a research client of Edison Investment Research Limited |
|||||||||||||||||||||||||||||||||||||||||||||||||
FY16 earnings showed a good step forward without much help from markets. Acquisitions played a part in this as Epwin further built out its product portfolio offering and developed its multi-channel distribution strategy. Market conditions are likely to remain subdued this year; we expect the company to redouble operational efforts to position the business for further progress, both organic and acquisitive.
Year end |
Revenue (£m) |
PBT* |
EPS* |
DPS |
P/E |
Yield |
12/15** |
256.0 |
19.2 |
11.7 |
6.4 |
10.9 |
5.0 |
12/16** |
293.2 |
24.3 |
14.7 |
6.6 |
8.7 |
5.2 |
12/17e |
306.3 |
24.4 |
14.0 |
6.7 |
9.1 |
5.3 |
12/18e |
311.6 |
25.4 |
14.3 |
7.0 |
8.9 |
5.5 |
Note: *PBT and EPS (fully diluted) are normalised, excluding intangible amortisation and exceptionals. **FY15 and FY16 EPS benefited from recovered tax losses.
Acquisitions contribute to FY16 progress
FY16 results contained a 14.5% revenue increase and a 27.4% uplift in operating profit. Acquisitions (two at the end of FY15 plus National Plastics in June 2016) made a significant contribution to this outturn and existing Extrusion & Moulding operations nudged ahead also. Underlying Fabrication & Distribution operational performance was more disappointing but steps are being taken to improve this. Overall, normalised PBT was slightly below our expectations, with normalised, fully diluted EPS slightly ahead. Free cash flow was c £2m better than we had anticipated, which was also reflected in the year end net debt position (of c £21m). The year-on-year increase was attributable to the aforementioned acquisitions.
Internal strategy focus and possible acquisitions
Market commentary is cautious, especially regarding input costs, and we have reduced our normalised, fully diluted EPS estimates by 6.1% for FY17 and 8.5% for FY18, including a slower Fabrication & Distribution profit recovery. Epwin’s modest gearing position (0.6x EBITDA) and cash generation profile mean that the company has the capability to make further acquisitions to boost earnings if they become available. Ahead of this, three key internal areas for strategic focus will be capturing the group benefits of the acquired businesses to date, capitalising on the new window system launched in 2016 and putting fabrication activities onto a more robust operational footing.
Valuation: Re-establishing growth credentials
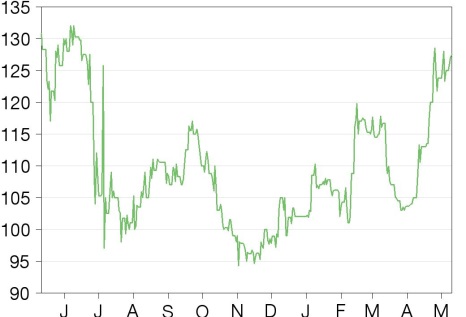
After trading much of the post-Brexit period in the 100-115p range, Epwin’s share price has picked up since the FY16 results were announced to nearer pre-Brexit levels. The company’s rating reflects the limited growth profile of revised estimates, with an FY17e P/E of 9.1x and EV/EBITDA of 5.8x. More positively, a trailing dividend yield of 5.2% (including 3.5% to come with the final, payable in May) will attract income-oriented investors. We acknowledge more moderate earnings growth but feel that the rating discount to peers is excessive and is likely to narrow.
Investment summary
Company description
Epwin supplies a range of low-maintenance exterior building products into a number of largely residential market segments in the UK. It has a vertically integrated model in window/door profiles and systems and a leading market position in roofline products. The three acquisitions made since the company’s IPO in 2014 have broadened the product offering and enhanced its distribution channel presence.
Valuation: Rating discount to peers
Market conditions are considered likely to be relatively subdued in the near term. This is reflected in our estimates for Epwin and in the market’s valuation of the company currently. Earnings multiples are low in conventional terms when compared to selected peers. Even after trimmed estimates and a recent pick up in the share price, Epwin’s FY17 P/E is still just 9.1x, with an EV/EBITDA of 5.8x. These multiples represent significant discounts to the average of peers Eurocell, Safestyle and Volution Group over all three of our forecast years in excess of 30% on a P/E basis and over 40% on EV/EBITDA. In contrast, Epwin shareholders benefit from a premium dividend yield (5.2% trailing, including 3.5% with the final) with further dividend growth anticipated.
Financials: Modest growth but strong cash credentials
Headline revenue and operating profit gains in FY16 came chiefly from acquisitions with some underlying progress in Extrusion & Moulding activities also. Epwin ended the year with c £21m net debt (up year-on-year due to the £10m cash consideration paid for National Plastics), representing 0.6x EBITDA. We have lowered our FY17 and FY18 EPS estimates by 6.1% and 8.5%, respectively, including lower expected Fabrication & Distribution profitability. We now anticipate a broadly flat PBT performance in FY17 followed by gains of c £1m pa in the following two years. Consequently, our EPS and DPS CAGRs (2016-19) are now c 0.7% and c 3.6%, respectively. Over this forecast horizon, we expect to see the cash characteristics of the group continue to translate to good (and rising) free cash flow sufficient to fund dividend growth and reduce net debt to modest levels in FY18, before moving into a net funds position in FY19. Potential further acquisitions could change this profile and Epwin has financial flexibility to accommodate such activity.
Sensitivities: Internal and external challenges
Suppliers of building products are exposed to the wider UK economic and interest rate cycles, which in turn influence construction activity levels. Epwin is primarily exposed to the residential sector and a number of sub-sectors within it. Higher input costs driven by sterling weakness is the industry-wide key challenge currently for imported/non-sterling denominated products. Internally, Epwin’s Fabrication & Distribution division has been disappointing; an improvement programme is underway and this could provide further upside though we do not anticipate a quick fix. Acquisitions have featured successfully in the last 18 months and are a stated element of strategy and Epwin has headroom for further deals. There are strong favourable industry arguments regarding higher rates of new housebuilding in the UK and, based on an ageing housing stock, healthy long-term demand for products and services that repair, maintain and/or improve (RMI) residential property. In the near term, softer consumer confidence and a slowing of other indicators (such as housing transactions and average earnings growth) is likely to result in more cautious market conditions in our view.
Company description: Developing building portfolio
Epwin is a manufacturer and supplier of a diversified range of functional exterior building products. It serves a variety of end markets via B2B channels – including an in-house distribution network – facilitated by a portfolio of developed and acquired brands.
Converting polymer materials into building products
The substitution of polymer-based building products for more traditional building materials is a well-established trend. Epwin manufactures using a number of different material types and processes and its product portfolio includes:
■
Window/door systems, cellular roofline, rainwater and drainage goods (PVC-based),
■
Dormers, porticos, canopies, roofing and ancillary lines (glass-reinforced plastic, GRP), and
■
Decking and balcony products (wood-plastic composite, WPC).
Epwin reports financial performance in two divisions with component and product manufacturing in Extrusion & Moulding, and value-added fabrication, sourcing and supply (of proprietary, in-house and third-party) products in Fabrication & Distribution.
|
Exhibit 1: Epwin FY16 £293.2m revenue split |
Exhibit 2: Epwin FY16 £27.4m EBIT split* |
|
|
|
Source: Epwin Group |
Source: Epwin Group. Note: *Before central costs. |
|
Exhibit 1: Epwin FY16 £293.2m revenue split |
|
|
Source: Epwin Group |
|
Exhibit 2: Epwin FY16 £27.4m EBIT split* |
|
|
Source: Epwin Group. Note: *Before central costs. |
Leading positions in roofline and window system manufacture have historically supported better margins in Extrusion & Moulding. Demand fluctuations in Fabrication operations together with a typically lower distributor margin have together meant a relatively low overall divisional margin. The respective capital bases of these two divisions are, of course, different. Markets are typically characterised by a small number of leading product suppliers (with competition also from other materials) but very fragmented supply chains in both fabrication and distribution.
Epwin’s strategy has been to configure and operate its manufacturing asset base (including site consolidation and investment) to efficiently balance production while at the same time building a wider market presence through brand and sales channel development. Acquisitions have added different processes, products and distribution strengths, dovetailing in with the operational and marketing approach being applied to existing business activities.
Stable management team and strategy
The Epwin board is comprised of two non-executives (ie Chairman Andrew Eastgate, NED Michael O’Leary) and three executives (CEO Jon Bednall, FD Chris Empson and Commercial Director Shaun Hanrahan). The executive team has undertaken business restructuring and a material pre-IPO merger, and has consistently pursued the above strategy in the public arena.
FY16 results overview
Epwin delivered double-digit percentage headline year-on-year revenue and operating profit progress in FY16, including acquisition effects (and in both reporting divisions). In underlying terms, further progress in Extrusion & Moulding was, we estimate, more than offset by a weaker contribution from Fabrication & Distribution. Normalised PBT was slightly below our expectations, while normalised, fully diluted EPS was slightly ahead. Free cash flow was a little better than we had anticipated; year-end net debt came in at c £21m and the increase over 2016 was more than explained by acquisition consideration.
Exhibit 3: Epwin Group interim and divisional splits
£m |
H1 |
H2 |
2015 |
H1 |
H2 |
2016 |
H1 % chg |
FY % chg |
H1 % chg |
FY % chg |
||
Reported |
Reported |
Est l-f-l |
Est l-f-l |
|||||||||
Group revenue |
124.1 |
131.9 |
256.0 |
143.3 |
149.9 |
293.2 |
15.5% |
14.5% |
0.6% |
-3.0% |
||
Extrusion & Moulding |
69.9 |
76.7 |
146.6 |
90.5 |
91.4 |
181.9 |
29.5% |
24.1% |
5.3% |
1.5% |
||
Fabrication & Distribution |
54.2 |
55.2 |
109.4 |
52.8 |
58.5 |
111.3 |
-2.6% |
1.7% |
-5.4% |
-9.0% |
||
Group operating profit |
8.0 |
12.1 |
20.1 |
11.8 |
13.8 |
25.6 |
47.5% |
27.4% |
1.3% |
-8.5% |
||
Extrusion & Moulding |
7.2 |
10.5 |
17.7 |
11.6 |
12.9 |
24.5 |
61.1% |
38.1% |
11.1% |
1.4% |
||
Fabrication & Distribution |
1.6 |
2.6 |
4.2 |
1.1 |
1.8 |
2.9 |
-31.3% |
-31.0% |
-37.5% |
-50.0% |
||
Group costs |
(0.8) |
(1.0) |
(1.8) |
(0.9) |
(0.9) |
(1.8) |
Source: Epwin Group, Edison Investment Research. Note: Percentages are approximations based on rounded figures.
Extrusion & Moulding (E&M): Primarily PVC-based window profile systems, roofline and rainwater goods extrusion activities with wood composite decking products and glass reinforced plastic building products also in the portfolio.
FY16 financial performance was largely driven by the prior year acquisitions of Ecodek and Stormking (in November and December 2015, respectively) with organic revenue and EBIT also modestly up year-on-year. Together, we estimate that the two acquisitions accounted for c 19% of divisional revenue and c 27% of EBIT in FY16. Both businesses are standalone operations; during the year they were integrated into the division and delivered year-on-year revenue and profit growth. In FY17, we expect to see increasing sales and marketing collaboration across the product range. The other Epwin businesses in this division saw a relatively strong first half, but more subdued second half performance year-on-year, though seasonally higher H2 EBIT was again in evidence. At product level, rainwater/drainage saw the strongest progress (revenue +13%) with roofline and window systems both up on the prior year. This was a creditable performance in window profile extrusion activities given the significant launch of a new system in 2016. Management states that all of its existing fabricator customers for the previous system migrated across to Optima, which is an encouraging outturn.
Fabrication & Distribution (F&D): Downstream manufacture of glass sealed units and finished windows and doors (using profiles from E&M) and multi-channel B2B distribution – including own branches – of these and other group finished products.
Epwin’s multi-brand strategy enables the supply of its range of building products through both owned and third-party outlets. The acquisition of National Plastics (in June for £10m) expanded the own branch network to c 70 locations, and it contributed £11.8m revenue and £0.8m EBIT in FY16. Excluding this, existing distribution activities saw modest revenue growth (+1% y-o-y), while fabrication had a tough year (-13%), leaving an overall underlying decline of c 9% on our estimates. There were a number of contributory factors, not least weak demand from the social housing sector but also some manufacturing and service issues for newbuild customers, which appeared to affect H2 trading. The net result was a sharply lower underlying EBIT contribution from this division, though we note some stability between H1 and H2. Management states that both highlighted sector issues have seen improvement latterly. There are plans to implement a new IT system in this division and further reorganisation is not out the question in our view. A 5% EBIT margin is the target for this division, although our estimates do not yet assume that this level is reached.
Strong cash generation and investment
Over the course of FY16, net debt rose by £6.2m to £20.6m at the end of December. This was the net result of a c £13m free cash inflow (just over £1m above the prior year) and outflows relating to the acquisition of National Plastics (c £10m) and cash dividends (c £9m). On a trailing 12-month basis, Epwin’s end FY16 net debt position was equivalent to 0.6x EBITDA.
Epwin’s profitability has a seasonal bias towards H2 with a working capital profile that has been characterised by an H1 outflow and H2 inflow. Consequently, free cash flow generation for the year substantially occurs in the second half and FY16 was no exception. Over the year as a whole, higher EBITDA net of a small investment in inventory generated trading cash flow of almost £31m, versus c £24m in FY15. Acquisition effects influenced these individual outcomes and, indeed, were also reflected in higher cash interest and tax payments (together £4.8m), with the latter amount broadly in line with the P&L charge. Over the last two years fixed capital investment has run well ahead of depreciation (cumulatively c £22m, or 1.6x depreciation). The introduction of Optima (a new window system) covering extrusion machinery, tooling and ancillary equipment is the largest project undertaken and this accounted for c £4.5m of FY16 capex, following a similar amount in the prior year. Other items include spend on IT system development for in-house fabrication operations and group-wide LED lighting investment. In aggregate, cash capex was £12.7m in FY16. As mentioned above, the net free cash flow movement taking all of these items into account was a c £13m inflow.
Cash outlook: Based on revised earnings estimates (see below) we expect to see trading cash flow continuing to trend upwards, partly offset by rising cash tax and, in FY17, higher interest costs. Maintenance capex is understood to be in the £3-4m pa range but we believe that Epwin is likely to continue to invest (at or around depreciation) where efficiency improvement projects are identified. As things stand, we project c £9m spend for FY17, which is a step down from the Optima-influenced spend of the previous two years. Consequently, FY17 free cash generation climbs to c £19m in our model. This more than covers expected deferred cash consideration (£5.3m in total) and a slightly higher dividend payout, indicating a c £4m net debt reduction by the end of FY17, with a more rapid decline thereafter in the absence of acquisitions. Subject to opportunities arising, we consider that further M&A activity is likely and with low leverage, strong interest cover ratios and headroom within existing debt facilities, Epwin clearly has the capacity to do so.
More gradual Fabrication & Distribution recovery anticipated
Management remains upbeat regarding the company’s medium- to long-term market growth characteristics. It also stated that FY17 has started in line with the company’s expectations while noting an (industry-wide) increase in input costs. Following a weaker than expected Fabrication & Distribution contribution in FY16, we have assumed a more gradual profit recovery compared to our previous estimates and this substantially explains the changes shown in Exhibit 4.
Exhibit 4: Epwin Group revised estimates
EPS – fully diluted, normalised (p) |
PBT – normalised (£m) |
EBITDA (£m) |
|||||||
Old |
New |
% chg. |
Old |
New |
% chg. |
Old |
New |
% chg. |
|
2016* |
14.0 |
14.7 |
+4.5% |
24.5 |
24.3 |
-0.9% |
33.8 |
33.3 |
-1.5% |
2017e |
14.6 |
14.0 |
-4.6% |
25.9 |
24.4 |
-5.8% |
35.5 |
34.1 |
-3.9% |
2018e |
15.6 |
14.3 |
-8.5% |
27.7 |
25.4 |
-8.1% |
36.8 |
35.3 |
-4.2% |
2019e |
N/A |
15.0 |
N/A |
N/A |
26.4 |
N/A |
N/A |
36.1 |
N/A |
Source: Edison Investment Research. Note: Normalised excludes amortisation of acquired intangibles and exceptionals. *2016 old is our pre-results estimate; new is the reported result.
FY16 EPS benefited from reclaimed tax losses; these have now been substantially utilised and, although there may be scope for further benefit, we expect Epwin’s ongoing effective rate to be nearer to the standard UK corporate tax rate.
Group development, structure and strategy
The original Epwin group merged with industry peer Latium’s comparable businesses in 2012 ahead of the enlarged company’s IPO in 2014. Since coming to the market, management has pursued a strategy of business improvement through investment, supplemented by M&A activity. We estimate that one-quarter of the c £10m (or 65%) EBIT uplift in FY16 versus FY13 has been organic with the remainder coming from three bolt-on acquisitions. The group’s stated strategy is to further develop as a broad based manufacturer of low-maintenance building products.
|
Exhibit 5: Epwin Group corporate development and business model |
|
|
Source: Epwin Group, Edison Investment Research. Note: Group central costs were £1.6m in FY13, £1.8m in FY16. |
Exhibit 5 shows that Epwin reports as two divisions defined by the functional focus of their operations. The product offering enables the company to address different B2B customer segments; Extrusion & Moulding (E&M) supplies its manufactured products to both external customers and the Fabrication & Distribution (F&D) division, which also adds value through the supply of complete systems as well as third-party products. The three key elements to group strategy are:
■
Operations – to optimise the group manufacturing footprint (six E&M locations, seven F&D) and capacity profile, and improve operational and customer service efficiency through effective investment.
■
Business and brand development – evolution of the multi-brand, multi-channel approach by migrating product lines into adjacent segments through cross-selling across the range of customer segments addressed and developing end customer pull-through.
■
Acquisitions – Epwin has made three acquisitions since its 2014 IPO, being Ecodek (November 2015), Stormking (December 2015) and National Plastics (June 2016). The first two added new products, processes and segment strengths to the group, while National Plastics increased the number of in-house distribution locations. The acquisition of additional technical capability aims to broaden the product portfolio offering and further feed into the other two key strategic drivers.
Some markers for strategic progress
The management team has expounded a consistent strategy as a quoted public entity and there are a number of tangible examples of this being put into practice, including site consolidation, new product development investment and acquisitions. For the group as currently constituted, we see four main areas in which Epwin should be aiming to demonstrate progress over the next 12-24 months.
■
Full external integration of acquisitions
The three acquisitions made in the last 18 months are now understood to be fully bedded in within the Epwin Group. Having different production processes, Ecodek (WPC extrusion) and Stormking (GRP moulding) will continue to be run as standalone facilities. Both companies are considered to have strong positions in the residential newbuild sector with the potential to develop new low-maintenance building product lines. In the near term, there should opportunities to migrate their existing ranges into other channels currently addressed by other Epwin companies. At the same time, the group is now a stronger supplier to the newbuild sector. National Plastics was not a material group customer prior to the acquisition by Epwin, so we would expect it to introduce the group’s in-house manufactured product lines in the future. Epwin’s mix of brands and distribution channels enables it to carry both proprietary and third-party product lines with limited competitive overlap.
■
Improve F&D performance
Fabrication activities have experienced a number of business challenges in the last three years. Consolidation of door manufacturing onto a single site and reducing the number of sealed glazed unit fabrication sites from three to two supported by investment are two examples of steps taken to align capacity with prevailing demand levels. Order intake variability has created fluctuations in plant activity creating additional operational efficiency issues in both fabrication and customer service. The response has been to move towards a more flexible model enabling a more even and balanced production profile. This is to be supported by a new ERP system and the objective is to achieve better overhead recovery, reduce non-standard costs and, ultimately, raise volume throughput.
■
Capture benefits of a new window system
In order to serve different market segments, Epwin’s E&M division has three separate window profile systems: Optima, Swish and Spectus. The former system – including new extrusion lines and tooling in Telford – was launched in spring 2016 and has been progressively rolled out across all of the fabricators who used the previous Profile 22 system. With the need to run down inventory and processes related to Profile 22 and at the same time migrate customers onto a new fabrication set up, there will have been a degree of operational caution during FY16. With full marketing support, more efficient extrusion lines and reduced SKUs, good volume pull-through should translate to improved financial performance in FY17 and beyond.
■
Application of capital to enhance shareholder returns
In FY16, Epwin’s average ROCE was c 20%, well in excess of a cost of capital of c 8%. (We estimate that the full year returns generated by Stormking and Ecodek were in the region of 16-18%.) Bearing in mind that this was after a disappointing F&D performance, we believe that there is potential to further improve group returns. Net debt to EBITDA for FY16 was 0.6x and given that the company is strongly cash generative, we expect it to have minimal gearing by the end of FY18 on current estimates. With c £60m banking facilities currently in place (including a revolving credit facility [RCF] and a reducing term loan to 2019), the company has significant flexibility for investment in the business through both organic and acquisitive means. Subject to progress in earnings, we believe that the scope for above-average dividend growth could be significant.
Sensitivities
As a supplier of building products, Epwin is exposed to the wider UK economic and interest rate cycles as well as construction activity with a number of different drivers across multiple, primarily residential, sub sectors. For the last four years or so, new housebuilding has been relatively buoyant, while RMI spending has been patchy but flat/modestly growing overall and social housing has endured lower activity levels, especially in the last couple of years. Epwin’s group revenue profile split is approximately 70% RMI, 20% new housebuilding and c 10% social housing.
Company level considerations
In our opinion, higher input costs arising from the downward adjustment to sterling following the Brexit result in June 2016 are an industry-wide key challenge currently. This will have started to have an impact in Q417 and Epwin will have adjusted pricing strategies to pass through increases. The impact of higher pricing on end market volumes is yet to be seen fully. Notwithstanding prevailing market conditions, Epwin has a number of opportunities to improve group returns, as outlined in the previous section. In particular, the risk of developing and launching a new window system (ie Optima) has significantly receded in our view, which should enable a more front foot marketing effort. Also, while there does not appear to be a single quick restructuring fix for F&D, operational improvements should generate incremental profit and margin gains. Thus far, Epwin’s three acquisitions have bedded into the group well and National Plastics will contribute an additional five months’ revenue and profitability in FY17. Lastly, we note that Epwin does not operate a defined benefit pension scheme nor, therefore, a balance sheet retirement benefit deficit or need to make additional cash contributions into its defined contribution scheme.
Changing market conditions may favour RMI
UK consumer confidence recovered well from 2012 to 2015 against a backdrop of low unemployment levels, low interest rates and rising house prices with some real average income growth. It ended 2016 slightly weaker than a year earlier but did improve from a post Brexit dip. Slower house price growth, slowing transactions and a pick-up in inflation have likely contributed to wider consumer caution. Rising unsecured personal debt and a low savings ratio are potential future risks as and when the UK interest cycle begins to increase from historically low levels.
The UK government is attempting to increase the rate of new housebuilding and its February white paper contained a number of proposals addressing the perceived obstacles to doing so. Population growth (including net migration) and increases in household formation will continue to place upward pressure on the demand for new homes and Epwin has the opportunity to increase its penetration of this segment and increase the volume pull-through for its manufacturing operations.
The c 28m existing UK housing stock has an ageing profile, suggesting increasing ongoing maintenance requirements. The substitution of traditional building materials for more modern, lower-maintenance products should also lead to increasing penetration in the RMI market. Moreover, the installation of first-generation PVC widow systems peaked in the 1980s and their replacement should also support market demand. Given a less certain overall market outlook, one would expect there to be more impetus for existing home owners to improve rather than move, though budget constraints may still influence overall activity levels.
Strategic acquisition opportunities
Epwin has good market shares in roofline/window trim but other product segments are typically more fragmented, which create potential organic and acquisition growth opportunities. The acquisitions secured to date have had a clear fit within the group portfolio and have generated good returns. The scale, timing, fit and valuation of any future acquisitions is obviously indeterminate at this stage and their impact in a group context will be evaluated once announced.
Valuation
As referenced elsewhere, Epwin Group has delivered a strong uplift in profit and earnings since its IPO in 2014. This is despite lacklustre demand from the important UK residential RMI sector during this time as well as some weakness in the smaller social housing (newbuild and RMI) segment. While longer-term industry characteristics remain supportive, market conditions are not expected to change materially in the near term. This is reflected in our estimates, which show three-year 2016-19 CAGRs for EPS of 0.7% and 3.6% for DPS. Consequently, earnings multiples are low by convention while offering income investors a prospective 5.3% dividend yield (over twice covered).
Established building materials supplier, stable business model
Epwin is a significant manufacturer and distributor of building products with a material presence in established construction market channels and has annualised revenue and EBIT of c £300m and £26m, respectively. The company’s earnings and cash characteristics have been very consistent since IPO with growth seen in the absolute levels generated.
Stable model generates cash and supports healthy dividend
Looking at earnings and cash multiples first, the FY17e P/E currently sits at just 9.1x on an admittedly flat earnings outlook for the current year and, on the same basis, EV/EBITDA is 5.8x. (Note that there are no additional pensions or deficit recovery cash contributions required.) We estimate that Epwin generated an ROCE of c 20% in FY16; given company model and market stability, we would expect to see these characteristics to continue to translate to good cash generation. Specifically, we project a free cash flow yield for the company of c 10% for FY17, rising thereafter. This in turn supports a healthy dividend payout, which has run at c 50% of normalised post tax earnings since IPO. The trailing dividend yield is c 5.2% currently (including c 3.5% with the final) – which is well above the market average – and we expect modest DPS progress in FY17 and beyond. For the record, Epwin’s NAV per share was 64p at the end of FY16.
Trading on material peer earnings discounts and yield premium
We believe that our estimates are in line with consensus. Benchmarking some of the above valuation criteria against other UK residential RMI oriented peers (as shown in Exhibit 6), we note the following:
■
Epwin is trading on 30%+ and 40%+ P/E and EV/EBITDA discounts to the three peers shown across all three forecast years.
■
Epwin offers a 60-70% dividend yield premium.
Exhibit 6: Peer comparison table
Year end |
Price |
Market cap |
P/E (x) |
EV/EBITDA (x) |
Dividend yield (%) |
||||||||||||
p |
£m |
2016 |
2017e |
2018e |
2019e |
2016 |
2017e |
2018e |
2019e |
2016 |
2017e |
2018e |
2019e |
||||
Epwin Group |
Dec |
124.5 |
178 |
8.5 |
8.9 |
8.7 |
8.3 |
5.9 |
5.7 |
5.2 |
4.8 |
5.3 |
5.4 |
5.6 |
5.9 |
||
Eurocell* |
Dec |
258.8 |
259 |
11.8 |
11.8 |
10.9 |
10.3 |
7.7 |
7.7 |
7.3 |
7.0 |
3.5 |
3.5 |
3.9 |
4.2 |
||
Safestyle UK* |
Dec |
314.8 |
265 |
15.6 |
14.8 |
13.9 |
13.0 |
12.3 |
10.7 |
9.7 |
8.8 |
4.0 |
4.0 |
4.3 |
4.6 |
||
Volution Group* |
July* |
197.3 |
396 |
17.8 |
14.3 |
13.5 |
12.9 |
11.8 |
10.6 |
9.8 |
8.9 |
2.3 |
2.2 |
2.3 |
2.4 |
||
|
|||||||||||||||||
Average |
13.4 |
12.4 |
11.8 |
11.1 |
9.5 |
8.7 |
8.0 |
7.4 |
3.8 |
3.8 |
4.0 |
4.3 |
|||||
Average ex Epwin |
15.1 |
13.6 |
12.8 |
12.0 |
10.6 |
9.7 |
8.9 |
8.2 |
3.3 |
3.2 |
3.5 |
3.7 |
|||||
Source: *Bloomberg estimates, Edison Investment Research. Note: Volution calendarised. Prices as at 8 May.
Financials
Since its IPO in July 2014, Epwin has increased EBIT by over 60% and EPS by almost 50% (FY16 versus FY13). We estimate that around one-quarter of the EBIT increase over this time period has been generated organically and around three-quarters from acquisitions. Net debt is c £1m above the H113 level; this is the net result of:
■
Cash inflows c £48m: £10m new equity on IPO + c £38m cumulative free cash flow (NB this is after c £24m capex, equivalent to 1.5x depreciation over the two and a half year period), and
■
Cash outflows c £49m: including c £31m cash acquisition consideration and c £18m cumulative cash dividends paid since IPO.
At the end of FY16, net debt of £20.6m represented 0.6x trailing 12-month EBITDA (slightly lower on an annualised acquisition contribution basis). On our revised estimates, Epwin’s CAGRs (2016-19) are c 0.7% for EPS and c 3.6% for DPS.
Modest underlying revenue and EBIT margin progress
Construction industry estimates are for modest overall growth in UK residential spending, with ongoing progress in new house building and ongoing flat RMI activity. In FY17, Epwin will benefit from the full year effect of National Plastics (acquired mid 2016); excluding this, we have factored in just under 2% underlying revenue growth, which will include an element of rising input price pass through. The latter will inhibit margin development to some extent and we assume that the underlying EBIT increase is broadly in line with that for revenue. A more normal tax charge together with deferred consideration effects (ie net interest and more shares in issue) is likely to hold normalised EPS around the FY16 level in our view. Beyond FY17, we have modelled:
■
Revenue + c 1.7% pa,
■
EBIT rising slightly ahead of revenue, with modest EBIT margin increases, and
■
Net interest starting to trend down reflecting underlying cash generation.
The net result of these factors is normalised PBT increases by c £1m pa in FY18 and FY19. No further acquisition activity is factored in at this stage though this remains a realistic possibility and part of the stated company strategy.
Solid cash flow characteristics to drive net debt lower
The cash characteristics of the group are reasonably well established now in the public quoted arena. We expect trading cash flow to trend upwards with incremental EBIT (and depreciation) increases only partly offset by modest working capital absorption reflecting top line growth. Following the completion of the new Optima window system rollout in FY16, we currently expect capex to step down in our estimates, nearer to depreciation but well above the c £3-4m pa maintenance level. Notwithstanding a rising cash tax payment (in line with the P&L charge), the lower capex run rate will then feed into a stronger free cash flow (FCF) performance. Below this, £5.3m deferred cash consideration and a rising cash dividend payout (covered c 2x by FCF) are the key non-trading discretionary items currently anticipated. Consequently, net debt looks set to reduce further and move towards a modestly geared position by the end of FY18 on our estimates. Given that Epwin has a £35m RCF and a £20m term loan outstanding (reducing at c £5m pa), both out to 2019, there is clearly scope to accommodate further bolt-on acquisitions within existing funding arrangements.
Acquisition effects reflected in balance sheet movements
Other than the acquisition impact of National Plastics in FY16 (and the Stormking and Ecodek deferred consideration to be paid in FY17), there are no other balance sheet movements of note.
Exhibit 7: Financial summary
£m's |
2012 |
2013 |
2014 |
2015 |
2016 |
2017e |
2018e |
2019e |
||
December |
IFRS |
IFRS |
IFRS |
IFRS |
IFRS |
IFRS |
IFRS |
IFRS |
||
PROFIT & LOSS |
|
|
|
Restated |
|
|
|
|
|
|
Revenue |
|
|
294.4 |
255.3 |
259.5 |
256.0 |
293.2 |
306.3 |
311.6 |
317.3 |
Cost of Sales |
|
|
(209.9) |
(185.8) |
(186.7) |
(178.6) |
(200.6) |
(208.3) |
(211.9) |
(215.8) |
Gross Profit |
|
|
84.5 |
69.5 |
72.8 |
77.4 |
92.6 |
98.0 |
99.7 |
101.5 |
EBITDA |
|
|
21.8 |
21.4 |
24.5 |
25.6 |
33.3 |
34.1 |
35.2 |
36.0 |
Operating Profit (before GW and except.) |
15.4 |
15.6 |
19.5 |
20.1 |
25.6 |
25.9 |
26.7 |
27.3 |
||
Intangible Amortisation |
|
|
(1.7) |
(1.7) |
(1.7) |
(0.0) |
(1.1) |
(1.3) |
(1.3) |
(1.3) |
Exceptionals |
|
|
(4.3) |
(5.1) |
2.3 |
(0.6) |
(0.2) |
0.0 |
0.0 |
0.0 |
Other |
|
|
0.0 |
0.0 |
(0.8) |
(0.4) |
(0.3) |
(0.3) |
(0.3) |
(0.3) |
Operating Profit |
|
|
9.4 |
8.8 |
19.3 |
19.1 |
24.0 |
24.3 |
25.1 |
25.7 |
Net Interest |
|
|
(1.9) |
(1.0) |
(0.7) |
(0.5) |
(1.0) |
(1.2) |
(1.0) |
(0.6) |
Profit Before Tax (norm) |
|
|
13.5 |
14.6 |
18.0 |
19.2 |
24.3 |
24.4 |
25.4 |
26.4 |
Profit Before Tax (FRS 3) |
|
|
7.5 |
7.9 |
18.6 |
18.6 |
23.0 |
23.1 |
24.1 |
25.1 |
Tax |
|
|
(2.2) |
(1.3) |
(3.5) |
(3.3) |
(3.4) |
(4.4) |
(4.8) |
(4.7) |
Profit After Tax (norm) |
|
|
10.4 |
12.4 |
14.4 |
15.9 |
20.9 |
20.0 |
20.6 |
21.6 |
Profit After Tax (FRS 3) |
|
|
4.5 |
5.1 |
15.1 |
15.3 |
19.6 |
18.7 |
19.3 |
20.3 |
|
|
|
|
|
|
|
|
|
|
|
Average Number of Shares Outstanding (m) |
|
122.3 |
122.3 |
128.0 |
135.2 |
141.5 |
142.4 |
143.2 |
143.2 |
|
EPS – normalised* (p) |
|
|
8.5 |
10.1 |
11.2 |
11.8 |
14.8 |
14.1 |
14.4 |
15.1 |
EPS – normalised* (p) FD |
|
|
|
|
11.2 |
11.7 |
14.7 |
14.0 |
14.3 |
15.0 |
EPS - FRS 3* (p) |
|
|
3.7 |
4.2 |
11.8 |
11.3 |
13.8 |
13.1 |
13.5 |
14.2 |
Dividend per share (p) |
|
|
0.0 |
0.0 |
4.2 |
6.4 |
6.6 |
6.7 |
7.0 |
7.4 |
|
|
|
|
|
|
|
|
|
|
|
Gross Margin (%) |
|
|
28.7 |
27.2 |
28.1 |
30.2 |
31.6 |
32.0 |
32.0 |
32.0 |
EBITDA Margin (%) |
|
|
7.4 |
8.4 |
9.4 |
10.0 |
11.3 |
11.1 |
11.3 |
11.3 |
Operating Margin (before GW and except.) (%) |
5.2 |
6.1 |
7.5 |
7.9 |
8.7 |
8.5 |
8.6 |
8.6 |
||
|
|
|
|
|
|
|
|
|
|
|
BALANCE SHEET |
|
|
|
|
|
|
|
|
|
|
Fixed Assets |
|
|
56.9 |
54.7 |
53.8 |
93.5 |
108.5 |
112.8 |
111.5 |
110.0 |
Intangible Assets |
|
|
27.9 |
26.4 |
24.7 |
59.7 |
70.2 |
74.2 |
72.9 |
71.6 |
Tangible Assets |
|
|
26.1 |
25.1 |
26.2 |
33.1 |
37.9 |
38.2 |
38.3 |
38.1 |
Other |
|
|
2.8 |
3.2 |
2.9 |
0.7 |
0.4 |
0.4 |
0.4 |
0.4 |
Current Assets |
|
|
59.9 |
62.1 |
62.3 |
87.2 |
82.6 |
73.1 |
80.5 |
83.9 |
Stocks |
|
|
20.9 |
21.7 |
22.4 |
23.6 |
28.2 |
29.3 |
29.8 |
30.3 |
Debtors |
|
|
37.4 |
40.1 |
37.6 |
41.5 |
41.4 |
43.0 |
43.7 |
44.4 |
Cash |
|
|
1.6 |
0.3 |
2.3 |
22.1 |
13.0 |
0.8 |
7.1 |
9.2 |
Current Liabilities |
|
|
(53.2) |
(54.5) |
(49.0) |
(68.8) |
(79.2) |
(65.8) |
(67.4) |
(63.9) |
Creditors |
|
|
(49.1) |
(51.5) |
(48.6) |
(53.2) |
(62.9) |
(60.8) |
(62.4) |
(63.9) |
Short term borrowings |
|
|
(4.1) |
(3.0) |
(0.4) |
(15.6) |
(16.3) |
(5.0) |
(5.0) |
0.0 |
Long Term Liabilities |
|
|
(32.0) |
(25.7) |
(4.3) |
(31.8) |
(21.0) |
(16.0) |
(11.0) |
(6.0) |
Long term borrowings |
|
|
(20.6) |
(16.0) |
(0.8) |
(20.9) |
(17.3) |
(12.3) |
(7.3) |
(2.3) |
Other long term liabilities |
|
|
(11.4) |
(9.7) |
(3.5) |
(10.9) |
(3.7) |
(3.7) |
(3.7) |
(3.7) |
Net Assets |
|
|
31.5 |
36.6 |
62.8 |
80.1 |
90.9 |
104.1 |
113.7 |
124.0 |
|
|
|
|
|
|
|
|
|
|
|
CASH FLOW |
|
|
|
|
|
|
|
|
|
|
Operating Cash Flow |
|
|
15.7 |
12.1 |
19.8 |
23.8 |
30.8 |
32.8 |
34.6 |
35.4 |
Net Interest |
|
|
(1.4) |
(0.9) |
(0.7) |
(0.5) |
(1.0) |
(1.2) |
(0.9) |
(0.6) |
Tax |
|
|
(1.6) |
(0.9) |
(1.7) |
(2.3) |
(3.8) |
(3.9) |
(4.3) |
(4.2) |
Capex |
|
|
(4.6) |
(4.9) |
(5.6) |
(9.0) |
(12.7) |
(9.0) |
(8.5) |
(8.5) |
Acquisitions/disposals |
|
|
(28.2) |
(0.2) |
0.0 |
(20.9) |
(10.2) |
(5.3) |
0.0 |
0.0 |
Financing |
|
|
0.0 |
0.0 |
10.0 |
0.0 |
0.0 |
0.0 |
0.0 |
0.0 |
Dividends |
|
|
0.0 |
0.0 |
(1.9) |
(6.7) |
(9.1) |
(9.4) |
(9.7) |
(10.0) |
Net Cash Flow |
|
|
(20.2) |
5.2 |
19.9 |
(15.6) |
(6.1) |
4.1 |
11.3 |
12.1 |
Opening net debt/(cash) |
|
|
0.5 |
23.2 |
18.7 |
(1.1) |
14.4 |
20.6 |
16.5 |
5.2 |
HP finance leases initiated |
|
|
(2.5) |
(0.5) |
(0.3) |
0.4 |
1.9 |
0.0 |
0.0 |
0.0 |
Other |
|
|
0.0 |
(0.1) |
0.2 |
(0.3) |
(2.1) |
0.0 |
0.0 |
0.0 |
Closing net debt/(cash) |
|
|
23.2 |
18.6 |
(1.1) |
14.4 |
20.6 |
16.5 |
5.2 |
(6.9) |
Source: Company accounts, Edison Investment Research. *FY13 to FY16 EPS benefited in part from recovered tax losses.
|
|||||||||||||||||||||||||||||||||||||||||||||||||||
|
|
Good Energy’s unique equity proposition is its combination of renewable generation capacity with a growing retail energy business. All energy sold to customers is sourced from renewable sources, with approximately 19% generated by its own solar and wind farms and the remainder procured via long-term contracts from third-party renewable generators. The stock is attractively valued in comparison to its forecast high level of growth.