Last close As at 05/08/2026
NZD4.75
▲ −0.03 (−0.63%)
Market capitalisation
NZD499m
Research: Healthcare
AFT Pharmaceuticals
Written by
AFT Pharmaceuticals |
Manufacturing bumps mask global demand |
Earnings update |
Pharma & biotech |
5 December 2016 |
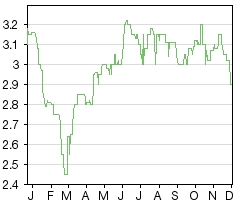
Share price performance
Business description
Next events
Analysts
AFT Pharmaceuticals is a research client of Edison Investment Research Limited |
|||||||||||||||||||||||||||||||||||||||||||||||||
AFT reported H117 results on 24 November 2016, which marked a slowdown in its previously aggressive growth in preceding periods, largely due to supply issues and a slowdown in demand in New Zealand (NZ$13.5m sales). Despite this, supply issues with partners appear to be resolved, as underlying demand in Australia increased 17% (NZ$14.6m sales), and the demand for Maxigesic in Europe and the Middle East exceeds the expectations of licensing partners (NZ$1.2m sales).
Year end |
Revenue (NZ$m) |
PBT* |
EPS* |
DPS |
P/E |
Yield |
3/15 |
56.2 |
(11.4) |
(9.46) |
0.0 |
N/A |
N/A |
3/16 |
64.0 |
(10.8) |
(0.39) |
0.0 |
N/A |
N/A |
3/17e |
70.4 |
(14.3) |
(0.52) |
0.0 |
N/A |
N/A |
3/18e |
99.1 |
0.3 |
0.01 |
0.0 |
290 |
N/A |
Note: *PBT and EPS are normalised, excluding amortisation of acquired intangibles, exceptional items and share-based payments.
Revenue flat y-o-y due to manufacturing bumps
Revenue for the first half of FY17 was NZ$29.8m, or a 0.8% increase year-on-year. The slowdown in growth was due to disruption in the supply of two products, one in Australia and one in New Zealand, which had negative impacts on sales of 11% and 4% respectively. This was compounded by a reduction in demand in the pharmacy market as a whole of an estimated 4-8%, likely due to seasonal variability.
Demand up globally
Outside New Zealand, the underlying demand for AFT products is growing significantly. Australian demand is up 17%, and sales of Maxigesic (NZ$1.2m) from licensing partners in Europe and the Middle East is up 181%. Demand has been high enough for the Italian partner to run out of stock and for the UK partner to delay the launch because of a higher than expected number of orders.
R&D programmes advance
AFT increased R&D spending 77% to NZ$4.28m during the period to support the clinical study of the NasoSURF nebulizer and the IV formulation of Maxigesic. Maxigesic IV is now in Phase III clinical studies (n=275) in the US for the reduction in pain following bunionectomy with results expected in CY17. NasoSURF is in biodistribution studies expected to be completed by the end of the fiscal year, and AFT is planning to submit a class I device application by the end of 2016.
Valuation: NZ$461m or NZ$4.76 per share
We are increasing our valuation to NZ$461m or NZ$4.76 per share from NZ$458m or NZ$4.73 per share. We have reduced our FY17 revenue projection to NZ$72.5m (including grants and licensing revenue) from NZ$77.4m with some carry-forward in later years, but the effect of this reduction is offset by advancing our NPVs to the most recent period. We expect to update our valuation following clinical results from the NasoSURF and Maxigesic IV clinical studies.
The bumpy road to world domination
AFT Pharmaceuticals is a specialty pharmaceutical company with over 130 prescription, over the counter and hospital products across an array of indications. In recent years, it has been involved in the international launch of a series of products outside of its home territory in New Zealand. It has successfully built a commercial infrastructure in Australia where the market for its products continues to grow. It is currently in the early stages of a launch across South-East Asia, and has recently signed multiple out-licensing partners across Europe and the Middle East. The company’s lead product is Maxigesic, a co-formulation of acetaminophen and ibuprofen at a specific ratio (3.3 to 1) that has been clinically proven to increase potency. AFT is using Maxigesic as its flagship product for international expansion and it currently accounts for the majority of overseas revenue.
AFT recently reported operating revenue of NZ$29.8m for the first half of FY17, ending on 30 September. This marks a 0.8% increase over the same period of FY16. The loss for the period was NZ$11.0m, compared to an H116 loss of NZ$5.8m.
Supply issues slow growth in Australia and New Zealand
The company encountered manufacturing issues affecting supply in first half of FY17. It previously announced that the supply of Metoprolol in New Zealand had been affected by a global shortage of the drug and this negatively affected sales by 4% for the period. AFT also announced in interim reports that Australian sales were down 11% due to the manufacturing shortfall of an undisclosed product, which marks the second period in a row that the company has released details of manufacturing issues limiting supply in Australia. The supply will hopefully be resolved shortly as an additional factory has been dedicated to the product and is currently fully operational.
Australian demand up, offsetting lower NZ demand
Manufacturing issues aside, the demand for AFT products was up 17% in Australia (net 6% increase in sales after supply offset, NZ$14.6m). The company attributed this increase in demand to a combination of advertising efforts and the recent launch of four new products. Maxigesic was rescheduled in Australia in FY16 from the “Pharmacist” designation to “Pharmacy”, which allows the drug to be displayed in the store and permits advertising. The advertising campaign for the product started in late August, just a month before the end of the period, and we expect it to translate into significant sales increases in the coming periods. Originally, sales of drugs containing codeine were due for rescheduling in mid-2016, but this decision was delayed and expected around the end of the calendar year. Currently, codeine is scheduled as a Pharmacy drug, and increased restrictions on its sales could positively affect competing products such as Maxigesic. The rescheduling of pain medications can have a dramatic impact on their market. For instance, the rescheduling of hydrocodone products in the US from schedule 3 to schedule 2 resulted in a 22% reduction in prescriptions.1 The company estimates a market for codeine containing drugs of A$150m based on IMS data. The remaining revenue growth in the Australian market was driven by the continued growth in the sales of Crystaderm, RestoraNail, ZoRub and Myconail, which were launched in FY16.
Unfortunately, demand in New Zealand appears to be moving in the opposite direction. The company reported a 6% decline in demand corresponding to a total decline of 10% for the period (NZ$13.5m). The reduction in demand was attributable to an estimated decrease in the broader pharmacy market of 4% to 8%. The reason for the market pullback is difficult to determine but may be due to a milder than usual cold and flu season. However, despite this, the demand for Maxigesic far outstripped the market effects and increased 18% year-on-year. Maxigesic remains a small portion of New Zealand sales (approximately 5%), but the increasing demand for this product in both Australia and New Zealand speaks to the strength of the brand.
Maxigesic drives overseas growth
The company reported NZ$1.2m in revenue from overseas licensees, which is a 181% increase over H116 and greater than the total for all of that year. The majority of the revenue was from licensees in Italy and the UAE, and these partners as well as those in the UK reported a faster than expected ramp in sales. This degree of demand is not without some supply chain hiccups: the Italian partner ran out of supply of the drug and the UK launch was delayed because initial orders were higher than projected at the time. The product is licensed for sale in 111 countries, eight of which have launched. We expect overseas sales of Maxigesic to be the primary growth driver in FY18 and onward.
Spending driven by increase in R&D
The company reported operational spending of NZ$20.0m for the period, an increase of 31% compared to H116 (NZ$15.2m). This increase was driven in part by the increased marketing efforts in Australia as well as a 77% increase in R&D spending (to NZ$4.28m). The company is currently developing an iv formulation of Maxigesic for surgical markets as well as the NasoSURF Nebulizer, a nasal drug delivery device.
AFT has filed an IND for Maxigesic IV and initiated a Phase III study of the drug for post-surgical pain following bunionectomy at two clinical sites in the US. The trial has targeted enrolment of 275 patients who will be split between four arms: Maxigesic, acetaminophen, ibuprofen and placebo. The endpoint for the trial will be the Summer Pain Intensity Difference (SPID) over the 48 hours post-surgery. We expect the study to be complete in mid-calendar year 2017. We also expect that the FDA will require a soft tissue surgery trial to support the broad label of post-surgical pain relief, although this will likely be similar in terms of scope and expense for the company.
The NasoSURF clinical programme has also been progressing, and the first clinical results of biodistribution studies in patients and healthy volunteers are expected by the end of FY17. AFT received a class I designation for the nebulizer in November 2016, which will exempt the nebulizer machine itself from clinical trials, although further studies will be needed to support marketing of individual drugs for use in the device. The company intends to move forward with conscious sedation as the primary indication, with pharmacokinetic studies in 2017.
Valuation
We are increasing our DCF valuation to NZ$461m or NZ$4.76 per share, from NZ$458m or NZ$4.73 per share. Our model builds to sales of approximately NZ$282m by FY26, down from NZ$285m previously. We calculate EBIT margins of 34% and we model terminal sales with a margin of 34% (including other operating income). We assume a terminal growth rate of 2% and use a WACC of 10.0%. The reduction in our sales estimates and the impact of lower net cash were entirely offset by advancing our DCF to the current reporting period, an effect of NZ$0.23 per share. We expect to update our valuation with the results from the NasoSURF and Maxigesic IV clinical studies and with further business development activity.
Exhibit 1: DCF sensitivity table (NZ$)
Terminal EBIT margin |
|||||
Terminal revenue growth |
15% |
25% |
34% |
38% |
42% |
-2% |
2.28 |
3.00 |
3.65 |
3.93 |
4.22 |
-1% |
2.36 |
3.15 |
3.85 |
4.16 |
4.48 |
0% |
2.46 |
3.32 |
4.09 |
4.44 |
4.78 |
1% |
2.57 |
3.53 |
4.39 |
4.78 |
5.16 |
2% |
2.72 |
3.80 |
4.76 |
5.20 |
5.63 |
3% |
2.91 |
4.14 |
5.24 |
5.73 |
6.23 |
4% |
3.16 |
4.59 |
5.88 |
6.45 |
7.03 |
5% |
3.51 |
5.22 |
6.77 |
7.46 |
8.14 |
Source: Edison Investment Research
Financials
We have reduced our FY17 sales forecasts in light of the recent commercial setbacks to NZ$70.4m (NZ$72.5m including grants and licensing revenue) from a previous estimate of NZ$77.4m. Although we expect some carryover into future years, we believe the manufacturing issues are resolvable and that growth attributable to overseas Maxigesic sales will far outpace any recent adjustments. We forecast FY18 sales of NZ$99.1m, down from NZ$105.4m. Spending was largely in line with estimates and we have not made any adjustments. We predict an FY17 EPS loss of NZ$0.52 down from previous estimates of NZ$0.40, but we expect the company to break even in FY18 with EPS of NZ$0.01. The company ended the period with NZ$16.1m in cash and NZ$22.0m in debt, and we expect current liquidity to be sufficient to reach profitability.
Exhibit 2: Financial summary
NZ$000 |
2014 |
2015 |
2016 |
2017e |
2018e |
2019e |
2020e |
||
Year end March |
NZ GAAP |
NZ GAAP |
NZ GAAP |
NZ GAAP |
NZ GAAP |
NZ GAAP |
NZ GAAP |
||
PROFIT & LOSS |
|||||||||
Revenue |
|
|
48,939 |
56,241 |
64,014 |
70,415 |
99,113 |
126,219 |
151,885 |
Cost of Sales |
(28,609) |
(35,083) |
(40,435) |
(41,926) |
(50,261) |
(58,052) |
(65,367) |
||
Gross Profit |
20,330 |
21,158 |
23,579 |
28,490 |
48,852 |
68,168 |
86,518 |
||
EBITDA |
|
|
(341) |
(9,659) |
(7,821) |
(11,588) |
2,134 |
17,241 |
30,372 |
Operating Profit (before amort. and except.) |
(201) |
(9,530) |
(7,667) |
(11,434) |
2,288 |
17,395 |
30,526 |
||
Intangible Amortisation |
82 |
99 |
114 |
114 |
114 |
114 |
114 |
||
Exceptionals |
0 |
0 |
0 |
0 |
0 |
0 |
0 |
||
Other |
1,594 |
(546) |
(618) |
834 |
2,199 |
2,310 |
2,427 |
||
Operating Profit |
1,475 |
(9,977) |
(8,171) |
(10,487) |
4,601 |
19,820 |
33,067 |
||
Net Interest |
(963) |
(1,908) |
(3,145) |
(2,829) |
(2,000) |
(2,000) |
0 |
||
Profit Before Tax (norm) |
|
|
(1,164) |
(11,438) |
(10,812) |
(14,263) |
288 |
15,395 |
30,526 |
Profit Before Tax (reported) |
|
|
512 |
(11,885) |
(11,316) |
(13,316) |
2,601 |
17,820 |
33,067 |
Tax |
59 |
282 |
42 |
(100) |
(112) |
(4,343) |
(8,579) |
||
Profit After Tax (norm) |
(1,105) |
(11,156) |
(10,770) |
(14,362) |
177 |
11,056 |
21,951 |
||
Profit After Tax (reported) |
571 |
(11,603) |
(11,274) |
(13,416) |
2,488 |
13,477 |
24,488 |
||
Average Number of Shares Outstanding (m) |
1.2 |
1.2 |
27.6 |
27.6 |
27.6 |
27.6 |
27.6 |
||
EPS - normalised (NZ$) |
|
|
(0.94) |
(9.46) |
(0.39) |
(0.52) |
0.01 |
0.40 |
0.80 |
EPS - normalised fully diluted (NZ$) |
|
(0.94) |
(9.46) |
(0.39) |
(0.52) |
0.01 |
0.40 |
0.80 |
|
EPS - (reported) (NZ$) |
|
|
0.48 |
(9.84) |
(0.41) |
(0.49) |
0.09 |
0.49 |
0.89 |
Dividend per share (NZ$) |
0.00 |
0.00 |
0.00 |
0.00 |
0.00 |
0.00 |
0.00 |
||
Gross Margin (%) |
41.5 |
37.6 |
36.8 |
40.5 |
49.3 |
54.0 |
57.0 |
||
EBITDA Margin (%) |
N/A |
N/A |
N/A |
N/A |
2.2 |
13.7 |
20.0 |
||
Operating Margin (before GW and except.) (%) |
N/A |
N/A |
N/A |
N/A |
2.3 |
13.8 |
20.1 |
||
BALANCE SHEET |
|||||||||
Fixed Assets |
|
|
1,824 |
2,488 |
3,249 |
3,681 |
4,167 |
4,708 |
5,299 |
Intangible Assets |
1,419 |
1,669 |
2,111 |
2,399 |
2,687 |
2,975 |
3,263 |
||
Tangible Assets |
405 |
411 |
407 |
551 |
749 |
1,002 |
1,305 |
||
Investments |
0 |
408 |
731 |
731 |
731 |
731 |
731 |
||
Current Assets |
|
|
23,569 |
30,725 |
62,055 |
46,445 |
48,387 |
61,013 |
72,779 |
Stocks |
12,654 |
14,686 |
17,686 |
18,248 |
21,876 |
25,267 |
28,451 |
||
Debtors |
9,558 |
11,251 |
16,288 |
16,806 |
20,147 |
23,270 |
26,202 |
||
Cash |
1,248 |
4,700 |
28,055 |
11,366 |
6,338 |
12,450 |
18,100 |
||
Other |
109 |
88 |
26 |
26 |
26 |
26 |
26 |
||
Current Liabilities |
|
|
(9,208) |
(10,148) |
(13,511) |
(13,842) |
(15,981) |
(17,981) |
(19,858) |
Creditors |
(9,208) |
(10,148) |
(13,511) |
(13,842) |
(15,981) |
(17,981) |
(19,858) |
||
Short term borrowings |
0 |
0 |
0 |
0 |
0 |
0 |
0 |
||
Long Term Liabilities |
|
|
(13,137) |
(20,739) |
(23,161) |
(23,161) |
(23,161) |
(23,161) |
(11,581) |
Long term borrowings |
(13,137) |
(20,739) |
(23,161) |
(23,161) |
(23,161) |
(23,161) |
(11,581) |
||
Other long term liabilities |
0 |
0 |
0 |
0 |
0 |
0 |
0 |
||
Net Assets |
|
|
3,048 |
2,326 |
28,632 |
13,123 |
13,412 |
24,579 |
46,640 |
CASH FLOW |
|||||||||
Operating Cash Flow |
|
|
614 |
(11,479) |
(11,326) |
(13,060) |
(2,160) |
13,263 |
26,670 |
Net Interest |
(963) |
(1,908) |
(3,145) |
(2,829) |
(2,000) |
(2,000) |
0 |
||
Tax |
59 |
282 |
42 |
(100) |
(112) |
(4,343) |
(8,579) |
||
Capex |
(502) |
(483) |
(694) |
(700) |
(754) |
(808) |
(860) |
||
Acquisitions/disposals |
0 |
0 |
0 |
0 |
0 |
0 |
0 |
||
Financing |
(8) |
12,859 |
38,357 |
0 |
0 |
0 |
0 |
||
Dividends |
0 |
(763) |
(1,652) |
0 |
0 |
0 |
0 |
||
Net Cash Flow |
(800) |
(1,492) |
21,582 |
(16,689) |
(5,027) |
6,112 |
17,231 |
||
Opening net debt/(cash) |
|
|
11,426 |
11,889 |
16,039 |
(4,894) |
11,795 |
16,823 |
10,711 |
HP finance leases initiated |
0 |
0 |
0 |
0 |
0 |
0 |
0 |
||
Other |
337 |
(2,658) |
(649) |
0 |
0 |
0 |
0 |
||
Closing net debt/(cash) |
|
|
11,889 |
16,039 |
(4,894) |
11,795 |
16,823 |
10,711 |
(6,520) |
Source: Edison Investment Research, company reports
|
|