AFH Financial Group
Written by
AFH Financial Group |
Beating forecasts, potential equity issue |
Trading statement |
Financial services |
9 November 2015 |
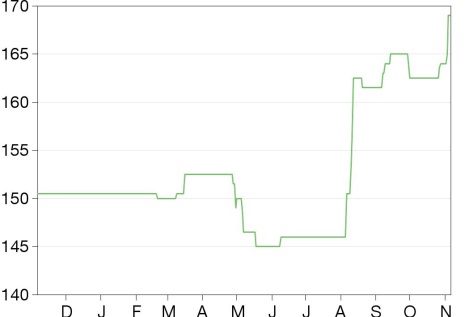
Share price performance
Business description
Next event
Analysts
AFH Financial Group is a research client of Edison Investment Research Limited |
|||||||||||||||||||||||||||||||||||||||||||||||
AFH is reporting strong organic and inorganic growth with a 30%+ increase in turnover FY15 on FY14. We have increased our FY15 revenue estimates by 4%, all of which is above expected organic growth. The company expects the FY15 results to be above market expectations. It also highlights that it is considering issuing further equity to take advantage of current market opportunities. We expect the latter to be measured and consistent with evolutionary rather than revolutionary acquisitions.
Year end |
Revenue (£m) |
PBT* |
EPS* |
DPS |
P/E |
Yield |
10/13 |
10.8 |
1.1 |
5.80 |
1.25 |
29.1 |
0.7 |
10/14 |
15.0 |
1.4 |
5.83 |
1.50 |
29.0 |
0.9 |
10/15e |
20.5 |
2.6 |
10.56 |
1.75 |
16.0 |
1.0 |
10/16e |
27.0 |
3.6 |
13.93 |
2.00 |
12.1 |
1.2 |
Note: *PBT and EPS are normalised, excluding intangible amortisation, exceptional items and share-based payments.
FY15 trading update
AFH reports a strong H215, with revenues for the full year expected to exceed £20m (H115: £8.22m, our previous estimate £19.7m). Despite funding significant acquisitions, cash balances at 31 October 2015 were in excess of £3m (in line with our previous estimate of £3.3m). Funds under management are reported as approaching £2bn at 31 October 2015. Management reports strong organic growth and we note that any beat against our estimates will be all organic growth. AFH has increased its national footprint by completing 11 acquisitions (including a small one not requiring RNS announcement) in FY15.
Outlook
We have increased our forecasts to reflect the outperformance reported for FY15, with an increase of 4% in revenue and a small operational efficiency gain. We note there has been an increase in the size and rate of acquisitions and management’s outlook highlights further increases in inorganic opportunities. AFH is considering additional financing options, including further share issues, to take advantage of these developing opportunities. We expect the size of any equity issue to be relatively modest. AFH is likely to want to pre-fund a number of deals rather than making repeated calls on its shareholders and the average deal size in 2015 was just over £1m. However, it may issue equity as part of deal structures and, historically, inorganic growth has been in digestible bites (the largest deal less than 10% of market capitalisation) and we expect this evolutionary rather than revolutionary approach to acquisitions to continue.
Valuation: Nearly 30% upside
We have increased estimates for both the organic beat in H215 and to include the Davisons deal (which completed after our last note was published). These earnings uplifts see our average valuation increase to 217p from 206p. We will include the effect of any equity issue and deals once they are announced.
Acquisitions update
Deal activity in H215 was a little slower than H115, but AFH still completed deals with maximum consideration totalling £4m. Management was focused on integrating its H115 deals, including the relatively large and more complex than usual IFS acquisition (see below). We believe this demonstrates appropriate discipline and is a much lower-risk approach than simply dashing for scale. With Davisons it has completed a second deal where shares formed part of the consideration. We note that Old Mutual has become a consolidator in the IFA market, but that its deal size is typically well above the level that is of interest to AFH. Some of the private equity consolidators appear to have overcommitted resources and, if anything, are less active in making new deals. AFH is also of most interest to vendors who want to continue with their businesses. For these reasons the pressure on pricing new acquisitions in the AFH targeted space appears to be less than in some other areas of the market.
Exhibit 1: Key financial dynamics from acquisitions made in FY15 (£000s)
Date |
Name |
Income multiplier |
Recurring income |
Max consideration |
Upfront |
Deferred |
Upfront |
Consideration as % FUM |
03/11/2014 |
Knight O'Byrne |
N/D |
N/D |
1,200.0 |
525.0 |
675.0 |
44% |
N/D |
30/01/2015 |
Roxborough Consultancy |
N/D |
N/D |
970.0 |
535.0 |
545.0 |
55% |
1.8% |
02/02/2015 |
First Class Financial Management |
3.0 |
28 |
84.0 |
42.0 |
42.0 |
50% |
N/D |
09/02/2015 |
K.L. Plester Financial Services |
3.1 |
600 |
1,833.0 |
860.2 |
972.8 |
47% |
N/D |
27/02/2015 |
CIB Wealth Management |
N/D |
N/D |
973.4 |
500.9 |
472.5 |
51% |
2.4% |
01/04/2015 |
Clarendon Financial Solutions |
N/D |
N/D |
483.0 |
252.5 |
230.5 |
52% |
1.9% |
30/04/2015 |
IFS |
N/D |
2,600 |
4,255.0 |
605.0 |
3,650.0 |
11% |
N/D |
27/07/2015 |
Quest Financial Management |
N/D |
N/D* |
585.0 |
292.5 |
292.5 |
50% |
N/D |
27/07/2015 |
Phoenix Independent Financial Services |
N/D |
N/D* |
489.0 |
240.0 |
249.0 |
49% |
N/D |
06/08/2015 |
Davisons Financial Management |
N/D |
N/D |
2,865 |
1,071 |
1,680 |
37% |
N/D |
Source: AFH, Edison Investment Research. Note: *In total Quest and Phoenix are expected to add c £320k to recurring income, implying an aggregate 3.35x multiple. N/D = not disclosed. FUM = funds under management.
Exhibit 2: Key business dynamics from acquisitions made in FY15 (£000s)
Date |
Names |
Location |
Advisers kept |
FUM (£m) |
Client portfolio (£000s) |
As % consideration |
03/11/2014** |
Knight O'Byrne |
Cornwall |
Y |
51 |
N/D |
N/D |
30/01/2015* |
Roxborough Consultancy |
Didcot |
N |
55 |
916 |
94% |
02/02/2015** |
First Class Financial Management |
West Bromwich |
Y |
N/D |
N/D |
N/D |
09/02/2015* |
K.L. Plester Financial Services |
Kidderminster |
Y |
N/D |
1,717 |
94% |
27/02/2015** |
CIB Wealth Management |
Rochester |
Y |
41 |
N/D |
N/D |
01/04/2015* |
Clarendon Financial Solutions |
Nottingham |
Y |
25 |
461 |
95% |
30/04/2015* |
IFS |
National (Stroud) |
Y |
N/D |
4,100 |
96% |
27/07/2015** |
Quest Financial Management |
Derby |
N |
N/D |
N/D |
N/D |
27/07/2015* |
Phoenix Independent Financial Services |
Blackburn |
N |
N/D |
N/D |
N/D |
06/08/2015** |
Davisons Financial Management |
Devon |
Y |
N/D |
N/D |
N/D |
Source: AFH, Edison Investment Research. Note: *Acquisition accounted; **asset purchase accounted.
IFS (UK)
The scale and nature of IFS meant it was treated differently from the other deals. It was not immediately integrated into AFH's existing infrastructure and AFH incurred the full existing cost base of IFS for this period. The reason for this was that there was much more uncertainty than usual over the retention of advisers given that the proportion of those who held equity was lower (giving them less of a deal benefit), as well as a different remuneration structure and working practices. IFS provided a different service proposition to its advisers and paid them accordingly (cost of sales mainly paid to advisers typically 70% against AFH average of c 48%). The existing arrangements were continued until 1 November 2015 to give the advisers time to consider whether they wanted to migrate to AFH. AFH built into the deal structure with a much lower upfront consideration, with the right to review the maximum consideration after six months and if there were departures the cap would reduce.
AFH announced in the trading statement that the number of advisers who have been authorised under AFH, and hence the price to be paid for IFS UK, has reduced from the maximum level, although at this stage we have not been given detailed numbers. The exceptional cost of integrating the business is expected to be less than half of the £500,000 provisionally set aside. We would expect the level of departure to be less than the 50% drop in restructuring charges, as some of the latter are more fixed costs and non-staff related. We understand that the majority of the advisers who chose to leave did so in the initial stages of takeover and that any further departures will be in the course of normal business rather than integration related. We also note management’s comment that it is very happy with the quality of the advisers who stayed – an implication at least that the departing advisers had a spread of capabilities and it was not just the best who exited. It is worth noting that while the cap has been reduced (more details to be given with the results), it is still a performance-related payout. The initial consideration was just £450k, which would be well under a quarter of the revised maximum cap if the latter reduced pro rata with the restructuring cost and, as noted above, we would actually expect a smaller rate of departure (and cap reduction) than this. Critically, the reduction in cap and performance-related buyouts means the risk of staff departures/under delivery lies largely with the seller of the business/the staff and not with AFH shareholders.
Valuation
The average of our valuation approaches for the existing business is 217p (previously 206p) per share, equivalent to 15.5x 2016e earnings, reflecting the long-term, double-digit growth story and the potential benefits of deploying further resources into acquisition opportunities. This multiple is in line with AFH’s broad peer group. Over time, delivery of earnings and a continued effective execution of the acquisition strategy are the most likely catalysts to a higher share price.
Peer comparisons
Exhibit 3: Peer valuation comparatives
P/E (x) |
Yield (%) |
|||
Market cap (£m) |
2015e |
2016e |
2015e |
|
AFH* |
34 |
16.0 |
12.1 |
1.0 |
IFA businesses |
||||
Lighthouse Group |
13 |
17.7 |
11.8 |
2.9 |
Frenkel Topping |
37 |
27.9 |
22.7 |
1.6 |
Professional service groups |
||||
IFG Group* |
163 |
21.9 |
17.0 |
2.9 |
Mattioli Woods (May following year) |
161 |
22.7 |
19.8 |
1.8 |
Wealth managers |
||||
Brooks Macdonald (June) |
245 |
18.3 |
N/A |
1.7 |
Charles Stanley (March following year) |
186 |
31.0 |
16.4 |
1.6 |
St James’s Place |
5,016 |
32.6 |
25.0 |
2.9 |
Platform providers |
||||
Hargreaves Lansdown |
6,862 |
37.2 |
N/A |
2.5 |
Share plc** |
43 |
26.3 |
20.2 |
2.5 |
Source: Thompson Reuters, Edison Investment Research. Note: *Edison Investment Research forecasts, **Edison cash-adjusted basis. Priced at 5 November 2015.
For the reasons identified above, we believe AFH’s business model is differentiated from peers. The companies above should only be taken as illustrative of AFH’s business.
Discounted cash flow: 272p, previously 257p
We explicitly forecast operating cash generation until 2016, then apply a 5% growth rate for 10 years and a 10x multiple to the final year to establish the terminal value and add this to existing cash balances. This is then discounted at the cost of capital (10% assumed), generating a fair value of 272p (up from our previous estimate of 257p). The rise is due to the earnings estimates increase, including the benefit of the Davisons deal.
Gordon’s growth model: 161p, previously 155p
We believe that a skill-based business, with suitable economies of scale, should be able to generate returns safely above its cost of capital. We assume AFH’s long-term return will be c 15%, against a cost of capital of 10% and long-term growth of 5%. The base case indicates it should therefore trade at c 2x book. We then apply a premium for near-term performance as, despite recent equity raisings, the normalised 2015-16e ROE is around our long-term estimates and the equity growth rate well above. This indicates a fair value of 161p (up from our previous estimate of 155p due to the profitability generated from the now included acquisitions and the issue of shares above NAV). The sensitivities are given below.
Exhibit 4: Gordon’s growth model and sensitivity
Base |
1% ROE |
1% g |
1% COE |
|
ROE |
15.0% |
16.0% |
15.0% |
15.0% |
Growth |
5.0% |
5.0% |
6.0% |
5.0% |
COE |
10.0% |
10.0% |
10.0% |
11.0% |
P/B |
2.0 |
2.2 |
2.3 |
1.7 |
2016e NAV |
0.70 |
0.70 |
0.70 |
0.70 |
Implied price |
1.40 |
1.54 |
1.58 |
1.17 |
Premium for near-term performance |
15% |
15% |
15% |
15% |
Fair value |
1.61 |
1.77 |
1.81 |
1.34 |
Difference |
0.16 |
0.20 |
-0.27 |
Source: Edison Investment Research
Any model that focuses on statutory earnings (such as Gordon’s growth model) will include the amortisation charge and so is likely to show a lower valuation than a cash-based model (which does not include the amortisation as it is a non-cash item).
Financials
Exhibit 5: Estimates changes
|
Revenue (£m) |
Adjusted PBT (£m) |
EPS (p) |
Dividend (p) |
|||||||||
Old |
New |
Change |
Old |
New |
Change |
Old |
New |
Change |
Old |
New |
Change |
||
FY15e |
19.7 |
20.5 |
4 |
2.3 |
2.6 |
13 |
9.36 |
10.56 |
13 |
1.75 |
1.75 |
0 |
|
FY16e |
25.5 |
27.0 |
6 |
3.3 |
3.6 |
8 |
13.16 |
13.93 |
6 |
2.00 |
2.00 |
0 |
|
Source: Edison Investment Research
The revenue guidance in the trading statement was over £20m, at least 2% ahead of our previous estimate of £19.7m. We have increased both 2015 (to £20.5m) and 2016 revenue (to £27.0m) accordingly. We have also included £1m of revenue for the Davisons deal announced in August primarily in 2016. We have assumed a small improvement in efficiency with operational leverage and so our profit and earnings estimates rise well ahead of the revenue uplift. We have assumed most of the higher revenue feeds through to debtors, leaving our cash forecast largely unchanged.
Exhibit 6: Financial summary
£000s |
2012 |
2013 |
2014 |
2015e |
2016e |
|
Year end 31 October |
||||||
PROFIT & LOSS |
||||||
Revenue |
|
7,201 |
10,797 |
15,037 |
20,500 |
27,000 |
Cost of Sales (exc amortisation and depreciation) |
(6,826) |
(9,581) |
(13,514) |
(17,750) |
(23,240) |
|
EBITDA |
|
375 |
1,216 |
1,523 |
2,751 |
3,760 |
Depreciation |
|
(29) |
(54) |
(84) |
(100) |
(115) |
Amortisation |
(44) |
(91) |
(343) |
(837) |
(975) |
|
Operating profit (pre-exceptional) |
|
301 |
1,071 |
1,096 |
1,813 |
2,670 |
Exceptionals |
0 |
0 |
(196) |
(250) |
0 |
|
Other |
0 |
0 |
0 |
0 |
0 |
|
Investment revenues |
1 |
(22) |
(39) |
(164) |
(215) |
|
Profit Before Tax (FRS 3) |
|
302 |
1,049 |
861 |
1,399 |
2,456 |
Profit Before Tax (norm) |
|
541 |
1,140 |
1,439 |
2,606 |
3,551 |
Tax |
(127) |
(245) |
(260) |
(447) |
(686) |
|
Profit After Tax (FRS 3) |
|
168 |
804 |
601 |
952 |
1,770 |
Profit After Tax (norm) |
|
357 |
875 |
1,061 |
2,085 |
2,840 |
Average Number of Shares Outstanding (m) |
14.3 |
15.1 |
18.2 |
19.7 |
20.4 |
|
EPS - normalised (p) |
|
2.50 |
5.80 |
5.83 |
10.56 |
13.93 |
EPS - FRS3 (p) |
|
1.18 |
5.33 |
3.31 |
4.82 |
8.68 |
Dividend per share (p) |
1.00 |
1.25 |
1.50 |
1.75 |
2.00 |
|
Cost sales as % revenue |
-48% |
-48% |
-49% |
-49% |
-47% |
|
Admin cost (exc amortisation) as % revenue |
-47% |
-41% |
-42% |
-39% |
-40% |
|
EBITDA Margin (%) |
5.2% |
11.3% |
10.1% |
13.4% |
13.9% |
|
Operating Margin (before GW and except.) (%) |
4.2% |
9.9% |
7.3% |
8.8% |
9.9% |
|
ROE |
4.7% |
14.2% |
6.7% |
8.4% |
13.4% |
|
Normalised ROE |
10.0% |
15.4% |
11.9% |
18.4% |
21.5% |
|
BALANCE SHEET |
||||||
Fixed Assets |
|
4,496 |
7,628 |
9,987 |
19,764 |
18,750 |
Current Assets |
|
2,923 |
6,959 |
8,127 |
6,212 |
6,631 |
Total Assets |
|
7,420 |
14,587 |
18,114 |
25,977 |
25,381 |
Deferred consideration due >1 yr |
|
(606) |
(1,839) |
(2,266) |
(3,377) |
(2,843) |
Other current liabilities |
|
(1,873) |
(2,456) |
(2,650) |
(3,240) |
(3,847) |
Deferred consideration due <1 yr |
(853) |
(2,220) |
(1,866) |
(4,285) |
(1,442) |
|
Other LT liabilities |
(16) |
(786) |
(794) |
(2,936) |
(2,939) |
|
Net Assets |
|
4,072 |
7,285 |
10,538 |
12,138 |
14,309 |
NAV per share |
|
0.28 |
0.43 |
0.54 |
0.61 |
0.70 |
CASH FLOW |
||||||
Operating Cash Flow |
|
(197) |
811 |
1,581 |
2,708 |
3,407 |
Net cash from investing activities |
(2,383) |
(3,139) |
(2,761) |
(7,602) |
(2,807) |
|
Net cash from (used in) financing |
1,780 |
5,739 |
2,499 |
2,628 |
(572) |
|
Net Cash Flow |
|
(799) |
3,411 |
1,319 |
(2,266) |
28 |
|
|
|
|
|
|
|
Gross Cash |
|
2012 |
2013 |
2014 |
2015e |
2016e |
Opening |
|
1,722 |
923 |
4,334 |
5,653 |
3,387 |
Change in cash |
|
(799) |
3,411 |
1,319 |
(2,266) |
28 |
Closing balance sheet |
|
923 |
4,334 |
5,653 |
3,387 |
3,415 |
Source: AFH, Edison Investment Research
|