FY18 revenues were held back by the impact on client demand of the Q4 equity market correction and a levelling off in pension transfer activity. Nevertheless, revenue generated from affinity relationships continued to grow. Recurring revenue was up 10% and now accounts for more than 50% of customer revenue. The opportunity for the group to generate good long-term growth by meeting the need for financial advice, particularly within its affinity relationships, remains attractive.
Written by
Lighthouse Group |
Affinity and recurring revenue continue growth |
FY18 results |
Financial services |
12 March 2019 |
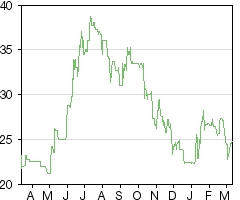
Share price performance
Business description
Next events
Analysts
Lighthouse Group is a research client of Edison Investment Research Limited |
|||||||||||||||||||||||||||||||||||||||||||||||
FY18 revenues were held back by the impact on client demand of the Q4 equity market correction and a levelling off in pension transfer activity. Nevertheless, revenue generated from affinity relationships continued to grow. Recurring revenue was up 10% and now accounts for more than 50% of customer revenue. The opportunity for the group to generate good long-term growth by meeting the need for financial advice, particularly within its affinity relationships, remains attractive.
Year end |
Revenue (£m) |
EBITDA* (£m) |
PBT |
EPS** |
DPS |
P/E |
Yield |
12/17 |
54.1 |
3.2 |
2.5 |
1.49 |
0.42 |
16.8 |
1.7 |
12/18 |
53.4 |
3.4 |
2.6 |
1.54 |
0.70 |
16.3 |
2.8 |
12/19e |
55.2 |
3.6 |
3.0 |
1.76 |
0.80 |
14.2 |
3.2 |
12/20e |
57.2 |
3.9 |
3.5 |
2.03 |
0.90 |
12.3 |
3.6 |
Note: *EBITDA is before share-based payments. **EPS are normalised and fully diluted, with tax credits excluded and a standard tax charge applied.
FY18 results tempered by near-term softening
Group revenues were 1% down, affected by the softening in customer demand highlighted above. Segmentally, only the legacy Communities area recorded a reduction, reflecting both the weaker demand background and a small contraction in the number of advisers. Overall revenue per adviser was maintained, control over costs allowed underlying EBITDA to increase by 7.2% and diluted underlying EPS increased by 3.4%. The group has no debt and cash of £9.5m is therefore well placed both to follow a progressive dividend policy (+67% for 2018) and pursue investment where appropriate.
Outlook for growth remains in place
The growth opportunity for Lighthouse and other financial advice providers in the UK appears attractive, with a combination of an ageing population, greater longevity, the switch to defined contribution pensions, increased pension freedom and tax complexity all pointing towards increased demand. Many may be unwilling to pay an economic price for advice, but even so the potential market is large and growing. For Lighthouse, the market segment it addresses is the mass affluent, or Middle Britain. It is differentiated by its strength in affinity relationships, mainly with unions, which give it access to a potential audience of more than six million individuals. Management is considering investing in additional advisers and associated support resources to accelerate growth in the next five years, which could temporarily affect results, but this should be more than offset if successfully executed.
Valuation: Significant upside on two measures
Our DCF-based valuation is lower than previously at 41p, versus 44p, following reductions in our FY19 and FY20 EPS estimates (3% and 1% respectively). However, it is perhaps more realistic to reference peer P/Es in the near term, which average 19x and 16x for FY18 and FY19. Based on these multiples, Lighthouse would be valued at c 30p, still 20% above the current price.
Investment summary
Financial advice with focus on affinity partnerships
Lighthouse has a long track record of providing holistic financial advice to both individuals and corporate customers. It reports its activities in four segments: National, Wealth Advisory, Communities and Other. The National segment includes Lighthouse Financial Advice advisers operating under the LFA brand and Lighthouse Mortgage and Protection advisers. This segment is responsible for the 23 affinity partnerships under which Lighthouse acts as the preferred financial adviser for the union or corporate partner membership. Wealth Advisory serves a high net worth client base, and also incorporates employee benefit and other workplace benefit services. The Communities segment is a legacy activity providing a network and support for advisers that operate under their own brands within local communities. Finally, under the Other segment there is the Luceo Asset Management business launched in 2016 that offers a range of funds tailored to different risk profiles. Lighthouse has recently established a strategic partnership with Tavistock Investments that will provide access, subject to due diligence, to additional investment products to meet client needs. The group’s strategy is to focus on development of the affinity business with Wealth Advisory and Luceo Asset Management expected to augment growth. A strategy review which is underway may lead to additional investment in personnel to accelerate growth.
Positive longer-term trend despite softer end to 2018
As noted earlier, we have tempered our estimates following the FY18 results, but we still look for a continuation of the growth in revenues, EBITDA and cash flow as shown in the table below. The 41% increase in adviser productivity between 2014 and 2018 is notable and has contributed to the strengthening of EBITDA margin and cash flow.
Exhibit 1: Revenue, EBITDA and cash flow progression
£000s unless stated |
2014 |
2015 |
2016 |
2017 |
2018 |
2019e |
2020e |
Revenue |
46,798 |
48,881 |
47,919 |
54,111 |
53,422 |
55,178 |
57,217 |
Revenue per adviser (£) |
86,000 |
93,000 |
99,000 |
122,000 |
122,000 |
||
EBITDA (before share-based payments) |
1,202 |
1,610 |
2,287 |
3,187 |
3,417 |
3,571 |
3,919 |
EBITDA margin (%) |
2.6 |
3.3 |
4.8 |
5.9 |
6.4 |
6.5 |
6.8 |
Change in net cash |
(563) |
830 |
146 |
671 |
813 |
1,436 |
1,820 |
Source: Lighthouse, Edison Investment Research
Sensitivities
The business background for Lighthouse seems positive given an ageing population, increasing longevity, the move from defined benefit to defined contribution pensions and complexity in rules relating to pensions and tax. Nevertheless, as Q418 illustrated, market volatility and uncertainty over the macro outlook can dampen near-term activity levels. Regulatory changes or individual lapses in the quality of advice (something which Lighthouse seeks to manage closely) could also have an adverse effect. While technology could be a disruptive factor, it also provides an opportunity for incumbents such as Lighthouse to support face-to-face advice and broaden their market reach in due course. With its affinity relationships and target of serving Middle Britain, Lighthouse should be well placed if the market evolves in this way.
Valuation: At a discount to peers
Lighthouse trades at a significant discount to peers and, on an average peer rating, would be valued at c 29p. A DCF calculation suggests a much higher valuation could be supported through delivery of longer-term growth potential (41p on our assumptions: see page 10).
Financial adviser targeting Middle Britain
Lighthouse is one of the larger financial advice companies in the UK with its precursor businesses established well before the group’s formation and listing on AIM in 2000. It targets the mass affluent or Middle Britain with a particular focus on developing its affinity partner relationships, predominantly with trade unions. Important corporate developments have included: the 2007 agreement with Liverpool Victoria (LV=), which provided exclusive access to offer financial advice to a number of affinity groups; the merger with Sumus in 2008, which increased the scale of the business; and, more recently, the launch of Luceo Asset Management (2016) and the strategic agreement with Tavistock Investments in 2018 to augment the in-house product offering. While Lighthouse has made and remains willing to make acquisitions, it does not seek to build its client and advisor base through an active acquisition programme.
Segmental activities
The group’s activities are arranged in four segments.
■
National includes two activities, Lighthouse Financial Advice (LFA) and Lighthouse Mortgage and Protection Services (LMPS). LFA is an advisory business with national coverage providing financial advice to the mass affluent. Advisers are mainly self-employed but work under the LFA brand. LFA has contractual agreements with 23 affinity partners as a preferred provider of financial advice (see below for more detail). There are about 140 financial advisers. LMPS, with c 30 specialist advisors, offers mortgage and insurance advice and is increasingly involved with the affinity business.
■
Wealth Advisory provides advice to a high net worth client base through two businesses: Carrwood and Lighthouse Wealth. Carrwood has employed and Lighthouse Wealth self-employed advisers. Carrwood has contractual relationships with more than 50 accountancy and other professional firms to provide financial advice to their clients. The group’s employee benefits and workplace solutions business is also included in this segment.
■
Communities or Lighthouse Advisory Services (LAS) is the group’s network of self-employed advisers who work under their own brands supported by the same software and researched solutions as used by other advisers within the group.
■
The Other segment includes Luceo Asset Management. This was launched in September 2016 to offer an actively managed range of fund of funds (currently five) tailored to different risk profiles. The aim is to provide a wide range of clients with access to high-quality, diversified investment portfolios. Octopus acts as investment adviser to the funds. At end 2018, assets under management at Luceo were £58m, compared with £37m at the prior year end.
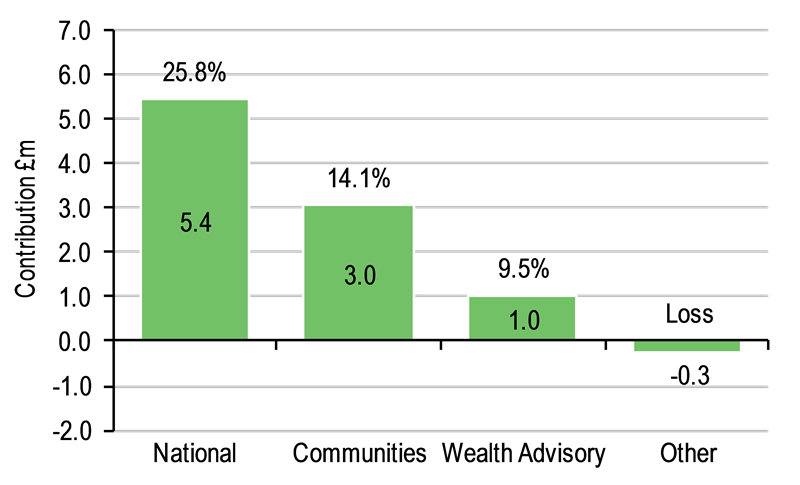
Exhibits 2 and 3 show revenue and contribution analyses by segment.
|
Exhibit 2: Segmental revenue analysis |
Exhibit 3: Contribution and margin after direct costs |
|
|
|
Source: Lighthouse, Edison Investment Research |
|
Exhibit 2: Segmental revenue analysis |
|
|
Source: Lighthouse, Edison Investment Research |
|
Exhibit 3: Contribution and margin after direct costs |
|
|
Source: Lighthouse, Edison Investment Research |
These show that while the National and Communities both contributed c 40% of group revenue, the National segment accounts for the largest share of profits (shown here before indirect costs) reflecting the lower level of pay-away to advisers, which in turn reflects the greater level of input, including client introductions provided by the group; the contribution margin for National is 26% compared with 14% for Communities. The Wealth Advisory contribution margin was again lower (9.5%), partly reflecting the level of pay-away to self-employed advisors and also the costs associated with the auto-enrolment proposition. Absent the latter cost, we estimate the contribution margin would have been close to 12%.
Following a strategic review of the auto-enrolment business, the group decided that it lacked the necessary scale to justify further investment and has identified the AutoEnrolment Master Trust (operated by Smart Pension) as the most appropriate candidate to take over responsibility for the assets and members involved. The proposed transfer is expected to be cost neutral in 2019 and to generate a small net income stream thereafter.
In November 2018, Lighthouse announced a strategic agreement with Tavistock Investments that will provide it with access to Tavistock’s investment solutions. These include two recently launched capital protection funds. The funds are mainly invested in BlackRock iShares; the capital underpin is provided by Morgan Stanley and scales with the value of the fund. Tavistock also has a risk-graded fund range, a model portfolio service and plans to launch an app allowing consumers to buy a guaranteed fund provided by a large investment bank. The agreement is set to help deliver the broader offering Lighthouse seeks for Luceo. In conjunction with this agreement, Lighthouse subscribed £1m to Tavistock’s £1.25m equity fund-raising, giving it a 5.3% stake.
Exhibit 4 sets out the additional revenue disclosure provided by the group in the 2018 results release. This highlights the relatively small but rapidly growing contribution from the LMPS mortgage/protection activity. The small reduction in LFA revenue in 2018 is attributed to the increase in market uncertainty in Q418 and a levelling out of pension transfer advice. Affinity-related revenue, mostly within LFA, accounted for 18% of group revenue.
Exhibit 4: Additional revenue analysis
£000 unless stated |
2017 |
2018 |
% of group |
% change |
LFA (incl affinity - within National segment) |
19,840 |
19,541 |
37 |
-1.5 |
LMPS (mortgage/protection - within National segment) |
1,161 |
1,475 |
3 |
27.0 |
Lighthouse Wealth and Carrwood (within Wealth Advisory segment) |
9,292 |
10,163 |
19 |
9.4 |
Lighthouse Pensions Trust (LPT - within Wealth Advisory segment) |
360 |
370 |
1 |
2.8 |
Communities (Lighthouse Advisory Services -network) |
23,291 |
21,484 |
40 |
-7.8 |
Other (Luceo Asset Management) |
167 |
389 |
1 |
132.9 |
Group |
54,111 |
53,422 |
100 |
-1.3 |
Affinity (across group) |
9,430 |
9,740 |
18 |
3.3 |
Recurring (across group) |
24,390 |
26,770 |
50 |
9.8 |
Source: Lighthouse Group, Edison Investment Research. Note: Affinity revenue for 2017 excludes exceptional pension transfer advice fees.
Revenue generation and EBITDA progression
Most of the Lighthouse revenue from financial advice is in the form of fees rather than commission. Reflecting customer preference and general practice in the market, most fees are charged on the basis of a percentage of assets under advice. The fee for initial advice, including a holistic report on the client’s financial position, will tend to be in the range of 2–3%, while the ongoing fee for advice in subsequent years is likely to be between 0.5% and 1.0%. Not all commission payments were precluded by the Retail Distribution Review (RDR: implementation 2012–13), so commissions have continued for pre-RDR retail investment products held outside a platform and are also earned from other products including insurance protection products and mortgage advice. Commission accounts for c 12% of total revenue.
|
Exhibit 5: Group revenue and EBITDA progression |
|
|
Source: Lighthouse Group, Edison Investment Research |
Exhibit 5 shows the progression of group revenue, EBITDA and EBITDA margin over the last five years. Group revenue has grown at a compound rate of 3% during this period but this has been depressed by the gradual contraction of the legacy network Communities segment, while the softer market background and levelling off in pension transfer business influenced the 2018 result, as noted above. The development of the more profitable LFA business, including the affinity relationships, contributed to a more rapid growth in revenue per adviser (9% CAGR) and, as shown in the chart, the more than doubling of the EBITDA margin, generating compound growth of 26% in EBITDA.
Affinity business provides a differentiated source of growth
There are 23 affinity relationships (up from 14 in 2013 and 21 in 2017), including a range of union and corporate organisations, giving a mix of sector exposures and diversity of membership, which totals over six million individuals. The relationships position Lighthouse as a preferred supplier of financial advice. Lighthouse agrees service levels over the life of the agreement with the affinity partner and will provide a short free initial meeting with individuals, and runs group presentations and clinics in the workplace to discuss particular topics including, for example, mid-career financial advice, mortgage clinics, pre-retirement planning and, on occasion, advice arising from restructuring situations.
Having the affinity relationship does not guarantee any level of business and the environment is likely to remain competitive, both in terms of winning an individual’s business and securing affinity partners. However, Lighthouse is well placed by dint of having already secured over 20 relationships, the investment it has made in IT systems, call centre support and event organisation staff, and the experience it has built up in this part of the market. Arguably, this creates something of a ‘defensive moat’, a point supported by its record of so far retaining all relationships on contract renewal.
The development of revenues and recent profit after direct costs are shown in Exhibit 6. Affinity revenue across the group has grown at a compound rate of 14%, recurring revenue accounted for 50% of total revenue in 2018 and the contribution margin was 29%.
Exhibit 6: Affinity revenue and profit progression
£m |
2014 |
2015 |
2016 |
2017* |
2018 |
New business revenues |
2.5 |
2.9 |
5.1 |
4.9 |
|
Recurring revenue |
4.1 |
3.9 |
4.4 |
4.9 |
|
Revenue (across group) |
5.4 |
6.6 |
6.8 |
9.4 |
9.7 |
Direct costs |
(6.5) |
(6.9) |
|||
Profit after direct costs |
2.9 |
2.8 |
Source: Lighthouse, Edison Investment Research. Note: 2017 numbers exclude exceptional pension transfer activity.
The next table shows the partnerships and approximate membership numbers. Points to note from this are the significant relationships in the public sector education and healthcare sectors, while the scale of the Unison and Unite unions within the multi-sector area bolsters the overall affinity membership base substantially. The high public sector exposure may reduce the opportunities for provision of pension-related advice, but this would not apply in all cases and the scale of the potential audience for Lighthouse to address provides substantial scope for increased penetration and hence growth.
Exhibit 7: Lighthouse affinity partners
Organisation |
Membership |
Notes |
|
Education |
589,000 |
||
National Education Union (NEU) |
Over 450,000 |
Union |
|
University and College Union (UCU) |
120,000 |
Union |
|
Association of School and College Leaders (ASCL) |
Over 19,000 |
Union |
|
Healthcare professionals |
479,200 |
||
Boots Pharmacists’ Association (BPA) |
1,200 |
Union |
|
The Social Workers Union (SWU) |
12,000 |
Union |
|
The Royal College of Midwives |
36,000 |
Union |
|
Foster Talk |
30,000 |
Not for profit company |
|
Royal College of Nursing (via RCN Xtra) |
Over 400,000 |
Union |
|
Public services |
504,000 |
||
Boundless (CSMA) |
280,000 |
Membership benefit club |
|
Fire Brigades Union (FBU) |
44,000 |
Union |
|
Public and Commercial Services (PCS) |
180,000 |
Union |
|
Multiple sectors |
3,410,000 |
||
Bakers Food and Allied Workers Union (BFAWU) |
23,000 |
Union |
|
Benefit Hub |
100,000 |
Benefit portal |
|
Prospect |
160,000 |
Union |
|
Unison |
1,300,000 |
Union |
|
Unite |
1,400,000 |
Union |
|
Usdaw |
427,000 |
Union |
|
Corporate and collectives |
1,973,220 |
||
BA Clubs |
40,000 |
Sports, leisure club for BA Group employees and former employees |
|
FDA |
18,000 |
Union (civil service) |
|
GFTU |
215,000 |
General Federation of Trade Unions |
|
Money Advice Service |
120 |
Govt. funded company with the objective of improving public understanding/management of their financial affairs |
|
Parliament Hill |
1,700,000 |
Benefit management for over 90 UK-based membership associations |
|
Pen-gage |
100 |
Pension engagement consultant |
|
Total |
6,955,420 |
Source: Lighthouse, Edison Investment Research
Group strategy
Lighthouse is in the process of reviewing its strategy for the next five years and is likely to be in a position to provide further information on this by the time of its H119 results (September). The review will seek to identify areas that are most likely to generate further earnings growth, with affinity and professional connections cited as examples. We assume that the affinity business will continue to be seen as the main growth driver, while Wealth Advisory will provide a stable and growing contribution and the Communities network will be supported but represent a smaller part of the business over time.
Lighthouse notes that investment may be needed in adviser recruitment, lead generation and marketing to support growth. As an example, in the affinity business, the group would need to add to its marketing spend, regional partnership relationship personnel and advisers in a co-ordinated way in order to accelerate lead generation and maintain a high level of service to new customers. With recruitment and initial uncovered costs for a new adviser amounting to as much as £50,000, this could have a material near-term impact on results before the benefit of increased growth flows through in year two and beyond. Lighthouse notes that it has already started to recruit employed advisers to LFA, which previously had an entirely self-employed team. Given the group is able to generate a flow of leads for new advisers, it is able to focus on hiring advisers without an existing client base mitigating the competitive pressure and costs involved to some extent.
To increase penetration of the affinity partner membership, the main approach is to increase the number of engagements with new potential clients from this group. Around 100 events are arranged each month, putting the company in contact with c 15,000 individuals per year. The aim is to increase this to 20,000 then 30,000.
The Communities (network) business has been managed to a point where it has increased its profitability over three years with risks to clients, the group and network advisers minimised through use of the IT infrastructure and financial solutions also employed in other parts of the group. The intention is to continue supporting these businesses but not to recruit new advisers to the network.
Luceo Asset Management has a range of funds to cover a broad spectrum of risk appetites and the partnership with Tavistock Investments (see earlier) is set to extend the range of in-house products available for clients (subject to due diligence on the funds). Accumulation of assets should progressively move the existing Luceo funds to a profitable size.
The increasing involvement of mortgage and protection advisers in the affinity business should aid lead generation and may justify adding to the number of advisers in LMPS.
M&A has not recently been a prominent feature in the group’s development but, subject to strict pricing discipline, management would not rule out a transaction that added capability to the service offering.
FY18 results
Details of the P&L result are given in Exhibit 8. Group revenues were down slightly reflecting a softening in financial markets at the end of the year (affecting customer confidence) and a levelling out of pension transfer advice in the second half. Segmentally, National, which includes the affinity business, was marginally ahead despite this and, as shown earlier, affinity-related business across the group was up 3.3%. Wealth Advisory showed healthy growth of 9% and revenue from the other segment multiplied as Luceo Asset Management began to scale up (AUM increased from £37m to £58m). The only segment to see a revenue decline was the Communities network, partly influenced by a lower number of advisers (-3% to 168) and partly because of the market weakness mentioned above).
Not shown in the table below, the level of recurring income increased by 10% and now accounts for 53% of total customer revenue vs 48% in 2017, while the average revenue production per adviser was maintained at £122,000.
Direct costs including cost of goods sold and other directly attributable costs were 2.4% lower reflecting general cost control, allowing the overall contribution margin to increase from 16.2% to 17.1%. Looking at the segmental profits at this level the largest move (+50%) was in Wealth Advisory where the main driver was a reduction in the level of costs associated with the auto-enrolment activity that is included here; excluding this, there was a 5% increase to £1.25m. Otherwise changes were much more limited. After a 3% increase in indirect costs underlying EBITDA increased by 7% to £3.4m.
Pre-tax profit was up 5% and while a reduced availability of tax losses and a tax charge gave rise to a reduction in basic earnings per share of 7%, diluted underlying EPS, calculating using a normalised tax charge, were 1.54p vs 1.49p (+3.4%).
The full-year dividend of 0.70p represented an increase of 67%, reflecting the group’s progressive policy. Cover on diluted underlying EPS remains over two times.
Exhibit 8: Profit and loss analysis
£000s unless stated |
2017 |
2018 |
% change |
2017 |
2018 |
Revenue |
|||||
National |
21,001 |
21,016 |
0.1 |
||
Communities |
23,291 |
21,484 |
-7.8 |
||
Wealth Advisory |
9,652 |
10,533 |
9.1 |
||
Other segments |
167 |
389 |
132.9 |
||
Total |
54,111 |
53,422 |
-1.3 |
||
Direct expenses |
(45,369) |
(44,278) |
-2.4 |
||
Profit contribution |
Margin % |
Margin % |
|||
National |
5,463 |
5,414 |
-0.9 |
26.0 |
25.8 |
Communities |
2,927 |
3,030 |
3.5 |
12.6 |
14.1 |
Wealth Advisory |
665 |
999 |
50.2 |
6.9 |
9.5 |
Other segments |
(313) |
(299) |
-4.5 |
loss |
loss |
Total profit after direct costs |
8,742 |
9,144 |
4.6 |
16.2 |
17.1 |
Indirect operating expenses |
(5,555) |
(5,727) |
3.1 |
||
Underlying EBITDA |
3,187 |
3,417 |
7.2 |
5.9 |
6.4 |
Share based payments |
(385) |
(365) |
-5.2 |
||
EBITDA |
2,802 |
3,052 |
8.9 |
5.2 |
5.7 |
Depreciation |
(274) |
(396) |
44.5 |
||
Net finance cost |
(7) |
(12) |
71.4 |
||
Pre-tax profit |
2,521 |
2,644 |
4.9 |
||
Basic EPS (p) |
2.13 |
1.98 |
-6.9 |
||
Dil underlying EPS (p) |
1.49 |
1.54 |
3.4 |
||
DPS (p) |
0.42 |
0.70 |
66.7 |
Source: Lighthouse Group, Edison Investment Research.
Background and outlook
While market weakness and related macro uncertainties may have dampened near-term activity levels for Lighthouse, there are a range of longer-term factors that seem likely to prove favourable for the financial advice industry and Lighthouse.
The demographic trend towards an ageing UK population with an increasing proportion aged over 60 and increased longevity is set to mean a growth in the numbers approaching retirement and a longer decumulation period for those in retirement. This should generate increased demand for advice on pension saving and management of assets during the drawdown phase.
The demographic driver meshes with the shift from defined benefit to defined contribution pensions placing responsibility on individuals, while the pension freedoms introduced in 2015 lifted the requirement to purchase an annuity on retirement but increased the complexity of choices people have to make in managing their finances. The tax regime has been subject to continued change and the interaction of choices on drawdown with inheritance tax are examples of tax complexity that encourage people to seek financial advice.
On a cautionary note, surveys have suggested that many people may not be willing to pay for financial advice, but the population of affluent and mass affluent categories is substantial at an estimated five million and 10 million respectively, pointing to a still attractive market to address.
As noted earlier, Lighthouse has a particular focus on developing the penetration of its affinity partnerships and to this end is likely to invest in additional staff. It is well placed to do this given year-end cash of £9.55m of which roughly half could be regarded as available for deployment after allowing for regulatory requirements. Another use of cash could be to develop (or acquire) in-house specialist services or products to meet client needs.
In the next section we highlight the adjustments we have made to our forecasts.
Financials
Changes in headline numbers from our estimates are shown in Exhibit 9. Our group revenue assumptions are 4% lower (similar to the shortfall versus estimate for 2018), but containment of assumed cost growth feeds through to more modest reductions in EPS. Our estimates do not allow for a market acceleration in staff recruitment, which may follow the strategy review discussed earlier. Such an investment would be likely to affect earnings initially but have a neutral then beneficial impact in subsequent years as revenue growth responded. Reflecting the higher than expected dividend payout for 2018, we have increased our estimates for 2019 and 2020 significantly. Further detail from our estimates is included in the financial summary.
Exhibit 9: Estimate revisions
Revenue (£m) |
PBT (£m) |
Diluted EPS (p) |
Dividend (p) |
||||||||||
Old |
New |
% chg |
Old |
New |
% chg |
Old |
New |
% chg |
Old |
New |
% chg |
||
2018 |
55.7 |
53.4 |
-4.0 |
2.8 |
2.6 |
-4.2 |
1.61 |
1.54 |
-4.3 |
0.60 |
0.70 |
16.7 |
|
2019e |
57.5 |
55.2 |
-4.0 |
3.1 |
3.0 |
-2.7 |
1.81 |
1.76 |
-2.8 |
0.70 |
0.80 |
14.3 |
|
2020e |
59.7 |
57.2 |
-4.2 |
3.5 |
3.5 |
-0.6 |
2.04 |
2.03 |
-0.7 |
0.77 |
0.90 |
16.9 |
|
Source: Edison Investment Research. For 2018 new figures are actual and old our estimate.
As noted in the previous section, the group remains in a strong position financially with no debt and cash of £9.55m; this was after investing £1m in Tavistock Investments shares. Lighthouse has substantial headroom above its regulatory capital requirement.
Our simplified cash flow table for 2016–20e below shows that we expect net cash generation to accelerate now that outstanding provisions have fallen to below £1m compared with £3.9m at end 2017. As a reminder, provisions include those made for the expected cost of settling customer complaints and the potential clawback of commissions paid by providers where products are cancelled: in both cases the group can claim against relevant advisers and an asset within trade and other creditors is recognised to reflect this. On our estimates, the payment of corporation tax as tax losses wind down and increased dividend payments only partly offset the beneficial impact of increased operating profits and a neutral position on provision movements.
Exhibit 10: Simplified cash flow analysis
£000s |
2016 |
2017 |
2018 |
2019e |
2020e |
Operating profit |
1,909 |
2,528 |
2,656 |
3,005 |
3,463 |
Working capital |
2,901 |
338 |
2,616 |
(244) |
(90) |
Change in provisions |
(4,493) |
(2,132) |
(3,137) |
0 |
0 |
Tax |
0 |
0 |
0 |
(574) |
(663) |
Other incl depreciation, amortisation and share-based payments |
351 |
649 |
732 |
566 |
457 |
Operating cash flow |
668 |
1,383 |
2,867 |
2,752 |
3,166 |
Tangible & intangible investments |
(203) |
(329) |
(1,415) |
(333) |
(325) |
Dividends paid |
(319) |
(383) |
(639) |
(983) |
(1,022) |
Change in net cash |
146 |
671 |
813 |
1,436 |
1,820 |
Source: Edison Investment Research
Valuation
In this section we consider the valuation of Lighthouse shares in the light of a peer group comparison and the outputs of our DCF model.
Our updated peer group table (Exhibit 11) includes a range of financial advice companies, discretionary fund managers and wealth managers (which we have grouped separately). Each has different characteristics and there is a wide range of market capitalisations, but investors interested in the financial advice and retail investment markets might also consider these companies. Following significant share price weakness in the last month (down c 14% at time of writing) Lighthouse now trades below the average P/Es for both groups and offers an above average yield.
Exhibit 11: Peer group comparison
Market capital (£m) |
P/E 2018 (x) |
P/E 2019 (x) |
Yield (%) |
|
Lighthouse Group |
32 |
16.1 |
14.1 |
2.8 |
AFH |
143 |
15.6 |
10.5 |
1.8 |
Frenkel Topping |
24 |
16.8 |
13.3 |
3.8 |
Harwood Wealth |
86 |
17.0 |
14.2 |
2.5 |
IFG Group |
144 |
15.8 |
12.4 |
1.2 |
Mattioli Woods |
204 |
20.0 |
18.2 |
2.2 |
Mortgage Advice Bureau |
294 |
23.1 |
20.1 |
3.7 |
St James's Place |
5,295 |
24.0 |
22.0 |
4.8 |
Tatton |
114 |
19.8 |
17.5 |
3.2 |
Tavistock Investments |
17 |
N/A |
N/A |
0.0 |
Adviser/DFM average |
19.0 |
16.0 |
2.6 |
|
Brewin Dolphin |
877 |
14.4 |
15.1 |
5.3 |
Brooks Macdonald |
223 |
14.1 |
12.0 |
2.9 |
Charles Stanley |
138 |
16.3 |
15.0 |
3.0 |
Quilter |
2,512 |
10.7 |
13.5 |
2.5 |
Rathbones |
1,246 |
16.1 |
16.3 |
2.9 |
Wealth manager average |
14.3 |
14.4 |
3.3 |
Source: Refinitiv, Edison Investment Research. Note: Priced at 11 March 2019.
Our discounted cash flow valuation takes into account our explicit estimates set out in the financial summary table and assumes long-term growth of 3%. Factoring in a discount rate of 9% gives a valuation of c 41p (44p previously). Exhibit 12 shows the sensitivity of this valuation to different discount rates and assumed long-term growth rates.
Exhibit 12: Discounted cash flow valuation sensitivity (pence per share)
Discount rate (right) long-term growth |
7% |
8% |
9% |
10% |
11% |
1.0% |
44.0 |
41.4 |
39.0 |
36.8 |
34.8 |
2.0% |
45.2 |
42.5 |
40.0 |
37.7 |
35.6 |
3.0% |
46.4 |
43.6 |
41.0 |
38.7 |
36.5 |
4.0% |
47.7 |
44.8 |
42.1 |
39.6 |
37.4 |
5.0% |
49.0 |
45.9 |
43.2 |
40.6 |
38.3 |
Source: Edison Investment Research
Referencing the peer group comparison suggests this valuation would be too demanding in the near term, given the implied Lighthouse P/E multiples of 27x and 23x for FY18 and FY19 respectively. Putting Lighthouse on multiples in line with the averages for advisory peers shown above would give a value of c 30p (still 20% above the price at time of writing). In due course, successful implementation of an investment plan to accelerate growth and further evidence of increasing penetration of the affinity partners’ membership base should warrant a progressively higher valuation.
Exhibit 13: Financial summary
Year end 31 December (£000s) |
2015 |
2016 |
2017 |
2018 |
2019e |
2020e |
Profit and loss |
||||||
National |
16,074 |
15,717 |
21,001 |
21,016 |
22,115 |
24,128 |
Communities |
23,978 |
23,780 |
23,291 |
21,484 |
21,307 |
20,402 |
Wealth Advisory |
8,829 |
8,422 |
9,652 |
10,533 |
11,163 |
11,825 |
Other |
0 |
0 |
167 |
389 |
593 |
863 |
Total revenue |
48,881 |
47,919 |
54,111 |
53,422 |
55,178 |
57,217 |
Cost of sales |
(34,057) |
(33,452) |
(39,439) |
(38,819) |
(39,855) |
(40,883) |
Gross profit |
14,824 |
14,467 |
14,672 |
14,603 |
15,323 |
16,334 |
Underlying expenses |
(13,214) |
(12,180) |
(11,485) |
(11,186) |
(11,753) |
(12,415) |
Underlying EBITDA |
1,610 |
2,287 |
3,187 |
3,417 |
3,571 |
3,919 |
Share based payment |
0 |
(79) |
(385) |
(365) |
(201) |
(84) |
EBITDA |
1,610 |
2,208 |
2,802 |
3,052 |
3,370 |
3,835 |
Depreciation and amortisation |
(552) |
(299) |
(274) |
(396) |
(365) |
(373) |
Operating profit |
1,058 |
1,909 |
2,528 |
2,656 |
3,005 |
3,463 |
Finance income |
14 |
11 |
3 |
17 |
17 |
25 |
Finance costs |
(206) |
(27) |
(10) |
(29) |
0 |
0 |
Profit before taxation |
866 |
1,893 |
2,521 |
2,644 |
3,022 |
3,488 |
Taxation |
0 |
750 |
200 |
(111) |
(574) |
(663) |
Non-controlling interest |
0 |
0 |
0 |
0 |
0 |
0 |
Earnings |
866 |
2,643 |
2,721 |
2,533 |
2,448 |
2,825 |
Adjusted earnings |
866 |
1,514 |
2,036 |
2,142 |
2,448 |
2,825 |
Basic EPS (p) |
0.68 |
2.07 |
2.13 |
1.98 |
1.92 |
2.21 |
Dil EPS (p) |
0.68 |
1.97 |
1.98 |
1.82 |
1.76 |
2.03 |
Adjusted EPS (p) |
0.68 |
1.19 |
1.59 |
1.68 |
1.92 |
2.21 |
Dil adjusted EPS (p) |
0.68 |
1.13 |
1.49 |
1.54 |
1.76 |
2.03 |
Dividends (p) |
0.24 |
0.27 |
0.42 |
0.70 |
0.80 |
0.90 |
Dividend cover - dil adjusted EPS (x) |
2.8 |
4.2 |
3.5 |
2.2 |
2.2 |
2.3 |
EBITDA margin (%) |
3.3 |
4.6 |
5.2 |
5.7 |
6.1 |
6.7 |
Return on equity - adj earnings (%) |
13.8 |
19.5 |
19.7 |
16.7 |
16.6 |
17.1 |
Balance sheet |
||||||
Non-current assets |
6,555 |
7,220 |
7,478 |
8,367 |
8,352 |
8,329 |
Intangible assets |
5,284 |
5,230 |
5,131 |
5,247 |
5,275 |
5,290 |
Property, plant & equipment |
1,271 |
1,240 |
1,397 |
1,305 |
1,262 |
1,225 |
Investment |
0 |
0 |
0 |
976 |
976 |
976 |
Deferred tax asset |
0 |
750 |
950 |
839 |
839 |
839 |
Current assets |
21,655 |
17,505 |
16,920 |
13,990 |
15,922 |
18,124 |
Trade and other receivables |
13,266 |
9,004 |
8,187 |
4,444 |
4,940 |
5,323 |
Cash and cash equivalents |
8,389 |
8,501 |
8,733 |
9,546 |
10,982 |
12,802 |
Total assets |
28,210 |
24,725 |
24,398 |
22,357 |
24,274 |
26,454 |
Current liabilities |
17,254 |
12,307 |
11,635 |
8,099 |
8,351 |
8,643 |
Borrowings |
34 |
34 |
0 |
0 |
0 |
0 |
Trade and other payables |
10,629 |
9,268 |
8,789 |
7,662 |
7,914 |
8,206 |
Provisions |
6,591 |
3,005 |
2,846 |
437 |
437 |
437 |
Non-current liabilities |
4,395 |
3,454 |
1,076 |
348 |
348 |
348 |
Borrowings |
439 |
405 |
0 |
0 |
0 |
0 |
Provisions |
3,956 |
3,049 |
1,076 |
348 |
348 |
348 |
Total liabilities |
21,649 |
15,761 |
12,711 |
8,447 |
8,699 |
8,991 |
Net assets |
6,561 |
8,964 |
11,687 |
13,910 |
15,575 |
17,463 |
Cash flow |
||||||
Operating profit |
1,058 |
1,909 |
2,528 |
2,656 |
3,005 |
3,463 |
Depreciation and amortisation |
552 |
299 |
274 |
396 |
365 |
373 |
Share-based payments |
0 |
79 |
385 |
365 |
201 |
84 |
Change in receivables, payables |
(2,415) |
2,901 |
338 |
2,616 |
(244) |
(90) |
Change in provisions |
2,270 |
(4,493) |
(2,132) |
(3,137) |
0 |
0 |
Finance costs paid |
(404) |
(27) |
(10) |
(29) |
0 |
0 |
Income taxes refunded/paid |
0 |
0 |
0 |
0 |
(574) |
(663) |
Net cash flow from operating activities |
1,061 |
668 |
1,383 |
2,867 |
2,752 |
3,166 |
Purchase/sale of investment |
0 |
0 |
0 |
(1,012) |
0 |
0 |
Purchase of PPE |
(119) |
(126) |
(307) |
(140) |
(150) |
(150) |
Purchase of intangibles |
(69) |
(88) |
(25) |
(280) |
(200) |
(200) |
Finance income received |
14 |
11 |
3 |
17 |
17 |
25 |
Net cash flow from investing activities |
(174) |
(203) |
(329) |
(1,415) |
(333) |
(325) |
Dividends paid |
(255) |
(319) |
(383) |
(639) |
(983) |
(1,022) |
Change in loans |
(1,307) |
(34) |
(439) |
0 |
0 |
0 |
Net cash flow from financing activities |
(1,562) |
(353) |
(822) |
(639) |
(983) |
(1,022) |
Change in cash |
(675) |
112 |
232 |
813 |
1,436 |
1,820 |
Change in loans/other |
1,505 |
34 |
439 |
0 |
0 |
0 |
Change in net cash |
830 |
146 |
671 |
813 |
1,436 |
1,820 |
Closing net cash |
7,916 |
8,062 |
8,733 |
9,546 |
10,982 |
12,802 |
Source: Lighthouse Group, Edison Investment Research
|
|||||||||||||||||||||||||||||||||||||||||||||
|
|
General disclaimer and copyright This report has been commissioned by Lighthouse Group and prepared and issued by Edison, in consideration of a fee payable by Lighthouse Group. Edison Investment Research standard fees are £49,500 pa for the production and broad dissemination of a detailed note (Outlook) following by regular (typically quarterly) update notes. Fees are paid upfront in cash without recourse. Edison may seek additional fees for the provision of roadshows and related IR services for the client but does not get remunerated for any investment banking services. We never take payment in stock, options or warrants for any of our services. Accuracy of content: All information used in the publication of this report has been compiled from publicly available sources that are believed to be reliable, however we do not guarantee the accuracy or completeness of this report and have not sought for this information to be independently verified. Opinions contained in this report represent those of the Edison analyst at the time of publication. Forward-looking information or statements in this report contain information that is based on assumptions, forecasts of future results, estimates of amounts not yet determinable, and therefore involve known and unknown risks, uncertainties and other factors which may cause the actual results, performance or achievements of their subject matter to be materially different from current expectations. Exclusion of Liability: To the fullest extent allowed by law, Edison shall not be liable for any direct, indirect or consequential losses, loss of profits, damages, costs or expenses incurred or suffered by you arising out or in connection with the access to, use of or reliance on any information contained on this note. No personalised advice: The information that we provide should not be construed in any manner whatsoever as, personalised advice. Also, the information provided by us should not be construed by any subscriber or prospective subscriber as Edison’s solicitation to effect, or attempt to effect, any transaction in a security. The securities described in the report may not be eligible for sale in all jurisdictions or to certain categories of investors. Investment in securities mentioned: Edison has a restrictive policy relating to personal dealing and conflicts of interest. Edison Group does not conduct any investment business and, accordingly, does not itself hold any positions in the securities mentioned in this report. However, the respective directors, officers, employees and contractors of Edison may have a position in any or related securities mentioned in this report, subject to Edison's policies on personal dealing and conflicts of interest. Copyright: Copyright 2019 Edison Investment Research Limited (Edison). All rights reserved FTSE International Limited (“FTSE”) © FTSE 2019. “FTSE®” is a trade mark of the London Stock Exchange Group companies and is used by FTSE International Limited under license. All rights in the FTSE indices and/or FTSE ratings vest in FTSE and/or its licensors. Neither FTSE nor its licensors accept any liability for any errors or omissions in the FTSE indices and/or FTSE ratings or underlying data. No further distribution of FTSE Data is permitted without FTSE’s express written consent. Australia Edison Investment Research Pty Ltd (Edison AU) is the Australian subsidiary of Edison. Edison AU is a Corporate Authorised Representative (1252501) of Myonlineadvisers Pty Ltd who holds an Australian Financial Services Licence (Number: 427484). This research is issued in Australia by Edison AU and any access to it, is intended only for "wholesale clients" within the meaning of the Corporations Act 2001 of Australia. Any advice given by Edison AU is general advice only and does not take into account your personal circumstances, needs or objectives. You should, before acting on this advice, consider the appropriateness of the advice, having regard to your objectives, financial situation and needs. If our advice relates to the acquisition, or possible acquisition, of a particular financial product you should read any relevant Product Disclosure Statement or like instrument. New Zealand The research in this document is intended for New Zealand resident professional financial advisers or brokers (for use in their roles as financial advisers or brokers) and habitual investors who are “wholesale clients” for the purpose of the Financial Advisers Act 2008 (FAA) (as described in sections 5(c) (1)(a), (b) and (c) of the FAA). This is not a solicitation or inducement to buy, sell, subscribe, or underwrite any securities mentioned or in the topic of this document. For the purpose of the FAA, the content of this report is of a general nature, is intended as a source of general information only and is not intended to constitute a recommendation or opinion in relation to acquiring or disposing (including refraining from acquiring or disposing) of securities. The distribution of this document is not a “personalised service” and, to the extent that it contains any financial advice, is intended only as a “class service” provided by Edison within the meaning of the FAA (i.e. without taking into account the particular financial situation or goals of any person). As such, it should not be relied upon in making an investment decision. United Kingdom Neither this document and associated email (together, the "Communication") constitutes or form part of any offer for sale or subscription of, or solicitation of any offer to buy or subscribe for, any securities, nor shall it or any part of it form the basis of, or be relied on in connection with, any contract or commitment whatsoever. Any decision to purchase shares in the Company in the proposed placing should be made solely on the basis of the information to be contained in the admission document to be published in connection therewith. This Communication is being distributed in the United Kingdom and is directed only at (i) persons having professional experience in matters relating to investments, i.e. investment professionals within the meaning of Article 19(5) of the Financial Services and Markets Act 2000 (Financial Promotion) Order 2005, as amended (the "FPO") (ii) high net-worth companies, unincorporated associations or other bodies within the meaning of Article 49 of the FPO and (iii) persons to whom it is otherwise lawful to distribute it. The investment or investment activity to which this document relates is available only to such persons. It is not intended that this document be distributed or passed on, directly or indirectly, to any other class of persons and in any event and under no circumstances should persons of any other description rely on or act upon the contents of this document (nor will such persons be able to purchase shares in the placing). This Communication is being supplied to you solely for your information and may not be reproduced by, further distributed to or published in whole or in part by, any other person. United States The Investment Research is a publication distributed in the United States by Edison Investment Research, Inc. Edison Investment Research, Inc. is registered as an investment adviser with the Securities and Exchange Commission. Edison relies upon the "publishers' exclusion" from the definition of investment adviser under Section 202(a) (11) of the Investment Advisers Act of 1940 and corresponding state securities laws. This report is a bona fide publication of general and regular circulation offering impersonal investment-related advice, not tailored to a specific investment portfolio or the needs of current and/or prospective subscribers. As such, Edison does not offer or provide personal advice and the research provided is for informational purposes only. No mention of a particular security in this report constitutes a recommendation to buy, sell or hold that or any security, or that any particular security, portfolio of securities, transaction or investment strategy is suitable for any specific person. |
Frankfurt +49 (0)69 78 8076 960 Schumannstrasse 34b 60325 Frankfurt Germany |
London +44 (0)20 3077 5700 280 High Holborn London, WC1V 7EE United Kingdom |
New York +1 646 653 7026 1,185 Avenue of the Americas 3rd Floor, New York, NY 10036 United States of America |
Sydney +61 (0)2 8249 8342 Level 4, Office 1205 95 Pitt Street, Sydney NSW 2000, Australia |
Frankfurt +49 (0)69 78 8076 960 Schumannstrasse 34b 60325 Frankfurt Germany |
London +44 (0)20 3077 5700 280 High Holborn London, WC1V 7EE United Kingdom |
New York +1 646 653 7026 1,185 Avenue of the Americas 3rd Floor, New York, NY 10036 United States of America |
Sydney +61 (0)2 8249 8342 Level 4, Office 1205 95 Pitt Street, Sydney NSW 2000, Australia |
Research: Healthcare
Targovax’s Q418 presentation discussed highlights from the past year, focusing on the data readouts from the TG01 study in pancreatic cancer (PC) and the ONCOS-102 melanoma Phase I data. Management’s plan for 2019 is largely unchanged: data from the first cohort of the ONCOS-102 melanoma study will be published in H119, treatment of the second cohort is ongoing and early interim data from TG02 colorectal cancer study will be published in H119. Management will also present three-year survival data from the TG01 PC study in H119 and is confident in finding a partner for continued development of TG01 in PC. Cash reaches into 2020, while our valuation is marginally higher at NOK1.46bn or NOK27.7/share.