Last close As at 05/08/2026
—
— 0.00 (0.00%)
Market capitalisation
—
Research: Investment Companies
Fidelity European Values (FEV) aims to achieve long-term capital growth from its European equity portfolio by focusing on companies that are able to deliver medium-term dividend growth. This approach gives FEV a defensive bias as well as a yield close to the sector average. Although he acknowledges a number of positive indicators for the near term, manager Sam Morse sees an upcoming turning point in the economic cycle and the prospect of rising bond yields as negative catalysts for equity valuations. His caution is reflected in FEV’s low gearing and the recent concentration of the portfolio, as a number of holdings with weakening fundamentals have been sold into market strength during the first half of 2017.
Written by
Fidelity European Values |
Adopting a more cautious approach |
Investment trusts |
18 August 2017 |
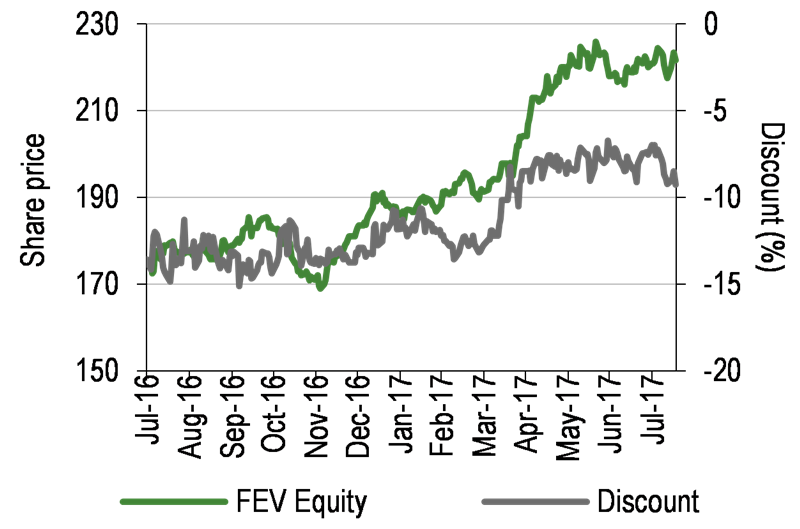
Share price/discount performance
Three-year performance vs index
Gearing
Analysts
|
|||||||||||||||||||||||||||||||||||||||||||||||||||||||||||||||||||||||||||||||||||||||||||||
Fidelity European Values (FEV) aims to achieve long-term capital growth from its European equity portfolio by focusing on companies that are able to deliver medium-term dividend growth. This approach gives FEV a defensive bias as well as a yield close to the sector average. Although he acknowledges a number of positive indicators for the near term, manager Sam Morse sees an upcoming turning point in the economic cycle and the prospect of rising bond yields as negative catalysts for equity valuations. His caution is reflected in FEV’s low gearing and the recent concentration of the portfolio, as a number of holdings with weakening fundamentals have been sold into market strength during the first half of 2017.
12 months ending |
Share price |
NAV |
FTSE World Europe ex-UK (%) |
MSCI Europe |
MSCI World |
31/07/13 |
35.8 |
34.4 |
36.0 |
31.2 |
28.1 |
31/07/14 |
1.3 |
0.7 |
4.1 |
4.6 |
4.7 |
31/07/15 |
24.4 |
15.7 |
9.6 |
7.6 |
14.1 |
31/07/16 |
(0.7) |
9.1 |
7.1 |
6.1 |
17.7 |
31/07/17 |
29.0 |
19.8 |
24.6 |
21.3 |
17.6 |
Source: Thomson Datastream. Note: All % on a total return basis in pounds sterling.
Investment strategy: Selecting for dividend growth
Supported by Fidelity’s extensive analyst team, manager Sam Morse pursues a bottom-up approach, aiming to invest in companies with attractive valuations, positive fundamentals, strong balance sheets, predictable cash flow generation and the ability to grow dividends over a three- to five-year horizon. FEV’s portfolio typically contains 50-60 holdings and is diversified by sector and country, with weightings versus the benchmark broadly unconstrained. Gearing up to 30% is permitted but is generally at a more modest level (currently 3.6%).
Market outlook: Positive but with grounds for caution
The European market has performed well in 2017 to date, with gains being driven by improving corporate earnings growth, and Europe continues to appear more attractive than the US market on valuation grounds. However, while positive sentiment may support market performance in the near term, geopolitical risks have the potential to unsettle markets. Furthermore, the prospect of simultaneous monetary policy tightening by central banks globally and a resultant rise in bond yields has the potential to have a significantly adverse effect on equity valuations. In light of these grounds for caution, investors may find appeal in a fund with a defensive bias, investing in companies with strong fundamentals.
Valuation: Discount following a narrowing trend
FEV’s share price discount to NAV (including income) has followed a narrowing trend since touching a three-year wide point of 17.3% in early July 2016, and the current 9.2% discount is narrower than its 11.3% one-year average and broadly in line with its three- and five-year averages (9.0% and 9.6% respectively). FEV’s dividend has grown in each year since 2010, and its 1.9% yield is close to the sector average.
Exhibit 1: Trust at a glance
Investment objective and fund background |
Recent developments |
||||||||||||||||||||||||||||||||||||||||||||||||||||||||||||||||||||||||||||||||||||||||||||||||||
Fidelity European Values’ investment objective is to achieve long-term capital growth from a portfolio of primarily continental European securities. Permitted exposure to stocks listed outside continental Europe of 20% gives the manager investment flexibility. FEV’s performance benchmark is the FTSE World Europe ex-UK Index. |
■ 31 July 2017: Interim results to 30 June 2017. NAV TR +13.6% versus benchmark TR +13.0%. Share price TR +21.4%. ■ 15 May 2017: Simon Fraser stepped down from the board after 15 years’ service. ■ 14 March 2017: Full-year results to 31 December 2016. NAV TR +17.6% versus benchmark TR +19.7%. Share price TR +7.6%. ■ 14 March 2017: 4.17p FY16 dividend proposed, 25.2% increase from FY15. ■ 13 March 2017: Paul Yates appointed to the board as an independent non-executive director, effective 6 March 2017. |
||||||||||||||||||||||||||||||||||||||||||||||||||||||||||||||||||||||||||||||||||||||||||||||||||
Forthcoming |
Capital structure |
Fund details |
|||||||||||||||||||||||||||||||||||||||||||||||||||||||||||||||||||||||||||||||||||||||||||||||||
AGM |
May 2018 |
Ongoing charges |
0.99% |
Group |
FIL Investments International |
||||||||||||||||||||||||||||||||||||||||||||||||||||||||||||||||||||||||||||||||||||||||||||||
Final results |
March 2018 |
Net gearing |
3.6% (through CFDs) |
Manager |
Sam Morse |
||||||||||||||||||||||||||||||||||||||||||||||||||||||||||||||||||||||||||||||||||||||||||||||
Year end |
31 December |
Annual mgmt fee |
0.85% of net assets |
Address |
Beech Gate, Millfield Lane, Lower Kingswood, Tadworth, KT20 6RP |
||||||||||||||||||||||||||||||||||||||||||||||||||||||||||||||||||||||||||||||||||||||||||||||
Dividend paid |
May |
Performance fee |
None |
||||||||||||||||||||||||||||||||||||||||||||||||||||||||||||||||||||||||||||||||||||||||||||||||
Launch date |
November 1991 |
Trust life |
Indefinite |
Phone |
+44 (0)800 41 41 10 |
||||||||||||||||||||||||||||||||||||||||||||||||||||||||||||||||||||||||||||||||||||||||||||||
Continuation vote |
Two-yearly (next 2019) |
Loan facilities |
None – CFDs used |
Website |
|||||||||||||||||||||||||||||||||||||||||||||||||||||||||||||||||||||||||||||||||||||||||||||||
Dividend policy and history |
Share buyback policy and history |
||||||||||||||||||||||||||||||||||||||||||||||||||||||||||||||||||||||||||||||||||||||||||||||||||
FEV pays an annual dividend in May in respect of the previous financial year. Revenue earnings are largely distributed in full. |
FEV has authority (renewed annually) to purchase up to 14.99% and allot up to 5% of issued share capital. |
||||||||||||||||||||||||||||||||||||||||||||||||||||||||||||||||||||||||||||||||||||||||||||||||||
|
|
||||||||||||||||||||||||||||||||||||||||||||||||||||||||||||||||||||||||||||||||||||||||||||||||||
Shareholder base (as at 31 May 2017) |
Portfolio exposure by market cap (as at 30 June 2017) |
||||||||||||||||||||||||||||||||||||||||||||||||||||||||||||||||||||||||||||||||||||||||||||||||||
|
|
||||||||||||||||||||||||||||||||||||||||||||||||||||||||||||||||||||||||||||||||||||||||||||||||||
Top 10 holdings (as at 30 June 2017) |
|||||||||||||||||||||||||||||||||||||||||||||||||||||||||||||||||||||||||||||||||||||||||||||||||||
|
|||||||||||||||||||||||||||||||||||||||||||||||||||||||||||||||||||||||||||||||||||||||||||||||||||
Source: Fidelity European Values, Edison Investment Research, Bloomberg, Morningstar. Note: *N/A where not in June 2016 top 10.
Market outlook: Positive but with reasons for caution
European equity markets have performed well in 2017 to date, driven by strengthening corporate earnings growth, while valuation multiples have only increased modestly. Exhibit 2 (left-hand chart) shows that the Datastream Europe market forward P/E multiple has risen from 13.2x to 14.5x over the last three years, while the Datastream US market forward P/E multiple has risen from 16.2x to 18.3x. Over this period, the discount at which the European market trades relative to the US market has widened from 18.4% to 20.6%, making Europe appear more attractive on valuation grounds. The prospect of continuing improvement in European corporate earnings growth provides a further attraction. This positive outlook is supported by the European economic sentiment indicator, which has been steadily rising since February 2016, as illustrated in Exhibit 2 (right-hand chart).
|
Exhibit 2: European market valuation and economic sentiment |
|
DS-Europe market forward P/E multiple vs DS-US market over three years |
European economic sentiment indicator over 30 years |
|
|
|
Source: Thomson Datastream, Eurostat, Edison Investment Research |
|
While there are a number of factors suggesting a positive outlook for European stock markets, there are also geopolitical risks that have the potential to negatively influence equity markets, and the prospect of the ECB starting to normalise monetary policy could also weigh on equity market performance. Normalisation of monetary policy by the ECB, alongside tightening by other central banks, raises concerns over bond yields rising globally, which could lead to slowing economic growth as well as putting downward pressure on equity valuations.
Fund profile: Continental European equity focus
Launched in 1991 and listed on the London Stock Exchange, FEV aims to generate long-term capital growth from investing in a portfolio of primarily continental European equities. Performance is benchmarked against the FTSE World Europe ex-UK Index, but stocks are selected using a bottom-up approach, unconstrained by sector and geographic allocations. However, the manager monitors the portfolio to maintain sector exposures within five percentage points of the benchmark. The maximum permitted exposure to a single company at the time of investment is 10% of gross assets, while up to 20% of the portfolio in aggregate may be invested in companies outside the benchmark (including UK-listed companies) and up to 10% may be invested in unlisted securities. Derivatives may be used to protect or enhance investment returns. FEV uses contracts for difference (CFDs) to add gearing, which is permitted up to 30% of net assets but in practice is much lower (ranging between 2.8% and 11.3% since 2011). While there is scope to take short positions, none were held at the time of writing. Individual short positions may be used to express a negative view on a stock and to reduce overall exposure to the market. Since January 2011, FEV’s portfolio has been managed by Sam Morse, who has more than 25 years’ investment industry experience and adopts an investment approach based on a company’s ability to grow dividends sustainably.
The fund manager: Sam Morse
The manager’s view: Increased caution appropriate
Sam Morse sees a number of factors that suggest a positive outlook for European stock markets, with the ECB considered unlikely to start normalising monetary policy before 2019 and corporate earnings growth becoming evident for the first time in five years. However, he has become less optimistic over the market outlook, as he sees a turning point in the economic cycle nearing and believes rising bond yields could have a major negative effect on equities. He is still finding attractive investment opportunities, but has taken advantage of recent market strength to exit a number of portfolio holdings that were also demonstrating weakening fundamentals, with proceeds largely reinvested in existing portfolio companies. During the first half of 2017, one new investment was made and seven positions were exited, although none of these was a top 10 holding.
The largest position sold was Schneider Electric, where concerns arose over the company’s capital allocation, due to acquisitions being made that were considered expensive and dilutive to cash flow returns, while dividend growth was only modest. Proceeds were used to add to FEV’s holding in Legrand, another electrical products manufacturer and distributor. Both holdings had represented 1.4% of the portfolio at end-2016. The holding in asset manager GAM Holding was sold, taking advantage of a rally in the shares that was helped by a small activist investor taking a stake. The investment case for GAM had weakened, with the new CEO having made disappointing progress on improving distribution. Finnish utility company Fortum was sold, as its exposure to Russia was becoming a concern and the prospect of a dividend cut seemed increasingly likely. Similarly, Carlsberg was sold due to concerns over its Eastern European business as a result of unfavourable demographics and regulation, while its dividend yield remained relatively low.
The holding in Volkswagen was sold, with the stock having rallied c 50% since its low in October 2015 following the diesel emissions scandal. A recent meeting with the company highlighted the potential headwinds to profitability over the medium term, as it transitions to a new electric vehicle strategy. Belgian postal services provider Bpost was sold due to business risk from declining volumes and the CEO’s relatively aggressive acquisition strategy; the stock had risen c 70% since FEV invested at its IPO in June 2013. H&M was sold as it has moved its focus from investing in its physical stores to cost-cutting, with its online business much less developed than its competitors, making it unlikely to grow its dividend.
Christian Dior, which was one of the top contributors to FEV’s performance over the 12 months to end-June 2017, had been seen as a route to gain exposure to LVMH at a more attractive valuation. FEV exited its position when LVMH acquired the c 30% of the company it did not already own at a 15% premium to the prevailing market price. FEV received Hermès shares, which added to its existing holding, and cash, which it invested into a new position in LVMH.
Asset allocation
Investment process: Selecting stocks for dividend growth
The manager has three core investment principles:
■
bottom-up stock selection with a focus on dividend growth
■
a long-term view, which he believes leads to better investment performance and lower costs
■
a cautious approach, which takes into account potential downside risk.
Companies are sought that are able to grow dividends sustainably over a three- to five-year period, based on the belief that companies consistently growing their dividends tend to outperform over longer time periods. Candidate companies should demonstrate positive fundamentals such as structural growth potential, disciplined capital allocation and proven business models. Strong cash flow generation is seen as a good indicator of future dividend growth prospects, and a strong balance sheet provides comfort over the sustainability of dividend payments, while also allowing a company to invest for future growth. To qualify for inclusion in the portfolio, potential investee companies should be trading at a discount to their estimated intrinsic value. A relatively concentrated portfolio is maintained, typically comprising 50-60 holdings.
Current portfolio positioning
The number of stocks in FEV’s portfolio has reduced to 51 at end-June 2017 (from 57 at end-2016), but concentration in the top 10 holdings has marginally reduced to 38.7% compared with 39.1% a year earlier (see Exhibit 1). Portfolio turnover is typically c 25% pa, reflecting the long-term approach, and was only 12.5% for the six months to end-June 2017, despite the apparent increase in portfolio activity suggested by the reduction in the number of portfolio holdings during the period.
As shown in Exhibit 3, FEV’s sector exposures at end-June 2017 were broadly similar to a year earlier, with financials, industrials, healthcare and consumer goods accounting for a little over 70% of the portfolio. While this combined exposure is similar to the benchmark, FEV has its largest overweight exposure in healthcare and its greatest underweight in financials, while also being significantly underweight in consumer goods and appreciably overweight in industrials. Among the other sectors, the most material active positions are an overweight in technology and underweights in basic materials and telecoms.
Exhibit 3: Portfolio sector exposure vs benchmark (% unless stated)
Portfolio end-June 2017 |
Portfolio end- June 2016 |
Change |
Index weight |
Active weight |
Trust weight/ index weight (x) |
|
Financials |
19.6 |
18.4 |
1.2 |
23.3 |
(3.7) |
0.8 |
Industrials |
17.5 |
16.4 |
1.1 |
15.4 |
2.1 |
1.1 |
Healthcare |
17.3 |
18.6 |
(1.3) |
13.0 |
4.3 |
1.3 |
Consumer goods |
16.8 |
18.5 |
(1.7) |
19.2 |
(2.4) |
0.9 |
Technology |
8.6 |
6.4 |
2.2 |
4.7 |
3.9 |
1.8 |
Oil & gas |
5.8 |
5.9 |
(0.1) |
4.2 |
1.6 |
1.4 |
Consumer services |
5.0 |
6.4 |
(1.4) |
4.9 |
0.1 |
1.0 |
Basic materials |
4.8 |
3.7 |
1.2 |
7.8 |
(3.0) |
0.6 |
Utilities |
3.4 |
4.1 |
(0.8) |
3.8 |
(0.4) |
0.9 |
Telecommunications |
1.1 |
1.4 |
(0.4) |
3.7 |
(2.6) |
0.3 |
|
100.0 |
100.0 |
100.0 |
|
Source: Fidelity European Values, Edison Investment Research. Note: Adjusted for gearing.
Exhibit 4 shows FEV’s diversification across more than 10 countries. While a key feature of the portfolio is its exposure to the UK, which is not represented in the index, France is the largest active overweight exposure. Germany is the third-largest portfolio exposure and has seen the greatest increase over the year to end-June 2017, but remains the most significant underweight position.
Exhibit 4: Portfolio geographic exposure vs benchmark (% unless stated)
Portfolio end- |
Portfolio end- June 2016 |
Change |
Index weight |
Active weight |
Trust weight/ index weight (x) |
|
France |
30.0 |
27.9 |
2.1 |
21.7 |
8.2 |
1.4 |
Switzerland |
17.0 |
19.8 |
(2.8) |
18.5 |
(1.5) |
0.9 |
Germany |
14.3 |
11.6 |
2.7 |
20.4 |
(6.1) |
0.7 |
Spain |
6.9 |
6.1 |
0.9 |
7.3 |
(0.4) |
1.0 |
United Kingdom |
5.7 |
7.4 |
(1.7) |
0.0 |
5.7 |
N/A |
Belgium |
5.0 |
6.2 |
(1.2) |
2.5 |
2.5 |
2.0 |
Finland |
4.4 |
4.9 |
(0.5) |
2.3 |
2.1 |
1.9 |
Denmark |
4.1 |
5.7 |
(1.6) |
3.8 |
0.3 |
1.1 |
Netherlands |
3.9 |
2.7 |
1.2 |
6.5 |
(2.6) |
0.6 |
Norway |
3.3 |
3.3 |
0.0 |
1.3 |
2.0 |
2.5 |
Other countries |
5.4 |
4.4 |
1.0 |
15.6 |
(10.2) |
0.3 |
100.0 |
100.0 |
|
100.0 |
|
|
Source: Fidelity European Values, Edison Investment Research. Note: Adjusted for gearing.
Performance: Strong absolute returns over five years
As shown in Exhibit 6, FEV’s NAV total return has outperformed its FTSE World Europe ex-UK benchmark over three and 10 years but modestly underperformed over one and five years. Exhibit 5 illustrates that, while FEV’s NAV total return underperformed the benchmark over one year, its share price total return outperformed over this period, with FEV’s discount narrowing appreciably in April 2017 (moving from 12.7% to 8.5%). In absolute terms, FEV has delivered strong annualised NAV returns over one, three and five years (19.8%, 14.8% and 15.4%, respectively), while the lower 7.5% pa return over 10 years should be considered in light of the period including the 2008 financial crisis. The weaker relative performance over the last 12 months during a period of strong market performance is not unusual for FEV, which tends to be relatively defensively positioned and to outperform during periods of market weakness as a result of the manager’s investment process, which favours stocks with a lower risk profile. However, FEV’s NAV return has been notably strong over six months, outperforming a strong market. As illustrated in Exhibit 7, FEV’s relative weakness from August 2016 to March 2017 followed its outperformance over the previous two years, when market performance was relatively subdued.
|
Exhibit 5: Investment trust performance to 31 July 2017 |
|
Price, NAV and benchmark total return performance, one-year rebased |
Price, NAV and benchmark total return performance (%) |
|
|
|
Source: Thomson Datastream, Edison Investment Research. Note: Three, five and 10-year performance figures annualised. |
|
Exhibit 6: Share price and NAV total return performance, relative to indices (%)
|
One month |
Three months |
Six months |
One year |
Three years |
Five years |
10 years |
Price relative to FTSE World Europe ex-UK |
(0.5) |
2.0 |
5.8 |
3.5 |
9.0 |
5.8 |
9.7 |
NAV relative to FTSE World Europe ex-UK |
(0.7) |
(0.5) |
0.9 |
(3.8) |
3.4 |
(1.2) |
9.1 |
Price relative to MSCI Europe |
(0.1) |
3.0 |
8.3 |
6.4 |
15.1 |
15.4 |
13.3 |
NAV relative to MSCI Europe |
(0.3) |
0.4 |
3.3 |
(1.2) |
9.2 |
7.7 |
12.7 |
Price relative to MSCI World |
0.4 |
4.9 |
14.1 |
9.7 |
0.9 |
3.5 |
(17.7) |
NAV relative to MSCI World |
0.2 |
2.2 |
8.8 |
1.9 |
(4.2) |
(3.4) |
(18.1) |
Source: Thomson Datastream, Edison Investment Research. Note: Data to end-July 2017. Geometric calculation.
|
Exhibit 7: NAV total return performance relative to benchmark over three years |
|
|
Source: Thomson Datastream, Edison Investment Research |
Discount: Appreciable narrowing over one year
FEV’s share price discount to NAV (including income) has followed a narrowing trend since touching a three-year wide point of 17.3% in early July 2016, shortly after the UK’s EU referendum, when higher investor risk aversion led to a largely indiscriminate widening of investment trust discounts. As illustrated in Exhibit 8, FEV’s discount has ranged from 2.8% to 17.3% over the last three years, and the trust’s current 9.2% discount is narrower than its 11.3% one-year average and close to its 9.0% three-year average.
|
Exhibit 8: Share price discount to NAV (including income) over three years (%) |
|
|
Source: Thomson Datastream, Edison Investment Research |
Capital structure and fees
FEV is a conventional investment trust with a single share class, and currently has 415.2m ordinary shares in issue. Share buybacks were restarted at a modest level in March 2016 (the first since July 2014), but repurchases have been infrequent since October 2016, with only a single repurchase of 150,000 shares made in 2017 to date. The board’s view is that a modest level of gearing can enhance investment returns, and FEV’s normal policy is to employ a low level of gearing via CFDs. At end-June 2017, net gearing was 3.6%. FEV pays an annual management fee of 0.85% of net assets and no performance fee is payable. In FY16, the ongoing charge was 0.99%, a slight increase from 0.94% in the prior financial year. FEV is subject to a two-yearly continuation vote, with the next vote due at the 2019 AGM.
Dividend policy and record
FEV has grown its annual dividend in each year since 2010 (see Exhibit 1) and the current yield of 1.9% is in line with the sector average (see below). Revenue earnings are largely distributed in full, which means that significant reserves are not held to smooth future dividend payments. After payment of the FY16 dividend, revenue reserves at end-2016 currently equate to 1.9p per share. The FY16 dividend was increased by 25.2% to 4.17p per share, partly reflecting the strengthening of the euro against sterling, increasing the value of dividend income in sterling terms. Exceptionally, FY14 benefited from a special dividend of 0.54p per share as a result of the trust recovering £2.3m of French withholding tax and interest.
Peer group comparison
Exhibit 9 shows a comparison of the trusts in the AIC Europe sector, of which FEV is the largest. While FEV’s NAV total returns are below the peer group average over all periods shown, we note that it is ahead of the benchmark over three and 10 years, and only modestly lower over five years (see Exhibit 6), while its defensive bias tends to moderate performance in both rising and falling markets. FEV’s discount is moderately wider than average and its gearing is modestly lower than the average, while its ongoing charge is slightly above the average. Similar to the majority of the trusts in the peer group, FEV does not have a performance fee. Its dividend yield is close to the peer group average.
Exhibit 9: AIC Europe sector peer group as at 9 August 2017*
% unless stated |
Market cap £m |
NAV TR |
NAV TR |
NAV TR |
NAV TR |
Discount (ex-par) |
Ongoing charge |
Perf. fee |
Net gearing |
Dividend yield (%) |
Fidelity European Values |
915.5 |
22.6 |
57.4 |
103.1 |
110.6 |
(6.8) |
0.99 |
No |
104 |
1.9 |
BlackRock Greater Europe |
302.6 |
21.5 |
59.0 |
106.2 |
126.8 |
(4.3) |
1.08 |
No |
100 |
1.7 |
European Investment Trust |
392.7 |
36.2 |
46.8 |
102.8 |
50.5 |
(9.3) |
0.63 |
No |
100 |
2.4 |
Henderson European Focus Trust |
296.5 |
27.6 |
63.8 |
139.0 |
176.0 |
3.3 |
0.90 |
Yes |
109 |
1.9 |
Henderson EuroTrust |
243.7 |
26.1 |
66.6 |
130.7 |
170.8 |
(3.7) |
0.88 |
Yes |
100 |
1.8 |
JPMorgan European Growth Pool |
239.1 |
28.2 |
64.3 |
125.8 |
89.4 |
(10.0) |
1.07 |
No |
111 |
2.2 |
JPMorgan European Income Pool |
156.0 |
30.4 |
66.3 |
141.3 |
137.5 |
(7.9) |
1.10 |
No |
112 |
3.0 |
Jupiter European Opportunities |
783.5 |
23.6 |
75.2 |
134.3 |
237.2 |
(2.5) |
0.98 |
Yes |
106 |
0.8 |
Average |
416.2 |
27.0 |
62.4 |
122.9 |
137.3 |
(5.1) |
0.95 |
105 |
2.0 |
|
Rank |
1 |
7 |
7 |
7 |
6 |
5 |
4 |
5 |
4 |
Source: Morningstar, Edison Investment Research. Note: *Performance data to 8 August 2017. TR=total return. Net gearing is total assets less cash and equivalents as a percentage of net assets.
The board
Following Simon Fraser stepping down in May 2017 after 15 years’ service, FEV’s board has comprised five independent non-executive directors. Paul Yates was appointed to the board in March 2017. He has had a long career in investment management, acting as CEO of UBS Global Asset Management (UK) between 2001 and 2005, and is a director of Aberdeen Diversified Income and Growth Trust and The Merchants Trust. In December 2016, FEV announced the appointment of Fleur Meijs, effective 1 September 2017, which will expand the board to six directors. She is a chartered accountant and a director of Invesco Asia Trust. Vivian Bazalgette was appointed as a director in December 2015 and he assumed the role of chairman in May 2016. The other directors and their dates of appointment are senior independent director James Robinson (June 2007), Robin Niblett (January 2010) and Marion Sears (January 2013).
|
|
Therapix reported H117 results and provided a company update in which it announced that the planned development program for sublingual ultra-low dose THC (THX-ULD01) will focus on the treatment of traumatic brain injury (TBI). The program is planned to enter a Phase I pharmacokinetic study in Q417, expected to take one month to complete. The company also reported that the Phase IIa Tourette’s study of THX-TS01 was going smoothly and eight (of 18) patients have completed the trial, seven of whom opted to remain on the drug.