Last close As at 05/08/2026
GBP17.92
▲ 6.00 (0.34%)
Market capitalisation
GBP501m
Research: TMT
XP entered FY20 with a strong order backlog, having managed the business through a number of issues in FY19. The COVID-19 virus represents a new challenge for the company – changes to the supply chain and the shift of some manufacturing to Vietnam should help to mitigate the risks. We have reduced our FY20 forecasts to reflect short-term supply chain issues. Longer term, it remains to be seen if the virus will have a more material impact on customer demand.
XP Power |
A testing year |
FY19 results |
Tech hardware & equipment |
3 March 2020 |
Share price performance
Business description
Next events
Analyst
XP Power is a research client of Edison Investment Research Limited |
|||||||||||||||||||||||||||||||||||||||||||||
XP entered FY20 with a strong order backlog, having managed the business through a number of issues in FY19. The COVID-19 virus represents a new challenge for the company – changes to the supply chain and the shift of some manufacturing to Vietnam should help to mitigate the risks. We have reduced our FY20 forecasts to reflect short-term supply chain issues. Longer term, it remains to be seen if the virus will have a more material impact on customer demand.
Year end |
Revenue (£m) |
PBT* |
Diluted EPS* |
DPS |
P/E |
Yield |
12/18 |
195.1 |
41.2 |
172.8 |
85.0 |
17.4 |
2.8 |
12/19 |
199.9 |
33.2 |
145.5 |
91.0 |
20.6 |
3.0 |
12/20e |
209.2 |
38.9 |
163.6 |
95.0 |
18.1 |
3.2 |
12/21e |
218.2 |
42.8 |
179.1 |
99.0 |
16.8 |
3.3 |
Note: *PBT and EPS are normalised, excluding amortisation of acquired intangibles, exceptional items and share-based payments.
FY19: Responding to a number of issues
FY19 was a challenging year for XP – trade tariffs imposed between the US and China, a cyclical downturn in the semiconductor market, component price inflation and short-term issues with an ERP upgrade resulted in a decline in normalised operating margins of 4pp to 18% and the first decline in earnings since 2012 (-16% on a normalised basis). As a result of lower than expected tax and finance costs, normalised EPS was slightly ahead of our forecast. Reduction of working capital contributed to strong operating cash flow which resulted in a decline in net debt (pre-leases) of 21% y-o-y. The final dividend of 36p was in line with our forecast.
Virus challenges ability to meet customer demand
Positive design win activity in FY19, combined with order growth of 8% y-o-y (Q4 +4.5% q-o-q, +29.5% y-o-y), demonstrate good demand for XP’s products. XP responded to the issues above by shifting more production to Vietnam and investing in its supply chain team. Now faced with the challenge of the COVID-19 virus, XP is working hard to get its Chinese facility back up to full strength and deliver customer orders. We expect some pushout of Q1 revenues due to COVID19 and we have reduced our FY20 forecasts marginally to reflect this. Longer term, it remains to be seen if demand will be affected by the virus.
Valuation: Uncertainty weighing on share price
As early signs of semiconductor sector recovery emerged, the share price bounced from a low of 2,010p in August 2019 to a peak of 3,820p in January before COVID19 worries started to weigh. On a P/E basis, XP continues to trade at a material discount to global power converter companies and a smaller discount to UK electronics companies, despite generating EBIT margins at the top end of the peer group. Until there is more clarity on the longer-term global economic implications of COVID-19, we would expect the shares to tread water. However, we highlight that XP has a strong backlog and if demand is not materially impacted, it is well-positioned to grow revenues and margins through the course of FY20.
Investment summary
Company description: Power control solutions for industry
XP Power designs, manufactures and distributes power converter solutions to original equipment manufacturers (OEMs) in the healthcare, technology and industrial markets. The group has its headquarters in Singapore and, to remain close to its global customer base, has a sales, design and engineering presence in the US, Europe and Asia. Unlike many in the industry, XP is vertically integrated; its manufacturing facilities in Asia and the US allow the company to maintain quality control, improve flexibility, reduce product costs and minimise lead times.
Financials: Battling headwinds; order intake rebounds
In FY19 XP reported 2.5% revenue growth (-4% on an organic basis); while demand remained robust from industrial, healthcare and technology customers, the cyclical downturn in the semiconductor sector reduced demand from semiconductor equipment manufacturers. Gross and operating margins were lower year-on-year reflecting trade tariffs, product mix, higher component costs, and investment in engineering and supply chain teams. Strong operating cash flow reduced net debt by 21% y-o-y. Although order intake rebounded in Q419, we have reduced FY20 forecasts marginally to reflect supply chain issues caused by COVID-19. We forecast EPS growth of 14% in FY20e and 8% in FY21e.
Exhibit 1: Changes to forecasts
Normalised EPS (p) |
PBT (£m) |
EBITDA (£m) |
|||||||
Old |
New |
% chg. |
Old |
New |
% chg. |
Old |
New |
% chg. |
|
2019 |
143.1 |
145.5 |
1.6 |
34.3 |
33.2 |
(3.2) |
46.5 |
45.4 |
(2.3) |
2020e |
169.3 |
165.9 |
(2.0) |
40.5 |
38.9 |
(3.9) |
53.1 |
51.3 |
(3.4) |
2021e |
N/A |
179.1 |
N/A |
N/A |
42.8 |
N/A |
N/A |
55.3 |
N/A |
Source: XP Power, Edison Investment Research
Valuation: Uncertainty weighing on share price
As evidence emerged that the semiconductor sector was starting to recover, XP’s share price recovered from a low of 2,010p in August 2019 to a peak of 3,820p in January 2020 before COVID-19 worries started to weigh on XP and the wider stock market. On a P/E basis, XP is trading at a material discount to global power converter companies and a smaller discount to UK electronics companies, with a dividend yield at the top end of the range. This is despite the company generating EBITDA and EBIT margins at the top end of the peer group. Until there is more clarity on the longer-term implications of COVID-19 for the global economy, we would expect the shares to tread water. However, we highlight that the company has a strong backlog and if demand is not materially affected, XP is well-positioned to grow revenues and margins through the course of FY20.
Sensitivities: Cyclicality, competition, currency
XP Power has cyclical exposure to global industrial, technology, semiconductor and healthcare markets and is therefore sensitive to end-demand and product development expenditure in these markets. Visibility of customer volumes is limited and, as such, individual customer orders can be volatile. With the majority of XP’s revenues, manufacturing costs and opex US dollar-denominated, currency will continue to add volatility to XP Power’s reported revenues, although it will have less impact at the net income level. XP competes with large, global industrial companies as well as low-cost Asian manufacturers, XP also has more limited exposure to the euro/sterling exchange rate; to minimise this the company enters into forward contracts.
Company description: Power control solutions
XP Power designs, manufactures and distributes power converter solutions to OEMs in the industrial, healthcare, semiconductor and technology markets. Power converters take the high-voltage alternating current output from the mains supply and convert it into various lower-voltage, stable direct current outputs that are required to drive most electronic equipment. The company has transitioned from being a distributor to designing and manufacturing the majority of its products. In 2015, XP made two acquisitions, EMCO and a South Korean distributor, for £9.1m. In 2017, it acquired Comdel for £18.8m and in 2018, it acquired Glassman for £31.8m. XP’s headquarters are in Singapore and it has volume manufacturing facilities in China and Vietnam and specialist high-voltage, high power and radio frequency (RF) power product manufacturing in the US.
Background: Specialist designer and manufacturer
XP Power was formed as a specialist distributor of power converters in 1988 and listed on the LSE in 2000. In 2002, the board decided to begin developing its own IP and designs, and bought Switching Systems International (US), which designed its own configurable power converters with an outsourced manufacturing model. Since then XP has continued to develop its own products and brand, built out manufacturing capacity in China and Vietnam and completed the transition from distributor to designer and manufacturer. Recent acquisitions have expanded XP’s product range from low-power AC/DC and DC/DC converters to include high-voltage, low-power converters (EMCO), RF (radio frequency) power products (Comdel) and high voltage, high power products (Glassman). XP sells through 27 sales offices and multiple distributors across Europe, Asia and North America and has engineering service functions in Northern California, Germany, Singapore and the UK. FY19 revenues were generated in N. America (58%), Europe (32%) and Asia (10%).
Powering critical systems across diverse end markets
XP is focused on developing tailored products for applications with high reliability requirements in the technology, industrial, semiconductor and healthcare equipment markets. It avoids developing commodity products for high volume consumer electronics applications. Products in each end market can have very different lifecycles. For example, a medical device could have a product life cycle of 10 years or more. Once a power converter is designed into this product, it is likely to remain in it for the full life of the product. On average, the product life cycle is five to seven years. XP’s balanced mix of end-customers means it has a fairly high level of revenues that are recurring and exposure to multiple end markets mitigates the risk of individual industry cyclicality.
|
Exhibit 2: XP Power business model video |
|
|
Source: XP Power |
XP’s focus is on growing the proportion of own-IP, own-manufactured products. This provides control over the quality and cost of product and allows XP to provide customers with tailored solutions. The company operates across two business lines:
■
Own-manufactured product (c 80% of revenues). Products designed by XP, ownership of 100% of the IP and manufactured in its Chinese, Vietnamese or US facilities. This includes engineered solutions where XP Power supplies are customised for specific customer end-product design requirements, namely designing and engineering additional casings, metalwork, circuitry, connectors.
■
Labelled products (c 20%). Customer requirements identified and product design specified by XP, but products sourced from third-party manufacturers and labelled under the XP brand.
In-house manufacturing well established
The company is vertically integrated; it manufactures power converters and magnetic components in two locations, China and Vietnam, with smaller US facilities acquired through the EMCO, Comdel and Glassman deals.
Majority of manufacturing in Asia
XP’s first manufacturing facility was built in Kunshan, China in 2006. In addition to making power converters at this facility, XP also produces magnetic components for prototyping and short lead-time contracts.
To reduce XP’s exposure to rising Chinese labour costs and gain more control over the manufacturing process, XP expanded manufacturing into Vietnam, at a site near Ho Chi Minh City. The first phase was completed in 2011 and started with the production of magnetic components – these have a high labour component, hence the decision to manufacture them in a lower labour cost country. XP now manufactures virtually all of its magnetics requirements in-house.
In 2014, the facility also started manufacturing power converters, starting with some of the less complex converters. In early 2019, construction of a second facility was completed (Vietnam II, a similar size to Vietnam I).
Exhibit 3: Capacity and utilisation of facilities
Revenue capacity ($m) |
2019 utilisation (%) |
|
China |
100 |
50% |
Vietnam I |
70 |
70% |
Vietnam II |
130 |
0% |
Source: XP Power
Shifting volumes to Vietnam
To take advantage of the increased capacity in Vietnam, XP was already in the process of moving production of less complex power converters (sub 1.5kW) from China to Vietnam. With US tariffs on the import of components manufactured in China rising from 10% to 25% in Q219, XP accelerated this shift.
The Vietnam facility is now capable of manufacturing more than 2,000 different products and we expect volumes produced in Vietnam to continue to increase as more customers qualify the facility. The facility can, or will be able to, manufacture low-voltage/low-power, high-voltage/low-power and RF products as well as provide engineering services.
The company intends to maintain its China facility, as this is used for some of the more complex converters and is also useful for the production of converters for Chinese customers, who will otherwise incur tariffs on products imported from the US.
Maintaining some specialist facilities in the US
Through the three US acquisitions, XP has facilities in the US for the more complex high voltage, high power and RF products. As EMCO, Comdel and Glassman products are typically more complex than XP’s low-power products (and therefore higher value), it makes sense to retain some of the specialist expertise of the US-based manufacturing facilities. The company has decided to restructure the manufacture of low-power, high-voltage DC-DC modules from EMCO’s Minden facility in Nevada to Vietnam; this facility will be closed by June 2020. XP expects to save c £4m pa once the transition is complete (of which it expects to reinvest £1–2m to expand the new product introduction team), with expected one-off costs of £1–2m. The two remaining US facilities are:
■
Comdel: a 60,000 square feet manufacturing facility in Gloucester, Massachusetts. The component manufacturing for Comdel’s products is outsourced within the US and thefinal assembly and test is performed in the Comdel facility.
■
Glassman: has a manufacturing facility in New Jersey.
Adapting to cope with the spread of COVID-19 virus
With c 20% of products manufactured in China, the measures taken by the Chinese government to minimise the spread of the COVID-19 virus are having an impact on XP’s ability to manufacture and deliver products from China. We note the Chinese facility is located in Kunshan, Jiangsu province, and is 800km east of Wuhan.
The main issues to be managed include:
■
Delayed start to work post Lunar New Year: provincial governments delayed the return to work after the Lunar New Year. XP had expected work at its Kunshan facility to restart on Monday, 3 February but it was delayed until 17 February.
■
Availability of staff: certain regions of China imposed strict quarantine rules, preventing staff returning to work after Lunar New Year. The facility is currently running at reduced capacity and does not expect to reach full capacity until mid March at the earliest, when it is hoped all staff will have been able to return. Vietnam is operating as usual.
■
Availability of raw materials: as movement of components around the country is severely restricted, it is more difficult to maintain adequate inventories of raw materials and components required in the manufacturing of converters (and to some extent, to supply the same to the Vietnamese facilities). The company is building new supplier relationships outside of China where possible. However, management notes that the availability of labour is the bigger issue.
■
Ability to ship finished products: the company is having difficulties shipping finished product from China to other countries as access to air freight has been limited.
The company currently has a backlog of production orders to catch up (as yet, there is no impact on demand), and this is likely to result in revenues slipping from Q120 to Q220.
Where possible, XP is shifting production from China to Vietnam. In some cases, customers require qualification of the new facility, although the problems in China are causing some customers to expedite or drop this requirement entirely.
Growth strategy
XP’s strategy to drive revenue and profitability growth and to gain market share has been in place and has evolved over a number of years. The current strategy aims to:
■
develop a market-leading range of competitive products, organically and through selective acquisitions;
■
target accounts where XP can add value;
■
increase vertical penetration of target accounts;
■
build a global end-to-end supply chain that balances high efficiency with market-leading customer responsiveness; and
■
lead the industry on environmental matters.
In 2019, XP Power undertook a strategy review and decided to implement the following measures:
■
Upgrade key talent: to ensure the capabilities needed to scale the business are in place. This includes setting up an end-to-end global supply chain team.
■
Focus product development: on the appropriate product segments. Focus more resources on higher power products and less on the low-voltage/low-complexity market (which can be addressed via third parties).
■
Enhance product lifecycle management: from capture of requirements, through to concept and feasibility, development, production and eventually end of life.
■
Upgrade systems and processes: use the upgraded ERP system as a platform for robust control and excellent customer service and responsiveness.
Acquisitions fill out the product range
Historically, XP designed and manufactured low-power AC/DC converters, supplying voltages up to 120V, with the majority of products sold supplying voltages up to 48V. As competition from low-cost Asian suppliers has increased, XP has started moving along the complexity scale. While it has invested in engineering resource to develop higher-voltage products, it has made the majority of major product additions via acquisition as it is a much faster route.
In 2015, XP bought EMCO to add high-voltage, low-power converters to its range. EMCO’s DC/DC converters can supply voltages up to 40kV, with the majority of products in the 5–12kV range.
In 2017, XP acquired Comdel to add RF power solutions. Comdel designs RF power supplies, DC power supplies, impedance matching networks, multi-channel synthesisers and electrostatic chuck power supplies. It supplies standard, modified and custom products – due to the complexity of the products we understand there is a higher proportion of custom work compared to XP’s product range. Its RF power supplies are sold to the semiconductor production equipment (SPE), thin film, photovoltaics and induction heating industries.
In 2018, XP acquired Glassman1 to add high-voltage, high-power products. Typically, its products are used in equipment involved in the ionisation and acceleration of particles – applications include semiconductor production equipment, vacuum/plasma processing, analytical instrumentation, medical diagnostic and test equipment. Glassman has a very comprehensive standard product portfolio and can also provide custom solutions.
Rounding out the portfolio, May 2018
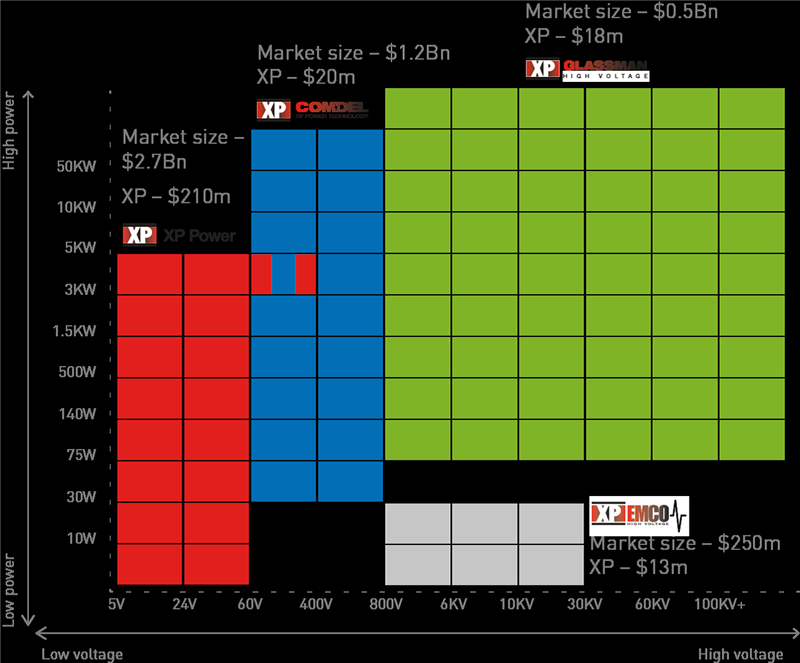
The chart below shows how the acquisitions have filled out XP’s product range and highlights the addressable markets for the main product types. The three acquisitions expanded XP’s total addressable market by nearly $2bn.
We believe XP has made the major acquisitions required to build out its product portfolio. We expect management to focus on integrating the recent acquisitions and maximise the cross-selling potential of those deals. In terms of future M&A, we expect the company to take an opportunistic approach, making bolt-on acquisitions to add to its product or sector offerings.
|
Exhibit 4: Product map and addressable markets |
|
|
Source: XP Power |
Developing more custom capability; expanding engineering services
XP aims to have the most comprehensive and up-to-date product range in its target markets. The company introduced 32 new product families in 2019 (versus 27 in 2018). In 2019, XP spent £17.1m on R&D (pre-capitalisation and amortisation), up 16% from the £14.7m spent in 2018.
XP splits its R&D activities between developing new standard products and developing modifications to existing products to meet specific customer requirements. With competition tending to come from Asian manufacturers of low-complexity converters, the company is focused on serving customers with more complex requirements and undertakes custom design work for large customers. It is moving up the value chain by providing engineering solutions that make it easier for the customer to integrate power solutions into their critical systems. XP has built up its engineering services teams globally to provide this face-to-face support during the design process, and has engineering solutions teams in Europe, North America and Asia. In 2019, the company closed a design centre in Fyfield, UK, as it was predominantly focused on low-power, low-voltage product.
Targeting key accounts: New and existing
XP Power has more than 5,000 direct active customers, of which no customer makes up greater than 10% of revenues and no single project makes up more than 3% of revenues. In 2019, the top 30 customers made up 49% of revenues. XP Power supplies power converters to four key markets: industrial, healthcare, semiconductors and technology (see Exhibit 5).
Exhibit 5: End market breakdown
Sector |
FY19 revenue split |
Types of products |
Industrial |
44.6% |
Factory automation, automated test equipment, industrial control, 3D printing, test and measurement, instrumentation, hazardous environments, defence, avionics. |
Healthcare |
23.0% |
Medically approved power solutions for use in patient vicinity applications and in the lab environment, including homecare devices, highly efficient convection-cooled designs for low-noise patient area devices and defibrillator-proof DC/DC converters for applied part applications. |
Semiconductors |
18.7% |
Semiconductor production equipment. |
Technology |
13.7% |
Audio visual broadcast equipment, mobile and wireless communications, computing and data processing. |
Source: XP Power
Leverage approved supplier status
XP’s in-house manufacturing helps it sign up blue-chip customers, particularly in the medical equipment and semiconductor equipment markets. Stable and secure power supply is so crucial to the operation of these customers’ products that they demand complete control over their supply chain and product manufacture to ensure quality. XP has achieved approved or preferred supplier status at a large number of customers, including all of the main healthcare equipment companies, and is now working to expand its share of business at each customer.
Cross-selling from acquisitions
The three recent acquisitions have increased the potential for cross-selling. As XP’s AC/DC converters often provide the DC input for high-voltage DC/DC converters, there is good cross-selling potential for EMCO. Roughly 95% of Comdel’s revenues and 70% of Glassman’s revenues are generated from the semiconductor production equipment sector. In this market XP, Comdel and Glassman have some customers in common, but they do not overlap in terms of products sold. XP is keen to achieve wider vertical penetration at key accounts now it has the full range of power solutions.
Focus on operational excellence
XP has generated gross margins above 45% and operating margins around 20% since 2010, showing how efficiently the business has been run since shifting to the design and manufacture business model. The company continually looks at ways to maintain and improve this performance. This includes the focus on lean manufacturing, as well as improvements to internal processes to enable the company to share information internally more effectively and provide better customer service. In 2018, XP started upgrading its SAP ERP software to SAP S/4 Hana, initially in existing sales operations and the manufacturing facility in Sunnyvale, California. The company is planning to roll it out to the manufacturing facilities in Asia and the acquired facilities in the US.
High-efficiency products support ‘green’ credentials
XP is a full member of the Responsible Business Alliance. XP incorporated green technologies into the Vietnamese facility and received the Gold Plus rating by the Singapore Building and Construction Authority (BCA) for non-residential buildings in tropical climates. Having manufacturing facilities and products that meet high environmental standards helps XP to win approved supplier status with large OEMs, but its main ongoing contribution to sustainability is to design ever-more efficient power converters.
For example, a 95%-efficient product such as the CCM250 only wastes 5% of the input energy, thereby requiring a lower power input to achieve the same output as a device operating at a lower efficiency. The wasted power is often converted to heat, which in turn requires additional power or physical heat sinks to provide cooling, adding to the upfront and running costs of the product. The company expects that legislation will become more stringent regarding the efficiency requirements for power converters. Of the 32 new products introduced in the year, 25 were high-efficiency designs. Revenues generated from ‘XP Green Power’ products totalled £43.2m in FY19, 22% of group revenues.
In addition, the company sees increasing opportunities to provide solutions for renewable energy systems and controllers, and it is already supplying the smart grid market.
Market performance and outlook
Exhibit 6 shows the split of revenues by geography and end market over the last two years and the video in Exhibit 7 below describes in more detail the end markets that XP Power serves.
■
Industrial sector: this is the most fragmented market, with very few customers in XP’s top 30. This sector grew 7% y-o-y in FY19 (3% constant currency). Areas of strength include industrial and 3D printing, smart grid, analytical instruments and robotics.
■
Healthcare sector: XP has corporate approvals from all of the major healthcare companies. Revenue growth from this sector was 5% in FY19 (1% constant currency). This is the least cyclical end market.
■
Semiconductor manufacturing sector: this sector had already started to weaken in H218 and XP saw a 21% revenue decline in FY19 (25% constant currency). The company saw the low point in H119 and started seeing signs of order recovery in Q419. Despite its cyclicality, the company views this as a structural growth sector due to demand for chips from applications such as artificial intelligence (AI), internet of things (IoT) and 5G.
■
Technology sector: typical applications include broadcast, high-end communications including satellite and telecom base stations, and high-end computing. Programmes can be quite large but tend to have shorter lifetimes than the other sectors. Revenues from this sector grew 34% in FY19 (29% constant currency), helped by the re-emergence of a large programme for test equipment in Asia which had been dormant for several years.
Exhibit 6: Geographic and end market revenue split (£m)
Europe |
FY18 |
FY19 |
y-o-y |
Asia |
FY18 |
FY19 |
y-o-y |
Semi manufacturing |
0.5 |
0.4 |
(20.0%) |
Semi manufacturing |
0.7 |
0.4 |
(42.9%) |
Technology |
6.2 |
6.2 |
0.0% |
Technology |
1.2 |
6.8 |
466.7% |
Industrial |
43.2 |
45.8 |
6.0% |
Industrial |
9.9 |
10.1 |
2.0% |
Healthcare |
11.2 |
12 |
7.1% |
Healthcare |
3.1 |
2.7 |
(12.9%) |
Total |
61.1 |
64.4 |
5.4% |
Total |
14.9 |
20.0 |
34.2% |
N. America |
Group |
||||||
Semi manufacturing |
46.2 |
36.6 |
(20.8%) |
Semi manufacturing |
47.4 |
37.4 |
(21.1%) |
Technology |
13.0 |
14.4 |
10.8% |
Technology |
20.4 |
27.4 |
34.3% |
Industrial |
30.6 |
33.3 |
8.8% |
Industrial |
83.6 |
89.2 |
6.6% |
Healthcare |
29.3 |
31.2 |
6.5% |
Healthcare |
43.6 |
45.9 |
5.3% |
Total |
119.1 |
115.5 |
(3.0%) |
Total |
195.1 |
199.9 |
2.5% |
Source: XP Power
|
Exhibit 7: Video of markets served |
|
|
|
Source: XP Power |
Long-term growth drivers
Key drivers of market growth include:
■
Regulation: legislation and consumer pressure are driving OEMs to reduce the power consumption of their products. Legislation also extends to the efficiency of power converters, driving demand for new products. XP’s new products are designed to maximise efficiency.
■
Healthcare: as the population ages while continuing to grow overall, people are living longer with chronic diseases, driving overall healthcare spending.
■
Technology: several trends are driving demand for processing power and memory, including IoT, AI, big data, blockchain, augmented and virtual reality, and autonomous vehicles. It is possible that the growth of each of these technologies in parallel could reduce the cyclicality of the semiconductor industry.
■
Alternative energy: technologies are evolving for lighting (eg LEDs) and power generation (eg solar, wind), which all have specific power conversion needs.
■
Innovation: customers increasingly need to differentiate their products from the competition. XP’s in-house design capabilities enable it to develop products for niche applications.
|
Exhibit 8: Video of market drivers |
|
|
Source: XP Power |
Short-term outlook
The strength of the industrial market depends on the health of the global economy. 2018 and 2019 have seen generally declining manufacturing Purchasing Managers’ Index (PMI) data. An exception was the bounce for the UK in March 2019 when many companies built inventory in anticipation of Brexit. Germany, the Eurozone and the UK have been below the 50 level (ie the level that implies expansion rather than contraction) for the last year, although the most recent data show that data are moving in the right direction. Conversely, the US and France remain above 50.
|
Exhibit 9: Manufacturing PMI data – January 2018 to January 2020 |
|
|
Source: IHS Markit |
According to Gartner, the global IT market grew just 0.5% in 2019 and is forecast to grow 3.4% in 2020 and 3.7% in 2021. The semiconductor market is forecast to grow 5.9% in 2020, after an estimated 12.8% decline in 2019 (source: WSTS). After a long run of growth for the semiconductor equipment market (2016 +8.7%, 2017 +35.6%, 2018 +9.6%), the trade organisation SEMI estimates that the market declined 10.5% in 2019 as chip manufacturers cut their capex budgets. SEMI expects a recovery in 2020, with growth of 5.5%, accelerating to 9.8% in 2021. We note that these forecasts were all prior to the emergence of COVID-19.
The healthcare technology market is expected to show steady growth in the low, single-digit percentage range. GE Healthcare estimates that the market for ultrasound, imaging and life care solutions was worth $31bn in 2018 and is forecast to grow at a rate of 3–4% pa from 2019 to 2022. The shorter-term performance from the major healthcare equipment manufacturers mirrors this. In 2019, GE Healthcare saw a 4% organic increase in orders and a 3% organic increase for Q419. Philips saw like-for-like revenue and order growth of 3% in Q419, like-for-like revenue growth of 4.5% and order growth of 3% in 2019. Siemens Healthineers saw like-for-like revenue growth of 5% and order growth of 13% in Q120 (calendar Q419) and expects revenue growth of 5–6% for FY20.
Competitive positioning
XP sees the following addressable markets for its products:
■
Low power/low voltage and low power/high voltage: $3.25bn market of which XP has a c 5.4% share. The share looks relatively low as XP does not operate in the high-volume, low-value commodity power converter markets that supply products such as PCs, laptops and cell phone chargers, or in the market for inverters used for renewable energy;
■
RF power: c $1.2bn market of which XP has a c 1% share; and
■
High voltage, high power: c $500m market of which XP has a 2.3% share.
The low market shares that XP has in each area highlights the opportunity the company has to grow revenues by increasing vertical penetration with existing customers as well as signing up new customers. Exhibit 10 summarises the main competitors in each of the product areas that XP operates in. In the low-power, low-voltage market, XP competes most often with TDK-Lambda and Mean Well as well as with a number of local Asian suppliers.
In September 2019, Advanced Energy Industries completed the acquisition of Artesyn Embedded Technologies’ Embedded Power business for $400m, giving the company access to Artesyn’s range of low-voltage power converters targeted at the datacentre, 5G wireless infrastructure, industrial and medical markets.
Exhibit 10: Competition by product type
Low voltage |
High voltage |
RF power |
Advanced Energy Industries |
Cosel |
Crane Co |
COMET Holding |
Delta Electronics |
Matsusada Precision |
MKS Instruments |
Mean Well |
Spellman High Voltage Electronics |
TRUMPF Huettinger |
TDK Lambda (TDK Corporation) |
Source: Edison Investment Research
Sensitivities
XP Power is a global electronics company supplying a broad range of end markets. The company is not immune to economic slowdown, but diversification and the low-cost structure afford XP some earnings resilience versus competitors.
■
Economic sensitivity: the group has cyclical exposure to global industrial, technology and healthcare markets. Therefore, any slowdown in end-demand in these markets or cutbacks in product development expenditure will have an impact on XP’s revenues.
■
Order book visibility: the group has around four months of order book visibility at any one time. Therefore, visibility of customer volumes is limited and, as such, individual customer orders can be volatile.
■
Currency: around 84% of XP’s revenues, c 98% of cost of sales and c 70% of opex are US dollar-denominated. XP Power reports in sterling, exposing the company’s results to fluctuations in the US$/£ exchange rate. While moves in the exchange rate will have an effect on reported revenues, the overall impact of currency at the net income level is much less pronounced. To minimise the effect, the company enters into forward contracts.
■
Large competitors: competition ranges from significantly larger players with big balance sheets through to smaller innovative companies. The deeper pockets of large competitors may make it more difficult for XP to keep pace with product development.
■
Geopolitical risks: with manufacturing facilities in China and Vietnam, the company is exposed to risks relating to the governments of those countries eg regulation, tariffs. In addition, the recent emergence of COVID-19 in China has highlighted how exposed the global manufacturing industry is to disruptions to the supply chain in Asia.
Financials
Review of FY19 results
Exhibit 11: FY19 results highlights
(£m) |
FY18 |
FY19e |
FY19 |
Diff |
y-o-y |
Revenues |
195.1 |
200.4 |
199.9 |
(0.2%) |
2.5% |
Gross profit |
92.3 |
89.0 |
90.1 |
1.2% |
(2.4%) |
Gross margin |
47.3% |
44.4% |
45.1% |
0.6% |
(2.2%) |
EBITDA |
49.2 |
46.5 |
45.4 |
(2.3%) |
(7.7%) |
EBITDA margin (%) |
25.2% |
23.2% |
22.7% |
(0.5%) |
(2.5%) |
Normalised operating profit |
42.9 |
37.5 |
35.9 |
(4.2%) |
(16.3%) |
Normalised operating profit margin (%) |
22.0% |
18.7% |
18.0% |
(0.8%) |
(4.0%) |
Reported operating profit |
39.3 |
31.2 |
26.7 |
(14.4%) |
(32.1%) |
Reported operating margin (%) |
20.1% |
15.6% |
13.4% |
(2.2%) |
(6.8%) |
Normalised PBT |
41.2 |
34.3 |
33.2 |
(3.2%) |
(19.4%) |
Reported PBT |
37.6 |
28.0 |
24.0 |
(14.3%) |
(36.2%) |
Normalised net income |
33.7 |
27.9 |
28.4 |
2.0% |
(15.7%) |
Reported net income |
30.2 |
22.7 |
20.5 |
(9.7%) |
(32.1%) |
Normalised basic EPS (p) |
176.1 |
145.9 |
148.3 |
1.6% |
(15.8%) |
Normalised diluted EPS (p) |
172.8 |
143.1 |
145.5 |
1.6% |
(15.8%) |
Reported basic EPS (p) |
157.8 |
118.9 |
107.0 |
(10.0%) |
(32.2%) |
Dividend per share (p) |
85.0 |
91.0 |
91.0 |
0.0% |
7.1% |
Net debt/(cash) pre lease liabilities |
52.0 |
41.5 |
41.3 |
(0.6%) |
(20.6%) |
Source: XP Power, Edison Investment Research
XP reported revenue growth of 2.5% for FY19 (down 2% on a constant currency basis, down 4% on a like-for-like basis). The company had already disclosed that short-term issues with the ERP upgrade had reduced revenues by c £5m in Q419. Gross profit declined by 2.4% y-o-y, due to a number of factors including product and geographic mix, higher component costs (already flagged as the company stocked up on long-lead time components from H218), and currency fluctuations. While the tariffs between the US and China initially hit margins, by the end of FY19 XP had managed to get customers to cover 90% of tariffs, limiting the impact on gross margins to 60bp.
Normalised operating profit was 4% lower than our forecast, resulting in an operating margin of 18% compared to 22% a year ago. The company incurred one-off costs totalling £6.0m versus our £2.6m forecast, resulting in reported operating profit 14% below our forecast. One-off costs break down as £0.9m for acquisitions, £2.2m for the ERP upgrade, £1.9m in legal costs and £1.0m for the transfer of manufacturing from Nevada to Vietnam.
Net finance cost of £2.7m was below our £3.2m forecast. The reported tax rate of 13.3% on reported PBT was lower than our 18% assumption due to one-off credits related to prior year tax assessments in the US. The normalised tax rate of 13.6% was also lower than expected. Lower than expected tax and net finance cost outweighed lower normalised operating profit, resulting in normalised diluted EPS 1.6% ahead of our forecast.
XP announced a final quarterly dividend of 36p (vs 33p a year ago) payable on 28 April to shareholders as at 27 March. This resulted in a full year dividend of 91p, in line with our forecast. Dividend cover for the year was 1.2x; the company expects to increase this in future years.
Debt reducing; plenty of headroom for M&A
Operating cash flow of £46.2m was significantly higher than the £26.7m generated in FY18. Through the course of 2019, the company has worked down the high levels of inventory that were in place at the end of FY18, resulting in a £10.6m working capital inflow (FY18: £21.6m outflow). Tangible capex declined as the second Vietnam facility was completed in Q119. Capitalised R&D increased 29% y-o-y to £8m. Capitalised costs for the SAP ERP upgrade increased from £0.9m in FY18 to £3.4m in FY19.
In November 2019, the company increased its revolving credit facility (RCF) from $105m to $120m, with a $60m accordion option. At year-end, it had used $69m of this facility. The RCF incurs interest at Libor plus 1.2% for the used portion, and Libor plus 0.4–0.5% for the unused portion. The company closed the year with a net debt position (excluding lease liabilities) of £41.3m, down from £52.0m at the end of FY18. The year-end net debt/EBITDA ratio was 0.91x, well within the banking covenant level of 3x.
Outlook and changes to forecasts
FY19 was a good year for design wins, which provide visibility for longer-term growth. In addition, bookings started to pick up in H2 as the company started to see signs of recovery from semiconductor equipment manufacturing customers. XP received orders worth £214.9m in FY19 (+8% y-o-y, +4% constant currency, +2% organic), resulting in a book-to-bill of 1.08x for FY19, and in Q4 saw orders up 4.5% sequentially and 29.5% y-o-y. On the margin front, the company expects to see the benefit of the transfer of manufacturing from Nevada to Vietnam from H220.
While the demand environment has improved and the company has taken measures to deal with the US-China trade tariffs, the outlook is clouded by uncertainty over the COVD-19 virus. In our forecasts, we have taken account of the short-term impacts on the supply chain in China. We have not yet assumed any reduction in customer demand, which could be the case if consumer spending drops drastically or customers struggle to obtain components from other suppliers.
As well as introducing FY21 forecasts, we have made the following changes:
■
Revenue: we have assumed that Q120 revenues will be affected by the COVID-19 virus and we have reduced our forecast by £5m in the quarter. We assume that production increases as the Chinese facility returns to normal operation and an element of the Q1 shortfall is caught up later in the year. This results in a 1% cut to our FY20 forecast.
■
Net financial cost: we have reduced this in FY20 to reflect the lower net debt position at the end of FY19.
■
Capex: we have increased our forecast for FY20 reflecting company guidance, in particular for the cost of the ERP upgrade.
Exhibit 12: Changes to forecasts
£'m |
FY20e |
FY20e |
FY21e |
|||
Old |
New |
Change |
y-o-y |
New |
y-o-y |
|
Revenues |
211.0 |
209.2 |
(0.9%) |
4.7% |
218.2 |
4.3% |
Gross profit |
95.8 |
95.0 |
(0.9%) |
5.4% |
100.3 |
5.6% |
Gross margin (%) |
45.4% |
45.4% |
(0.0%) |
0.3% |
45.9% |
0.6% |
EBITDA |
53.1 |
51.3 |
(3.4%) |
13.0% |
55.3 |
7.8% |
EBITDA margin (%) |
25.2% |
24.5% |
(0.6%) |
1.8% |
25.3% |
0.8% |
Normalised operating profit |
43.5 |
41.4 |
(4.8%) |
15.3% |
45.1 |
8.9% |
Normalised operating profit margin (%) |
20.6% |
19.8% |
(0.8%) |
1.8% |
20.7% |
0.9% |
Reported operating profit |
39.8 |
34.2 |
(14.0%) |
28.0% |
41.4 |
21.1% |
Reported operating margin (%) |
18.8% |
16.3% |
(2.5%) |
3.0% |
19.0% |
2.6% |
Normalised PBT |
40.5 |
38.9 |
(3.9%) |
17.1% |
42.8 |
10.0% |
Reported PBT |
36.8 |
31.7 |
(13.8%) |
32.0% |
39.1 |
23.3% |
Normalised net income |
33.0 |
32.3 |
(2.0%) |
13.7% |
34.9 |
8.0% |
Reported net income |
29.9 |
25.7 |
(13.9%) |
25.5% |
31.8 |
23.6% |
Normalised basic EPS (p) |
172.6 |
169.1 |
(2.0%) |
14.0% |
182.5 |
8.0% |
Normalised diluted EPS (p) |
169.3 |
165.9 |
(2.0%) |
14.0% |
179.1 |
8.0% |
Reported basic EPS (p) |
156.6 |
134.8 |
(13.9%) |
25.9% |
166.6 |
23.6% |
Dividend per share (p) |
95.0 |
95.0 |
0.0% |
4.4% |
99.0 |
4.2% |
Net debt/(cash) |
38.7 |
46.9 |
21.4% |
(1.6%) |
38.4 |
(18.1%) |
Net debt/(cash) pre lease liabilities |
33.9 |
42.0 |
24.2% |
1.8% |
35.0 |
(16.7%) |
Source: Edison Investment Research
Valuation
There is a limited number of listed power converter companies, as many businesses are part of larger industrial companies such as TDK or GE. We show below the financial performance of those listed peers as well as a group of UK-listed companies active in the electronics space. XP clearly generates EBITDA and EBIT margins at the top end of the peer group. On a P/E basis, the company is trading at a material discount to global power converter companies and a smaller discount to UK electronics companies, with a dividend yield at the top end of the range.
Exhibit 13: Peer group financial performance
Market |
Share |
Listing |
Rev growth (%) |
EBITDA margin (%) |
EBIT margin (%) |
|||||||||
cap (m) |
price |
CCY |
LY |
CY |
NY |
LY |
CY |
NY |
LY |
CY |
NY |
|||
XP Power |
579 |
3,030 |
GBp |
2.5% |
4.7% |
4.3% |
22.7% |
24.5% |
25.3% |
18.0% |
19.8% |
20.7% |
||
Cosel |
36,998 |
1,036 |
JPY |
4.8% |
-13.5% |
10.9% |
17.3% |
11.4% |
13.7% |
|||||
Delta Electronics |
358,461 |
138 |
TWD |
14.2% |
8.4% |
9.4% |
12.2% |
13.2% |
13.4% |
7.1% |
8.1% |
8.7% |
||
Advanced Energy Industries |
2,280 |
59.5 |
US$ |
9.7% |
64.2% |
7.5% |
15.0% |
14.6% |
16.9% |
13.2% |
12.3% |
15.4% |
||
Comet Holdings |
916 |
118 |
CHF |
-15.3% |
6.3% |
11.8% |
9.2% |
14.6% |
17.4% |
4.2% |
9.4% |
12.1% |
||
CML Microsystems |
57 |
332 |
GBp |
-11.2% |
-1.4% |
-2.7% |
31.1% |
30.9% |
29.6% |
11.4% |
9.3% |
|||
Diploma |
2,129 |
1,880 |
GBp |
12.3% |
9.5% |
4.2% |
18.8% |
19.0% |
19.1% |
17.8% |
17.5% |
17.6% |
||
Electrocomponents |
2,705 |
606.2 |
GBp |
10.5% |
3.9% |
3.1% |
13.2% |
13.4% |
13.8% |
11.7% |
11.3% |
11.8% |
||
Gooch & Housego |
299 |
1,190 |
GBp |
3.4% |
3.1% |
3.0% |
16.6% |
17.2% |
17.9% |
12.6% |
11.7% |
13.2% |
||
TT Electronics |
328 |
199 |
GBp |
11.9% |
3.0% |
4.6% |
11.7% |
11.9% |
12.5% |
8.3% |
8.4% |
8.9% |
||
Average power converter companies |
16.3% |
9.9% |
13.4% |
13.5% |
15.3% |
8.1% |
9.9% |
12.0% |
||||||
Average UK electronics companies |
3.6% |
2.5% |
18.3% |
18.5% |
18.6% |
12.4% |
11.6% |
12.9% |
||||||
Source: Edison Investment Research, Refinitiv (as at 2 March 2020)
Exhibit 14: Peer group valuation metrics
P/E (x) |
EV/EBIT (x) |
Dividend yield |
|||||||
LY |
CY |
NY |
LY |
CY |
NY |
LY |
CY |
NY |
|
XP Power |
20.6 |
18.1 |
16.8 |
14.3 |
17.1 |
14.9 |
3.0% |
3.2% |
3.3% |
Cosel |
17.4 |
59.0 |
22.9 |
2.4% |
1.9% |
2.1% |
|||
Delta Electronics |
16.1 |
17.1 |
14.5 |
16.8 |
14.3 |
19.8 |
3.7% |
3.9% |
4.2% |
Advanced Energy Industries |
24.4 |
17.8 |
13.2 |
14.3 |
10.6 |
10.6 |
0.0% |
0.0% |
0.0% |
Comet Holdings |
97.0 |
36.7 |
24.7 |
26.0 |
18.1 |
0.8% |
1.3% |
1.6% |
|
CML Microsystems |
21.1 |
25.4 |
18.1 |
2.3% |
2.3% |
||||
Diploma |
29.2 |
26.6 |
25.3 |
20.6 |
19.7 |
19.3 |
1.5% |
1.7% |
1.8% |
Electrocomponents |
16.5 |
16.5 |
15.4 |
13.2 |
12.3 |
11.2 |
2.2% |
2.6% |
2.8% |
Gooch & Housego |
25.5 |
24.2 |
22.0 |
20.1 |
17.3 |
16.4 |
1.0% |
1.0% |
1.1% |
TT Electronics |
11.0 |
10.7 |
9.6 |
9.9 |
8.9 |
12.6 |
3.5% |
3.7% |
4.1% |
Average power converter companies |
38.7 |
32.6 |
18.8 |
19.0 |
14.3 |
15.2 |
1.7% |
1.8% |
2.0% |
Average UK electronics companies |
20.7 |
20.7 |
18.1 |
16.4 |
14.5 |
14.9 |
2.1% |
2.3% |
2.4% |
XP vs power converter peers |
-45% |
-11% |
|||||||
XP vs UK electronics peers |
-13% |
-7% |
|||||||
Source: Edison Investment Research, Refinitiv (as at 2 March)
M&A
Advanced Energy Industries acquired the Artesyn Embedded Power business for $400m in 2019. The company noted that this equated to a post-synergies valuation of 5x EBITDA. In 2018, Artesyn generated revenues of $593m and adjusted EBITDA of $55m (adjusted EBITDA margin 9.3%). With targeted annualised synergies of $20m over the first 18–24 months and $40m on a longer-term basis, this implies a medium-term target EBITDA margin of 12.6%, rising to a long-term target of 16%, well below XP’s most recently reported EBITDA margin of 22.7%.
Exhibit 15: Financial summary
£m |
2015 |
2016 |
2017 |
2018 |
2019 |
2020e |
2021e |
||
Year end 31 December |
IFRS |
IFRS |
IFRS |
IFRS |
IFRS |
IFRS |
IFRS |
||
INCOME STATEMENT |
|||||||||
Revenue |
|
|
109.7 |
129.8 |
166.8 |
195.1 |
199.9 |
209.2 |
218.2 |
Cost of Sales |
(55.1) |
(67.8) |
(89.2) |
(102.8) |
(109.8) |
(114.2) |
(118.0) |
||
Gross Profit |
54.6 |
62.0 |
77.6 |
92.3 |
90.1 |
95.0 |
100.3 |
||
EBITDA |
|
|
29.7 |
33.0 |
41.7 |
49.2 |
45.4 |
51.3 |
55.3 |
Normalised operating profit |
|
|
25.9 |
28.8 |
36.4 |
42.9 |
35.9 |
41.4 |
45.1 |
Amortisation of acquired intangibles |
0.0 |
(0.4) |
(0.6) |
(2.8) |
(3.2) |
(3.2) |
(3.2) |
||
Exceptionals |
(0.3) |
(0.4) |
(3.3) |
(0.8) |
(6.0) |
(3.5) |
0.0 |
||
Share-based payments |
0.0 |
0.0 |
0.0 |
0.0 |
0.0 |
(0.5) |
(0.5) |
||
Reported operating profit |
25.6 |
28.0 |
32.5 |
39.3 |
26.7 |
34.2 |
41.4 |
||
Net Interest |
(0.2) |
(0.2) |
(0.3) |
(1.7) |
(2.7) |
(2.5) |
(2.3) |
||
Joint ventures & associates (post tax) |
0.0 |
0.0 |
0.0 |
0.0 |
0.0 |
0.0 |
0.0 |
||
Exceptional & other financial |
0.0 |
0.0 |
0.0 |
0.0 |
0.0 |
0.0 |
0.0 |
||
Profit Before Tax (norm) |
|
|
25.7 |
28.6 |
36.1 |
41.2 |
33.2 |
38.9 |
42.8 |
Profit Before Tax (reported) |
|
|
25.4 |
27.8 |
32.2 |
37.6 |
24.0 |
31.7 |
39.1 |
Reported tax |
(5.5) |
(6.3) |
(3.6) |
(7.2) |
(3.2) |
(5.7) |
(7.0) |
||
Profit After Tax (norm) |
20.2 |
22.3 |
28.8 |
33.9 |
28.7 |
32.5 |
35.1 |
||
Profit After Tax (reported) |
19.9 |
21.5 |
28.6 |
30.4 |
20.8 |
26.0 |
32.1 |
||
Minority interests |
(0.2) |
(0.2) |
(0.3) |
(0.2) |
(0.3) |
(0.3) |
(0.3) |
||
Discontinued operations |
0.0 |
0.0 |
0.0 |
0.0 |
0.0 |
0.0 |
0.0 |
||
Net income (normalised) |
20.0 |
22.1 |
28.5 |
33.7 |
28.4 |
32.3 |
34.9 |
||
Net income (reported) |
19.7 |
21.3 |
28.3 |
30.2 |
20.5 |
25.7 |
31.8 |
||
Basic average number of shares outstanding (m) |
19 |
19 |
19 |
19 |
19 |
19 |
19 |
||
EPS - basic normalised (p) |
|
|
105.3 |
116.2 |
149.4 |
176.1 |
148.3 |
169.1 |
182.5 |
EPS - diluted normalised (p) |
|
|
104.3 |
115.3 |
147.0 |
172.8 |
145.5 |
165.9 |
179.1 |
EPS - basic reported (p) |
|
|
103.7 |
112.0 |
148.3 |
157.8 |
107.0 |
134.8 |
166.6 |
Dividend (p) |
66 |
71 |
78 |
85 |
91 |
95 |
99 |
||
Revenue growth (%) |
8.5 |
18.3 |
28.5 |
17.0 |
2.5 |
4.7 |
4.3 |
||
Gross Margin (%) |
49.8 |
47.8 |
46.5 |
47.3 |
45.1 |
45.4 |
45.9 |
||
EBITDA Margin (%) |
27.0 |
25.4 |
25.0 |
25.2 |
22.7 |
24.5 |
25.3 |
||
Normalised Operating Margin |
23.6 |
22.2 |
21.8 |
22.0 |
18.0 |
19.8 |
20.7 |
||
BALANCE SHEET |
|||||||||
Fixed Assets |
|
|
65.4 |
73.2 |
88.1 |
129.2 |
137.4 |
142.8 |
145.9 |
Intangible Assets |
48.2 |
53.0 |
63.9 |
97.7 |
99.6 |
104.7 |
106.1 |
||
Tangible Assets |
16.1 |
19.1 |
22.5 |
30.7 |
35.9 |
36.2 |
37.9 |
||
Investments & other |
1.1 |
1.1 |
1.7 |
0.8 |
1.9 |
1.9 |
1.9 |
||
Current Assets |
|
|
53.5 |
65.7 |
83.5 |
105.1 |
96.0 |
93.4 |
98.4 |
Stocks |
28.7 |
32.2 |
37.8 |
56.5 |
44.1 |
45.9 |
47.4 |
||
Debtors |
17.5 |
21.5 |
23.8 |
33.0 |
34.8 |
36.1 |
37.7 |
||
Cash & cash equivalents |
4.9 |
9.2 |
15.0 |
11.5 |
11.2 |
5.5 |
7.5 |
||
Other |
2.4 |
2.8 |
6.9 |
4.1 |
5.9 |
5.9 |
5.9 |
||
Current Liabilities |
|
|
(19.8) |
(25.8) |
(25.1) |
(26.8) |
(30.4) |
(31.2) |
(32.0) |
Creditors |
(14.6) |
(16.1) |
(21.4) |
(22.4) |
(25.2) |
(26.0) |
(26.8) |
||
Tax and social security |
(1.2) |
(3.3) |
(3.5) |
(4.2) |
(3.1) |
(3.1) |
(3.1) |
||
Short term borrowings |
(4.0) |
(5.5) |
0.0 |
0.0 |
(1.6) |
(1.6) |
(1.6) |
||
Other |
0.0 |
(0.9) |
(0.2) |
(0.2) |
(0.5) |
(0.5) |
(0.5) |
||
Long Term Liabilities |
|
|
(10.0) |
(6.2) |
(29.6) |
(70.1) |
(64.1) |
(57.6) |
(51.1) |
Long term borrowings |
(4.6) |
0.0 |
(24.0) |
(63.5) |
(57.3) |
(50.8) |
(44.3) |
||
Other long term liabilities |
(5.4) |
(6.2) |
(5.6) |
(6.6) |
(6.8) |
(6.8) |
(6.8) |
||
Net Assets |
|
|
89.1 |
106.9 |
116.9 |
137.4 |
138.9 |
147.3 |
161.2 |
Minority interests |
(0.8) |
(0.8) |
(0.9) |
(1.0) |
(0.7) |
(1.1) |
(1.1) |
||
Shareholders' equity |
|
|
88.3 |
106.1 |
116.0 |
136.4 |
138.2 |
146.2 |
160.1 |
CASH FLOW |
|||||||||
Op Cash Flow before WC and tax |
29.7 |
33.0 |
41.7 |
49.2 |
45.4 |
51.3 |
55.3 |
||
Working capital |
(4.6) |
(6.1) |
0.4 |
(21.6) |
10.6 |
(2.3) |
(2.2) |
||
Exceptional & other |
0.6 |
5.1 |
(6.3) |
3.2 |
(5.3) |
(3.5) |
0.0 |
||
Tax |
(4.7) |
(4.1) |
(6.1) |
(4.1) |
(4.5) |
(5.7) |
(7.0) |
||
Net operating cash flow |
|
|
21.0 |
27.9 |
29.7 |
26.7 |
46.2 |
39.7 |
46.0 |
Capex |
(5.4) |
(6.8) |
(10.1) |
(15.0) |
(16.3) |
(18.5) |
(16.5) |
||
Acquisitions/disposals |
(8.3) |
0.1 |
(18.3) |
(35.4) |
0.0 |
0.0 |
0.0 |
||
Net interest |
(0.1) |
(0.2) |
(0.2) |
(1.5) |
(2.7) |
(2.5) |
(2.3) |
||
Equity financing |
0.0 |
0.2 |
(0.2) |
0.6 |
0.5 |
0.0 |
0.0 |
||
Dividends |
(12.2) |
(13.1) |
(14.2) |
(15.6) |
(17.2) |
(18.0) |
(18.7) |
||
Other |
0.2 |
0.0 |
0.0 |
0.0 |
(1.5) |
(1.5) |
(1.5) |
||
Net Cash Flow |
(4.8) |
8.1 |
(13.3) |
(40.2) |
9.0 |
(0.7) |
7.0 |
||
Opening net debt/(cash) |
|
|
(1.3) |
3.7 |
(3.7) |
9.0 |
52.0 |
41.3 |
42.0 |
FX |
(0.2) |
(0.5) |
0.6 |
(2.7) |
1.7 |
0.0 |
0.0 |
||
Other non-cash movements |
0.1 |
(0.2) |
0.0 |
(0.1) |
0.0 |
0.0 |
0.0 |
||
Closing net debt/(cash) |
|
|
3.7 |
(3.7) |
9.0 |
52.0 |
41.3 |
42.0 |
35.0 |
Source: XP Power, Edison Investment Research
|
|||||||||||||||||||||||||||||||||||||||||||||||
|
|
Research: Financials
MPC Capital expanded its assets under management in FY19 to €4.5bn from €4.3bn in FY18, with the largely inorganic growth in institutional business offsetting the legacy retail business decline. Consequently, the share of higher-margin institutional business is now nearing 80% (vs 60% at end-December 2018). The improved quality of the portfolio resulted in a 9.6% y o y increase in revenues to €46.8m, as well as lower impairments compared to 2018. According to management, the recurring income will not be sufficient to fully offset the decline in retail operations in FY20, and therefore it expects a marginal decline in sales. However, thanks to cost-cutting measures launched in 2019, the pre-tax profit is expected to improve further.