Last close As at 05/08/2026
GBP12.68
▲ 6.00 (0.48%)
Market capitalisation
GBP1,703m
Research: Investment Companies
The Law Debenture Corporation (LWDB) has delivered robust NAV and share price gains in the first half 2019, supported by an upward revaluation of its independent professional services (IPS) business, which continues to grow well in spite of a tougher capital markets backdrop. The managers of LWDB’s investment portfolio have increased net gearing from c 3% to c 7% in order to take advantage of attractive valuations in selected UK equities. While more than 20% of its diversified portfolio is still invested overseas to gain access to opportunities unavailable in the UK, LWDB has recently moved from the AIC’s Global sector to the UK Equity Income sector, where its NAV total returns currently rank it in the top quartile over three, five and 10 years.
Written by
The Law Debenture Corporation |
A robust H119 for trust portfolio and IPS |
Investment trusts |
24 July 2019 |
Share price/discount performance
Three-year performance vs index
Gearing
Analysts
|
|||||||||||||||||||||||||||||||||||||||||||||||||||||||||||||||||||||||||||||||||||||||||||||
The Law Debenture Corporation (LWDB) has delivered robust NAV and share price gains in the first half 2019, supported by an upward revaluation of its independent professional services (IPS) business, which continues to grow well in spite of a tougher capital markets backdrop. The managers of LWDB’s investment portfolio have increased net gearing from c 3% to c 7% in order to take advantage of attractive valuations in selected UK equities. While more than 20% of its diversified portfolio is still invested overseas to gain access to opportunities unavailable in the UK, LWDB has recently moved from the AIC’s Global sector to the UK Equity Income sector, where its NAV total returns currently rank it in the top quartile over three, five and 10 years.
|
Year-on-year revenue growth from all of LWDB’s IPS business areas |
|
|
Source: The Law Debenture Corporation, Edison Investment Research |
The market opportunity
Global equity markets have resumed their upward trajectory after a significant sell-off in Q418, despite growing evidence of a worsening economic backdrop, and little concrete progress on geopolitical worries such as Brexit and the US-led trade war. ‘Value’ stocks have continued to underperform, bucking their longer-term trend (see Exhibit 3), but could hold up better than highly valued growth companies if the current uncertain climate spills over into a further bout of market volatility.
Why consider investing in Law Debenture?
■
Unique structure, with IPS division generating significant income as well as providing future growth potential.
■
Value-biased equity portfolio could perform well if the current extended cycle of growth stock outperformance turns.
■
44-year record of increasing or maintaining its annual dividend.
■
One of the lowest-cost investment trusts in the AIC universe.
Wider-than-average discount; dividend up 10%
At 23 July, LWDB’s shares traded at a 10.2% discount to cum-income net asset value (with both debt and the IPS business at fair value). While narrower than the 16.5% five-year high seen last October, this is above both short- and longer-term averages. The H119 dividend of 6.6p has been increased by 10% year-on-year, reflecting a 32% increase in group revenues for the period and building on a 9.3% year-on-year increase in the FY18 final dividend.
Exhibit 1: Trust at a glance
Investment objective and fund background |
Recent developments |
|||||||||||||||||||||||||||||||||||||||||||||||||||||||||||||||||||
LWDB’s investment objective is to achieve long-term capital growth in real terms and steadily increasing income. The aim is to achieve a higher rate of total return than the FTSE All-Share Index through investing in a diversified portfolio (mainly UK equities with some international holdings). LWDB’s IPS business provides a regular flow of income, which augments the dividend income from the equity portfolio. |
■ 24 July 2019: Results for the six months ended 30 June. NAV TR 10.3% versus 13.0% for the FTSE All-Share Index; share price TR 12.1%. Interim dividend of 6.6p declared, a 10.0% increase on H118 (6.0p). ■ 9 May 2019: LWDB reclassified by the Association of Investment Companies into the UK Equity Income sector. |
|||||||||||||||||||||||||||||||||||||||||||||||||||||||||||||||||||
Forthcoming |
Capital structure |
Fund details |
||||||||||||||||||||||||||||||||||||||||||||||||||||||||||||||||||
AGM |
April 2020 |
Ongoing charges |
0.43% (FY19) |
Group CEO |
Denis Jackson |
|||||||||||||||||||||||||||||||||||||||||||||||||||||||||||||||
Annual results |
February 2020 |
Net gearing |
7.0% (30 June) |
Managers |
James Henderson and Laura Foll, Janus Henderson Investors |
|||||||||||||||||||||||||||||||||||||||||||||||||||||||||||||||
Year end |
31 December |
Annual mgmt fee |
0.30% of portfolio NAV |
Address |
Fifth floor, 100 Wood Street, |
|||||||||||||||||||||||||||||||||||||||||||||||||||||||||||||||
Dividend paid |
September, April |
Performance fee |
None |
|||||||||||||||||||||||||||||||||||||||||||||||||||||||||||||||||
Launch date |
1889 |
Trust life |
Indefinite |
Phone |
+44 (0) 20 7606 5451 |
|||||||||||||||||||||||||||||||||||||||||||||||||||||||||||||||
Continuation vote |
None |
Loan facilities |
£115m long-term debt |
Website |
||||||||||||||||||||||||||||||||||||||||||||||||||||||||||||||||
Dividend policy and history (financial years) |
Share buyback policy and history (financial years) |
|||||||||||||||||||||||||||||||||||||||||||||||||||||||||||||||||||
LWDB aims to deliver steadily increasing dividends, fully covered by earnings, and has a 44-year record of increasing or maintaining its dividend. |
LWDB has no share buyback programme in operation. Purchases and allotment of shares refer to employee share schemes. |
|||||||||||||||||||||||||||||||||||||||||||||||||||||||||||||||||||
|
|
|||||||||||||||||||||||||||||||||||||||||||||||||||||||||||||||||||
Shareholder base (as at 5 March 2019) |
Portfolio exposure by geography (as at 30 June 2019) |
|||||||||||||||||||||||||||||||||||||||||||||||||||||||||||||||||||
|
|
|||||||||||||||||||||||||||||||||||||||||||||||||||||||||||||||||||
Top 10 holdings (as at 30 June 2019) |
||||||||||||||||||||||||||||||||||||||||||||||||||||||||||||||||||||
|
||||||||||||||||||||||||||||||||||||||||||||||||||||||||||||||||||||
Source: The Law Debenture Corporation, Edison Investment Research, Bloomberg, Morningstar
Fund profile: UK-biased trust with unique structure
The Law Debenture Corporation (LWDB) began life in 1889 as a vehicle to facilitate the issuance of corporate debentures. This activity still forms a major part of its independent professional services (IPS) business, which also includes pensions and corporate services (see IPS performance and fair value). The company operates in two distinct parts, with a diversified investment portfolio focused on UK equities making up c 85% of its fair value NAV at 30 June 2019 (end-H119), and c 15% of NAV accounted for by the IPS business. Management of the investment portfolio is delegated to Janus Henderson Investors, where fund managers James Henderson and Laura Foll (who also run the Lowland and Henderson Opportunities investment trusts) aim to achieve long-term capital growth and steadily increasing income from a diversified portfolio of c 140 stocks. Because of the significant contribution of the IPS business to LWDB’s revenues (25% of the total in H119, a lower percentage than in previous years because of the boost to the revenue account of the investment trust from a change in the allocation of management fees between capital and income), the managers have greater flexibility to invest for capital growth, while remaining confident in the trust’s ability to build on its 44-year record of increasing or maintaining its annual dividend.
LWDB has a primarily UK equity portfolio (c 76% of the portfolio at end-H119), with some international exposure to gain access to attractive opportunities that do not have an equivalent in the UK. Because of this, it uses the FTSE All-Share Index as a performance benchmark, and has recently moved from the Association of Investment Companies’ (AIC) Global sector to the UK Equity Income sector. Gearing comes via two tranches of long-term debt and is deployed actively within a working range of 10% net cash to 20% geared. At 30 June 2019, net gearing stood at 7%, an increase from 3% at end-FY18 (31 December).
LWDB is led at the corporate level by Chief Executive Officer Denis Jackson and Chief Financial Officer Katie Thorpe, who are both executive members of the board of directors.
IPS performance and fair value
LWDB presents its IPS business in three divisions: pensions, corporate trusts and corporate services. Overall H119 results for the IPS business built on the growth achieved in FY18 under new CEO Denis Jackson (appointed in January 2018), in spite of a tough market backdrop in several of the businesses’ areas of operation. Revenues for the IPS business were 6.9% higher in H119 than in H118, while profit after tax was up 8.9% as costs were contained to a 6.1% increase, although LWDB continued to invest for growth. For the pensions business, revenues grew by 9.3% in H119 (compared with H118), the strongest growth of all LWDB’s IPS segments and towards the top end of the target of mid- to high single-digit growth. The corporate trusts business saw a 7.4% increase in revenues, while income from corporate services grew by 4.6%.
LWDB’s pensions business includes its independent trustee services business (established for 50 years and the largest of its kind in the UK), as well as Pegasus, an outsourced pension administration and governance service, launched in 2017. LWDB’s pension trustee business provides experienced professional trustees to both defined benefit (DB) and defined contribution (DC) schemes, and Jackson says both this business and Pegasus continue to benefit from a regulatory drive towards consolidation and improvements in the governance of company pension schemes. This was exemplified by a recent report from The Pensions Regulator calling for ‘fewer, better-governed schemes’. Thorpe adds that the pensions business has strong recurring revenues as well as potential for future growth, and continues to attract a high calibre of new hires.
The corporate trusts business also performed well in H119, despite the low level of corporate debt issuance and merger and acquisition (M&A) activity (for which the division provides escrow agency services) in Europe. The business primarily acts as a bridge between the issuer of a bond or loan and the lender/investor, in order to protect the interests of the investor. Around two-thirds of annual revenues are contracted, with the balance coming from a mixture of acceptance fees from new issuance and special fees from bankruptcy situations, both of which are more dependent on market conditions. Thorpe says the H119 result is partly an increase in ongoing revenues (from new business won in the previous year), as well as some exceptional items. Jackson adds that the focus for corporate trusts remains on winning new ongoing business to facilitate long-term growth as well as replacing what rolls off as a result of maturities.
Corporate services saw the weakest increase in revenues for H119 over H118, but still improved after seven years of broadly flat revenue growth across the IPS business until end-FY17. The main corporate services business is in helping clients to establish and maintain special purpose vehicles (SPVs), by providing governance, administrative, accounting, process agent and company secretarial services. The formation of SPVs is often associated with new issues, and the relatively lacklustre capital markets backdrop so far in 2019 (particularly in Europe) has proved a headwind for the division. Most of the business is international and is concerned with cross-border vehicles. A much smaller part of corporate services – although the biggest contributor to its revenue growth in H119 – is Safecall, a whistleblowing service that has continued to see a strong flow of new corporate clients. Jackson remains confident on Safecall’s growth prospects and says the evidence from H119 is that ‘it continues to be in the right place at the right time’.
Exhibit 2: Fair valuation of IPS business
£000s unless stated |
30 June |
31 December |
30 June |
31 December 2017 |
IPS valuation |
||||
IPS EBITDA |
10,828 |
10,424 |
10,440 |
9,797 |
EBITDA multiple (x) |
9.2 |
8.4 |
8.4 |
7.9 |
Operational value of IPS |
99,618 |
87,562 |
87,696 |
77,396 |
IPS surplus net assets |
15,962 |
16,844 |
22,800 |
17,176 |
IPS fair value |
115,580 |
104,406 |
110,496 |
94,572 |
IPS fair value per share (p) |
97.8 |
88.3 |
93.5 |
80.0 |
LWDB fair value |
||||
LWDB fair value per share as per IFRS financial statements (p) |
619.37 |
566.27 |
638.21 |
633.28 |
IPS fair value adjustment per share (p) |
72.24 |
66.36 |
70.08 |
61.57 |
Debt fair value adjustment (p) |
(27.94) |
(18.56) |
(20.00) |
(25.32) |
LWDB fair value NAV per share (p) |
663.67 |
614.07 |
688.29 |
669.53 |
IPS book value (IFRS) as % of total |
4.1% |
3.9% |
3.8% |
3.0% |
IPS fair value as % total |
14.7% |
14.4% |
13.6% |
12.0% |
Source: The Law Debenture Corporation, Edison Investment Research
LWDB carries the IPS business at book value in its IFRS financial statements, but also provides an independent assessment of its fair or market value, which is substantially higher. This figure is based on an appropriate multiple of historical EBITDA, and allows investors to make a more accurate assessment of LWDB’s fair value. As shown in Exhibit 2, the EBITDA multiple has been raised from 8.4x at end-FY18 to 9.2x at end-H119. The multiple is based on an undisclosed basket of broadly similar companies, adjusted for differences in size, liquidity, margins and growth rates.
The operational value of IPS rose by 13.8% in H119 and the fair value of IPS per share rose by 10.7%. At 97.8p per share, the fair value of IPS accounted for 14.7% of LWDB’s NAV per share (with debt at fair value) at end-H119, up from 14.4% at end-FY18. The IFRS book value of IPS rose from 21.8p to 25.5p per share (+17.0%) during H119; the 72.2p IPS business fair value adjustment was an 8.9% increase from 66.4p at end-FY18.
The fund managers: James Henderson and Laura Foll
The managers’ view: Maintaining a preference for value
Although they do not follow a ‘deep value’ investment approach in any of the funds they manage (particularly not LWDB, where portfolio income is supported by IPS business revenues), Henderson and Foll have a strong preference for stocks that are trading at lower-than-average valuations. With this in mind, they admit that their recent trading activity – trimming holdings that have performed well and are trading at higher valuations, and adding to companies (mainly in the UK) that are out-of-favour but have a clear path to earnings growth – could detract from short-term returns. However, they also point to the long-term tendency of stocks with a lower starting valuation to outperform (see Exhibit 3, MSCI World Value versus MSCI World Growth), and argue that after 10 years of strong performance from what are perceived to be high-quality growth stocks, valuations for these companies are now at levels that in many cases look unsustainable. LWDB Chief Financial Officer Thorpe also argues that to have achieved a six-month NAV total return of c 10% is impressive when both value stocks and the UK in general are unloved by the majority of investors.
|
Exhibit 3: Value has underperformed growth for more than a decade |
|
|
Source: Janus Henderson Investors, Edison Investment Research |
Henderson comments that ‘there are some real bargains to be had’ currently in the UK stock market, such as Eddie Stobart Logistics, which is trading well and has good prospects for dividend growth, yet ‘looks very much the wrong price’ on a forward P/E ratio of c 5x. He describes his and Foll’s current approach to the UK market – where they have recently invested an extra £50m through increasing LWDB’s gearing – as ‘opportunistic but not gung-ho’. However, Foll adds: ‘If we find value that is not in the UK, we will buy it, such as [recent purchase] Bristol-Myers Squibb’.
While not driven by the change in AIC sector from Global to UK Equity Income, Henderson says most signs currently point to a further increase in LWDB’s UK exposure from the current c 76%. ‘If it takes five years before the value/growth trade turns, we will have more in the UK [because of buying more attractively valued UK stocks]. If it turns more quickly, the UK will still go up [because value stocks will outperform].’
Many of the recent purchases in the UK have been bought at attractive dividend yields, because share prices have fallen while dividends have not been cut. Henderson adds: ‘We are moving more towards yield in the understanding that the wind is in our face. But we are adding to the UK from a [total return] investment perspective, not for yield alone.’
Asset allocation
Investment process: One-stop shop for quality equity exposure
LWDB’s portfolio managers aim to hold a diversified portfolio of quality, primarily UK-listed companies. Even before the recent move to the AIC’s UK Equity Income sector from the Global sector, more than 70% of LWDB’s assets were invested in UK equities, with the overseas portion used to give access to attractive investment areas where there is no compelling UK-listed equivalent (for example, Microsoft in the case of large-cap technology stocks). The only change to the geographical allocation guidelines (see Exhibit 3) as a result of the sector change has been an increase in the maximum UK weighting from 80% to 85%.
Henderson and Foll own a relatively long list of stocks (139 names at 30 June 2019) in order to mitigate company-specific risk and provide a good spread of underlying business areas. They invest across the market capitalisation spectrum on a bottom-up basis, based on their rigorous assessment of company fundamentals, although LWDB has more of a large-cap bias than some of the managers’ other funds, with around two-thirds of the portfolio in FTSE 100 names (or overseas equivalents). Henderson and Foll aim to invest in growing businesses whose current share price does not reflect their long-term growth prospects. Although the managers are mainly focused on the UK market, they sit within Janus Henderson’s global income team, which gives them access to overseas stock ideas. James Ross is responsible for European stock selection in the LWDB portfolio, while Henderson and Foll oversee the UK and North American stocks, as well as fund selection in Asia and emerging markets, which LWDB rarely invests in directly. The managers tend to build and exit holdings gradually (which also contributes to the length of the stock list); the average starting position is c 0.3% of NAV, although some very large companies may enter the portfolio as a bigger percentage; for example, recent purchase Royal Bank of Scotland is almost 1% of NAV.
The managers’ patient approach to investing is reflected in LWDB’s relatively low level of portfolio turnover, which stood at 15.4% in FY18 (FY17: 14.0%). The figure for H119 was slightly higher (an annualised rate of 18.6%), driven by greater buying activity as a result of an increase in gearing over the six months. Positions may be reduced and ultimately sold where valuations have become stretched (and future upside is therefore limited) as a result of strong performance, or when there is a deterioration in fundamentals.
Because of the significant contribution (c 25% in H119, but closer to 40% historically, prior to the recent change in the allocation of investment management fees between the revenue and capital accounts) from the IPS business to LWDB’s total revenue, Henderson and Foll have the freedom to invest part of the portfolio in lower-yielding stocks while still achieving the trust’s objective of providing long-term growth and a steadily growing income. However, when deploying gearing they will tend to target stocks that have yields above the cost of LWDB’s borrowing (currently c 4.6%) and can thus provide immediate upside. The portfolio yield is currently c 4.1% on a 12-month forward basis, an increase on six months previously, partly reflecting the use of LWDB’s gearing to buy into out-of-favour UK stocks on attractive yields.
Current portfolio positioning
At 30 June 2019, there were 139 stocks in LWDB’s portfolio. This included seven collective investment funds, which made up 6.8% of the total (end-FY18: seven funds and 6.9% of the total). The total number of holdings was unchanged compared with six months earlier, although there were some changes at the stock level. The top 10 holdings made up 22.8% of the portfolio, virtually unaltered from 22.6% a year earlier.
Exhibit 4: Portfolio geographic exposure vs allocation guidelines (% unless stated)
Portfolio end-June 2019 |
Portfolio end-June 2018 |
Change |
Allocation guidelines |
|
UK |
76.4 |
73.1 |
3.3 |
55-85 |
North America |
9.0 |
8.7 |
0.3 |
0-20 |
Europe ex-UK |
8.2 |
9.2 |
(1.0) |
0-10 |
Pacific ex-Japan |
4.1 |
4.8 |
(0.7) |
0-10 |
Japan |
1.0 |
2.0 |
(1.0) |
0-10 |
Other |
1.3 |
2.2 |
(0.9) |
0-10 |
100.0 |
100.0 |
100.0 |
Source: The Law Debenture Corporation, Edison Investment Research
In geographical terms (Exhibit 4), the main change compared with 12 months earlier has been a 3.3pp increase in the UK weighting. The managers stress that this is in response to investment opportunities rather than LWDB’s move from the AIC Global sector to the UK Equity Income sector. However, the slight increase in the upper bound of the board’s allocation guidelines for UK exposure (from 80% to 85%) is largely a result of the sector change. North American exposure has slightly increased compared with 12 months ago but is lower than at end-FY18 (9.4%). All other regions have decreased somewhat over the past 12 months.
Exhibit 5: Portfolio sector exposure vs benchmark (% unless stated)
Portfolio end- June 2019 |
Portfolio end- June 2018 |
Change (pp) |
Index weight |
Active weight vs index (pp) |
Trust weight/ index weight (x) |
|
Industrials |
24.1 |
25.5 |
(1.4) |
11.5 |
12.7 |
2.1 |
Financials |
21.6 |
18.6 |
3.0 |
26.1* |
(4.5)* |
0.8* |
Oil & gas |
10.4 |
11.0 |
(0.6) |
14.3 |
(3.9) |
0.7 |
Consumer services |
9.5 |
8.3 |
1.2 |
11.5 |
(2.0) |
0.8 |
Health care |
7.6 |
8.2 |
(0.6) |
8.5 |
(0.9) |
0.9 |
Basic materials |
7.4 |
6.9 |
0.5 |
8.2 |
(0.8) |
0.9 |
Pooled equity invts |
6.8 |
10.0 |
(3.2) |
N/A |
N/A |
N/A |
Consumer goods |
4.5 |
3.8 |
0.7 |
13.9 |
(9.4) |
0.3 |
Utilities |
3.7 |
3.3 |
0.4 |
2.6 |
1.1 |
1.4 |
Technology |
3.1 |
3.0 |
0.1 |
1.2 |
2.0 |
2.7 |
Telecommunications |
1.3 |
1.4 |
(0.1) |
2.4 |
(1.1) |
0.5 |
100.0 |
100.0 |
100.0 |
Source: The Law Debenture Corporation, Edison Investment Research. Note: *Index weight in financials includes pooled equity investments.
The portfolio remains well diversified by sector (Exhibit 5), with few major changes over the past 12 months. The biggest increase in exposure was to financials (+3.0pp), largely as a result of new positions in Royal Bank of Scotland and Lloyds Banking Group. The largest decrease over 12 months was in pooled equity investments (-3.2pp), with most of the activity occurring in H218, although the position in Stewart Investors Asia Pacific Leaders has been trimmed in H119. The portfolio sector exposure differs markedly from that of the index, with a large overweight in industrials (+12.7pp), where Henderson and Foll continue to find attractively valued opportunities, and a significant underweight in consumer stocks (-11.4pp across consumer goods and consumer services), where many companies are trading at historically high valuations, in spite of the uncertain economic outlook.
The managers have been net buyers of stocks in H119, raising LWDB’s gearing from 3% at end-FY18 to 7% at end-H119. They have invested an extra £50m into UK companies, most notably in RBS and Lloyds. Foll says LWDB historically had no exposure to the big UK banks, but both currently look like attractive total return opportunities, trading below book value (giving scope for capital appreciation) and with dividend yields of c 6–7%. The managers have also added to existing holdings in cruise operator Carnival (whose shares had sold off on news of pockets of weak demand in Europe), property company Hammerson (trading at a c 60% discount to the value of its estate) and insurer Direct Line (sustainably yielding more than 9% on the back of stable revenues, despite tough conditions in the motor insurance market). Away from the UK domestic sphere (although still listed in the UK), the managers have also added to Hipgnosis Songs Fund, part of an allocation to high-yielding, less correlated funds that includes Foresight Solar and Urban Logistics REIT.
Henderson and Foll were net sellers of stocks in the US (-£9m), Europe (-£4m) and Asia-Pacific (£1.5m) over the six months. The position in US healthcare supplies firm Becton Dickinson was sold completely on fears that its valuation had become over-extended, while holdings in US technology stocks such as Microsoft and Lam Research were trimmed. However, a new position was bought in pharmaceutical giant Bristol-Myers Squibb (currently undergoing a merger with biotechnology major Celgene), which is trading on a 12-month forward P/E of less than 8x.
Performance: H119 sees strong absolute returns
Exhibit 6: Five-year discrete performance data
12 months ending |
Share price |
NAV* |
FTSE All-Share |
FTSE 250 |
30/06/15 |
1.4 |
0.9 |
2.6 |
14.5 |
30/06/16 |
(1.5) |
4.0 |
2.2 |
(4.6) |
30/06/17 |
21.2 |
25.9 |
18.1 |
22.2 |
30/06/18 |
7.3 |
9.9 |
9.0 |
10.6 |
30/06/19 |
2.6 |
0.1 |
0.6 |
(3.8) |
Source: Refinitiv. Note: All % on a total return basis in pounds sterling. *Cum-income NAV with debt and IPS business at fair value.
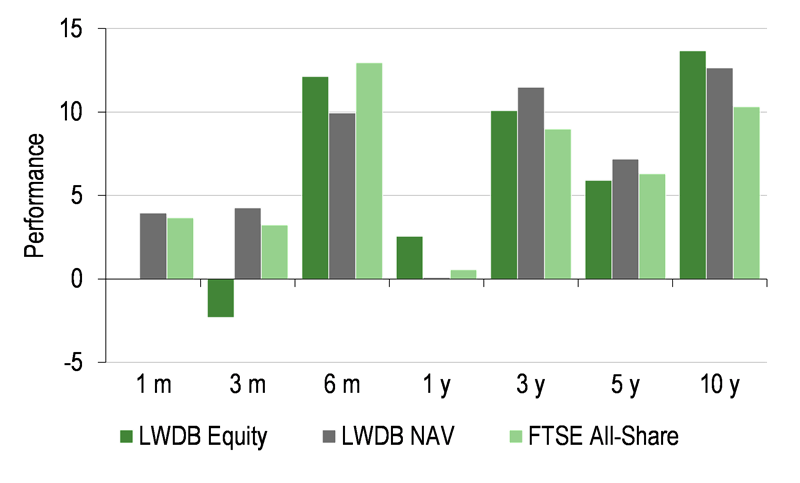
LWDB has performed strongly in absolute terms over H119, with a share price total return of 12.1% and a fair value NAV total return of 10.3%, boosted by an upward revaluation of the IPS business. However, these returns did slightly lag the 13.0% total return from the benchmark FTSE All-Share Index, which may reflect the managers’ value bias, as growth stocks continued to perform better on average. In the investment portfolio, the top five positive contributors in H119 were mining company Rio Tinto, homeware store chain Dunelm, US tech giant Microsoft, textile rental firm Johnson Service and paving supplier Marshalls. Together these positions made gains of £18.7m for the portfolio. Henderson and Foll note that, with the exception of Rio Tinto, all these companies are now trading at relatively high valuations versus history, and therefore the managers have been gently reducing some of the positions (notably Marshalls and Microsoft) to realise gains and reinvest in better-value opportunities. The five biggest detractors in H119 were construction and outsourcing firm Kier, sub-prime lender Provident Financial, early-stage technology/healthcare incubator IP Group, International Personal Finance (a peer of Provident Financial with a focus on emerging markets) and International Consolidated Airlines, which owns British Airways. Together these stocks lost £11.2m for the portfolio. Many are now very small positions and the managers have added to some of the names on weakness, where they believe they have been oversold.
|
Exhibit 7: Investment trust performance to 30 June 2019 |
|
Price, NAV and benchmark total return performance, one-year rebased |
Price, NAV and benchmark total return performance (%) |
|
|
|
Source: Refinitiv, Edison Investment Research. Note: Three-, five- and 10-year performance figures annualised. |
|
While the six-month return has moderately lagged a strongly rising market (the beginning of the period marked a 12-month low for UK and US equities, with a significant bounce back in Q119), over the longer term (Exhibit 7, right-hand chart), LWDB’s fair value NAV total return has outperformed the FTSE All-Share Index, with the trust delivering annualised returns of c 7–13% over three, five and 10 years, compared with c 6–10% for the benchmark.
Exhibit 8: Share price and NAV total return performance, relative to indices (%)
|
One month |
Three months |
Six months |
One year |
Three years |
Five years |
10 years |
Price relative to FTSE All-Share |
(3.5) |
(5.4) |
(0.7) |
2.0 |
3.0 |
(1.9) |
35.0 |
NAV relative to FTSE All-Share |
0.3 |
1.0 |
(2.7) |
(0.5) |
7.0 |
4.2 |
23.3 |
Price relative to FTSE 250 |
(2.8) |
(5.1) |
(0.7) |
6.6 |
2.7 |
(6.1) |
4.5 |
NAV relative to FTSE 250 |
1.1 |
1.3 |
(2.7) |
4.1 |
6.7 |
(0.2) |
(4.5) |
Source: Refinitiv, Edison Investment Research. Note: Data to end-June 2019. Geometric calculation.
Capital structure and fees
LWDB is a conventional investment trust, with 118.2m ordinary shares (its only share class) in issue at 23 July 2019. Although the board has the authority to buy back up to 14.99% of shares and to allot shares up to 5% of the issued share capital each year in order to manage a premium or a discount, in practice these powers are used infrequently. Purchases or allotments in recent years have tended to be confined to small numbers of shares in connection with employee share ownership schemes.
Gearing is available to the fund managers via long-term borrowings of £115m (nominal value), made up of £40m of 6.125% secured bonds maturing in 2034, and £75m of 3.77% senior secured notes maturing in 2045. Together this equates to gross gearing (at par value) of c 14.1% of NAV. Because the current low level of interest rates means high-coupon debt is deemed more valuable, the fair or market value of the debt is higher than the par value, standing at £147.2m at 30 June 2019 (end-H119). At fair value, the debt equates to gross gearing of 18.9%, while net gearing was 7.0% at 30 June 2019, compared with a permitted working range of 10% net cash to 20% geared, and a formal limit of 50%. The net gearing is lower than the gross figure because LWDB has significant cash (£86.5m at end-H119) on its balance sheet. Henderson and Foll have steadily increased the net gearing since end-FY18, when it stood at 3.0%.
Janus Henderson Investors is paid an annual management fee of 0.30% of LWDB’s net assets (excluding net assets of the IPS business), with no performance fee. While previously all management fees were charged to the revenue account, since the start of FY19, fees have been charged 25% to revenue and 75% to capital, in line with the expected split of future returns. Ongoing charges for FY18 were 0.43%, making LWDB one of the lowest-cost funds in the AIC investment company universe.
Dividend policy and record
LWDB aims to pay a steadily rising income and has a 44-year track record of maintaining or increasing its annual dividend. Dividends are paid twice a year, in September (interim) and April (final). For H119 an interim dividend of 6.6p has been declared, an increase of 10.0% over H118. The revenue from the IPS business supports the payment of a higher level of dividend and means the managers are not constrained to investing only in higher-yielding stocks. While the 25% contribution to total income from IPS was lower in H119 than hitherto (30% in H118, 37% in FY18, and 39% over the long term), this was principally because of higher income from the investment portfolio.
The revenue return for the investment trust portfolio in H119 was 11.76p per share, 42% higher than in H118 and only 12% below the FY18 figure (which covers 12 months rather than six), helped by the reallocation of management fees between capital and income. Normalised IPS earnings per share of 3.92p were 8.9% higher than in H118. The 6.6p interim dividend is c 2.4x covered by group income of 15.68p per share (which was 32% higher than in H118). Based on the current share price and the latest two dividends (H119 interim and FY18 final), LWDB has a prospective yield of 3.3%.
Peer group comparison
Previously a member of the AIC’s Global sector, LWDB has recently moved to the UK Equity Income sector. Its FTSE All-Share Index benchmark and primary focus on UK equities means the new sector is a more natural home for the trust, in spite of its continued exposure to overseas stocks. Many of the peers also invest in non-UK companies, and the AIC’s guidance is that a UK weighting of c 80% justifies inclusion in the sector.
Of the 24 funds in the UK Equity Income sector with a performance track record of at least one year and a market capitalisation of at least £10m (two funds have been excluded from Exhibit 10 on this basis), LWDB’s NAV total returns are above average over one, three, five and 10 years, currently ranking 12th, third, fourth and sixth, respectively, meaning it is in the top half of the peer group over all periods, and in the top quartile over all but one year. Ongoing charges are the third lowest in a very competitively priced group of funds, and, in common with all but one of the peers, there is no performance fee. Gearing is moderately below average. LWDB’s dividend yield (based on FY18 dividends) is currently the second-lowest in the sector, in line with its focus on capital appreciation as well as income. However, the 10% year-on-year growth in the H119 dividend builds on a 9.3% increase in the FY18 final dividend versus FY17, suggesting a path to a higher dividend yield for LWDB in the future, supported by the reallocation of management fees between the revenue and capital accounts. In previous years, annual dividend growth has been more in the c 3–5% range. More than one-third of the peer funds currently yield less than the FTSE All-Share dividend yield of 4.1%, possibly reflecting general fund manager concerns over the index’s income concentration in a small number of large stocks whose yields may prove unsustainable.
Exhibit 10: AIC UK Equity Income sector as at 22 July 2019*
% unless stated |
Market |
NAV TR |
NAV TR |
NAV TR |
NAV TR |
Ongoing |
Perf. |
Discount |
Net |
Dividend |
Law Debenture Corporation |
691.4 |
(0.9) |
31.7 |
43.6 |
228.3 |
0.4 |
No |
(11.5) |
107 |
3.2 |
Aberdeen Standard Equity Inc Trust |
200.1 |
(6.9) |
20.1 |
29.2 |
178.7 |
0.9 |
No |
(5.3) |
110 |
5.0 |
BlackRock Income and Growth |
46.0 |
(1.2) |
22.0 |
40.0 |
172.0 |
1.1 |
No |
(3.4) |
101 |
3.5 |
BMO Capital & Income |
340.2 |
1.6 |
37.9 |
55.1 |
186.7 |
0.6 |
No |
0.6 |
102 |
3.4 |
BMO UK High Income Units |
119.9 |
(1.5) |
17.7 |
29.2 |
144.2 |
0.3 |
No |
(10.5) |
105 |
4.1 |
Chelverton UK Dividend Trust |
36.2 |
(12.9) |
23.2 |
40.2 |
412.3 |
2.0 |
No |
(13.7) |
135 |
5.2 |
City of London |
1,620.7 |
2.9 |
23.1 |
39.1 |
210.8 |
0.4 |
No |
1.7 |
108 |
4.4 |
Diverse Income Trust |
335.9 |
(5.9) |
22.8 |
39.9 |
-- |
1.1 |
No |
(6.2) |
100 |
3.9 |
Dunedin Income Growth |
404.6 |
7.5 |
28.0 |
35.0 |
191.3 |
0.6 |
No |
(9.4) |
108 |
4.6 |
Edinburgh Investment Trust |
1,144.9 |
(8.4) |
3.2 |
28.4 |
196.5 |
0.6 |
No |
(12.0) |
109 |
4.7 |
Finsbury Growth & Income |
1,839.3 |
13.6 |
55.2 |
105.7 |
483.1 |
0.7 |
No |
0.7 |
101 |
1.6 |
Invesco Income Growth |
158.4 |
(0.6) |
15.2 |
30.1 |
202.4 |
0.7 |
No |
(15.8) |
102 |
4.2 |
Investment Company |
14.4 |
1.1 |
15.2 |
17.3 |
344.2 |
2.7 |
No |
(13.8) |
100 |
5.4 |
JPMorgan Claverhouse |
403.1 |
(2.8) |
30.9 |
42.0 |
192.6 |
0.7 |
No |
(5.1) |
109 |
4.0 |
JPMorgan Elect Managed Inc |
93.1 |
(1.9) |
21.0 |
30.4 |
165.7 |
0.7 |
No |
(2.5) |
100 |
4.3 |
Lowland |
352.6 |
(9.7) |
18.8 |
22.3 |
296.9 |
0.6 |
Yes |
(8.0) |
113 |
4.6 |
Merchants Trust |
532.5 |
(3.9) |
28.3 |
27.0 |
183.5 |
0.6 |
No |
(1.6) |
115 |
5.5 |
Murray Income Trust |
561.9 |
6.1 |
29.3 |
38.0 |
199.0 |
0.7 |
No |
(4.5) |
103 |
3.9 |
Perpetual Income & Growth |
741.3 |
(9.5) |
(0.5) |
14.4 |
172.4 |
0.7 |
No |
(11.5) |
116 |
4.6 |
Schroder Income Growth |
196.4 |
0.4 |
27.1 |
40.6 |
192.4 |
0.9 |
No |
(8.6) |
112 |
4.1 |
Shires Income |
80.9 |
1.1 |
30.0 |
39.4 |
249.7 |
1.4 |
No |
(1.6) |
119 |
5.0 |
Temple Bar |
838.6 |
(2.5) |
23.4 |
30.2 |
198.6 |
0.5 |
No |
(5.4) |
109 |
4.1 |
Troy Income & Growth |
241.1 |
7.1 |
19.4 |
50.5 |
219.3 |
0.9 |
No |
1.4 |
100 |
3.3 |
Value and Income |
120.9 |
(0.2) |
15.4 |
23.5 |
160.4 |
1.3 |
No |
(16.2) |
129 |
4.4 |
Sector average (24 funds) |
463.1 |
(1.1) |
23.3 |
37.1 |
225.3 |
0.9 |
(6.8) |
109 |
4.2 |
|
LWDB rank in sector |
6 |
12 |
3 |
4 |
6 |
22 |
18 |
14 |
23 |
Source: Morningstar, Edison Investment Research. Note: *Performance to 19 July 2019. TR=total return. Net gearing is total assets less cash and equivalents as a percentage of net assets (100 = ungeared).
The board
LWDB has four independent non-executive directors and two non-independent executive directors. Robert Hingley has been the chairman since April 2018, having joined the board in October 2017 as part of a succession plan. The other non-executive directors and their dates of appointment are Senior Independent Director Robert Laing (April 2012), Audit Committee Chairman Mark Bridgeman (March 2014) and Tim Bond (April 2015). The two executive directors are The Law Debenture Corporation Chief Executive Officer Denis Jackson (appointed to the board in January 2018) and Chief Financial Officer Katie Thorpe (appointed to the board in January 2019). The directors’ professional backgrounds include investment management, corporate finance, law and accountancy.
|
|
Research: Industrials
Lookers has confirmed that trading in Q219 has become more difficult following a positive Q119 performance. While new car markets remain challenged mainly by Brexit uncertainty, the main trading issue has been in used cars as residual values fell through the quarter. The shares have also been affected by a formal Financial Conduct Authority (FCA) investigation into selling processes on regulated activities. Together with a £5.6m adjustment to underlying FY19 PBT due to a change to the treatment of intangible amortisation, our estimates are substantially revised. We now expect an adjusted FY19e PBT of £40.8m, leaving the shares trading on a FY19e P/E of just 5.5x. We assume the dividend is maintained in FY19 with cover of 2.0x, which may provide support, but we will review this after the board’s decision with the interim results on 14 August.