32Red
Written by
32Red |
Confident start to 2017 |
Trading update |
Travel & leisure |
1 February 2017 |
Share price performance
Business description
Next events
Analysts
32Red is a research client of Edison Investment Research Limited |
|||||||||||||||||||||||||||||||||||||||||||||||||||
32Red has announced a positive 2016 post-close trading update and strong current trading with a 21% increase in January revenues (to 30th). We expect 2016 EBITDA to have doubled to £10.5m (a marginal reduction on our previous forecast due to lower win margins), helped by the highly accretive Roxy acquisition. Our unchanged 2017/18 forecasts are for continued very strong profits growth as the business scales up, with more favourable supplier agreements and Italy now in profit. The 2017e EV/EBITDA of 6.8x looks much too low for a high growth, 77% regulated, cash generative gaming business in a consolidating market.
Year end |
Revenue (£m) |
EBITDA* |
PBT* |
EPS* |
DPS |
P/E |
Yield |
12/14 |
32.1 |
5.4 |
3.9 |
4.9 |
2.4 |
27.1 |
1.8 |
12/15 |
48.7 |
5.2 |
3.3 |
3.8 |
2.8 |
35.0 |
2.1 |
12/16e |
62.3 |
10.5 |
8.9 |
9.4 |
3.3** |
14.1 |
2.5 |
12/17e |
76.0 |
15.5 |
13.3 |
13.9 |
3.6 |
9.6 |
2.7 |
12/18e |
88.0 |
18.0 |
15.7 |
16.4 |
4.0 |
8.1 |
3.0 |
Note: *Normalised, excluding amortisation of acquired Roxy Palace intangibles, exceptional items and share option costs. ** Excludes special dividend of 3.0p paid in March 2016.
Record revenues for 2016 despite tough Q4
32Red has announced record net gaming revenues (NGR) of £62.3m for 2016, 28% up on 2015. We have trimmed our 2016e EBITDA forecast by £0.5m to £10.5m due to below-average H216 win margins, as widely reported across the industry. We see no reason to change our 2017/18 forecasts given the strong start to the year. Margins are benefiting from economies of scale, more favourable terms from platform providers Microgaming (from 1 November 2016) and Kambi Solutions (from 1 January 2017) and a move into profit in Italy.
Leveraging a strong brand
32Red’s key opportunity is to grow its share of the UK casino market, currently only 3-4% (see our Initiation report dated 21 September 2016). The doubling of EBITDA in 2016e reflects not just the full year synergies from Roxy Palace (acquired July 2015), but also improved returns from a more ROI-focused marketing policy. The growth momentum is continuing into 2017 and should accelerate as 32Red’s content offering widens (the new Microgaming deal allows it to add alternative suppliers). Italy is now profitable and other geographies offer expansion potential.
Valuation: looks much too low
32Red’s shares have moved sideways over the past six months, caught up in general sector malaise. Yet the government’s ‘triennial review’ is mainly expected to impact betting shops and the extension of UK gaming tax to free play is already in our forecasts. The 2017e EV/EBITDA is only 6.8x, a 15% discount to the peer group. A 10x 2017e EV/EBITDA would imply a share price of 192p (P/E of 13.8x) while our DCF gives 243p (10% WACC). In a consolidating market, with plenty of M&A activity, we consider that 32Red might attract even more of a premium given its brand strength, regulated bias, track record and growth momentum.
2016 pre-close trading update
32Red’s trading update reported 2016 revenues of £62.3m, split by segment as shown in Exhibit 1. It expects 2016 profits to be “in line with the Board’s previous expectations”; we were top of an EBITDA range of £10.4m-11.0m and have trimmed back to £10.5m to allow for slightly weak H216 win margins, but leave our 2017/18 estimates unchanged. 32Red expects to announce its full year results on 9 March 2017. Going forward, with Roxy Palace now fully integrated, 32Red will report its NGR across two segments, Casino and Other Products.
Exhibit 1: Half yearly results and estimates
|
2015 |
2016* |
2017 |
2018 |
||||
£m |
H1 |
H2 |
Year |
H1 |
H2e |
Year e |
Year e |
Year e |
32Red Casino |
17.0 |
22.4 |
39.4 |
21.2 |
24.4 |
45.6 |
55.6 |
64.1 |
Roxy Palace |
0.0 |
5.2 |
5.2 |
5.8 |
4.8 |
10.6 |
11.4 |
12.4 |
Italy |
0.9 |
0.8 |
1.7 |
1.1 |
1.2 |
2.3 |
3.0 |
4.0 |
Casino NGR |
17.9 |
28.4 |
46.3 |
28.1 |
30.4 |
58.5 |
70.0 |
80.5 |
Other Products NGR |
0.7 |
1.7 |
2.4 |
2.3 |
1.5 |
3.8 |
6.0 |
7.5 |
Net gaming revenue (NGR) |
18.6 |
30.1 |
48.7 |
30.4 |
31.9 |
62.3 |
76.0 |
88.0 |
Gross profit |
4.3 |
8.5 |
12.8 |
7.5 |
9.4 |
16.9 |
22.3 |
25.5 |
Gross profit margin % |
23.3% |
28.2% |
26.3% |
24.8% |
29.4% |
27.1% |
29.4% |
29.0% |
Admin expenses |
(3.1) |
(4.5) |
(7.6) |
(3.1) |
(3.3) |
(6.4) |
(6.8) |
(7.5) |
Normalised EBITDA |
1.2 |
4.0 |
5.2 |
4.5 |
6.0 |
10.5 |
15.5 |
18.0 |
Normalised EBITDA margin |
6.7% |
13.3% |
10.8% |
14.7% |
18.9% |
16.9% |
20.4% |
20.5% |
Depreciation |
(0.2) |
(0.3) |
(0.5) |
(0.2) |
(0.3) |
(0.5) |
(0.6) |
(0.6) |
Amortisation |
(0.7) |
(0.8) |
(1.4) |
(0.6) |
(0.5) |
(1.1) |
(1.6) |
(1.7) |
Roxy Palace amortisation |
0.0 |
(0.8) |
(0.8) |
(0.8) |
(0.8) |
(1.7) |
(1.7) |
(1.7) |
Normalised op profit |
0.3 |
3.0 |
3.3 |
3.7 |
5.2 |
8.9 |
13.3 |
15.7 |
Finance income (net) |
0.0 |
0.0 |
0.0 |
0.0 |
0.0 |
0.0 |
0.0 |
0.0 |
Normalised PBT |
0.4 |
3.0 |
3.3 |
3.7 |
5.2 |
8.9 |
13.3 |
15.7 |
Normalised EPS (dil) (p) |
0.4 |
3.4 |
3.8 |
3.9 |
5.5 |
9.4 |
13.9 |
16.4 |
Source: 32Red accounts, Edison Investment Research. Note: * 2016e revenue is actual. ** 32Red also paid a special dividend of 3.0p in March 2016.
Casino
32Red Casino increased 2016 NGR by 16%, in line with our estimates, helped by increased marketing investment both online and offline. For example, new offline deals in 2016 included a new three-year shirt sponsorship deal with Leeds United and sponsorship of the King George VI Chase (Kempton, Boxing Day). 32Red believes it is the 11th most recognised UK online casino brand despite only having a 3% market share.
Roxy Palace revenues came in at £10.6m (2015: £5.2m for 5.5 months), below our forecast of £12.0m. This was due to unusually weak Q316 win margins not being recouped in Q416 and, we believe, less marketing while the Roxy brand was (successfully) migrated onto 32Red’s new ‘Frankel’ front-end website. The integration of Roxy generated material cost synergies in 2016; going forward it also provides cross-sell opportunities as it has a slightly more recreational and international customer base.
After three years of investment, 32Red moved into profit in Italy in H216 in line with management expectations. We believe that it has a huge market opportunity, albeit that the market is highly competitive. Its main limitation has been the limited product range supplied by Microgaming, but its new agreement (from November 2016) allows for the introduction of new products from third party suppliers and we expect margins to continue to improve.
Other products
Other products comprise online sports betting, bingo and poker games. Revenues increased by 60% to £3.8m, below our £4.5m target due to the well-publicised industry-wide punter-friendly sports results in late 2016. However, 32Red Sport is developing as an increasingly important acquisition and retention channel and we expect further strong growth in 2017.
Dividends
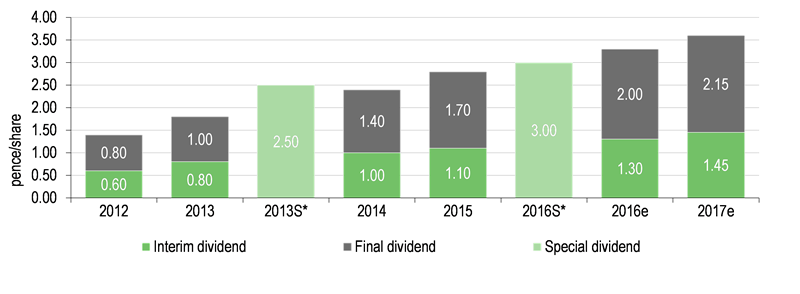
32Red has an excellent record of increasing dividends, including periodic special payouts (a 3p/share special dividend was paid in March 2016). The H116 interim payout was 1.3p/share and we expect 3.3p for the year ie 2.0p final. Based on our (unchanged) EBITDA forecasts of £15.5m for 2017 and £18.0m for 2018 we expect dividends of 3.6p in 2017 and 4.0p in 2018e. We believe there is potential for additional special dividends on top of that, given the cash generation we expect in FY17: we forecast net cash of £8.3m at the end of 2016, excluding player balances, to increase to £17.0m by the end of 2017.
|
Exhibit 2: Growing dividends, plus specials |
|
|
Source: 32Red |
Valuation
32Red is 77% regulated, growing strongly, cash generative and now with significantly increased dividends based on our forecasts. Yet its 2017e EV/EBITDA is only 6.8x, a 15% discount, and its P/E of 9.6x is 21% below the average. A 10x EV/EBITDA would be only slightly higher than 888 despite 32Red’s regulated status and high growth; it would imply a share price of 192p (P/E of 13.8x) while our DCF gives 243p (10% WACC). In a consolidating market, with plenty of M&A activity, we consider that 32Red might attract more of a premium given its brand strength, track record and growth momentum.
Exhibit 3: Peer group comparison
Company |
Price |
Mkt Cap |
EBITDA (x) |
P/E (x) |
||||
|
(p) |
(£m) |
2016e |
2017e |
2018e |
2016e |
2017e |
2018e |
32Red |
133 |
113 |
10.0 |
6.8 |
5.8 |
14.1 |
9.6 |
8.1 |
888 Holdings (888) |
225 |
807 |
10.8 |
9.8 |
8.8 |
18.5 |
16.5 |
14.4 |
GVC Holdings (GVC) |
606 |
1,773 |
10.8 |
8.8 |
7.8 |
21.9 |
12.7 |
10.3 |
Gaming Realms (GMR) |
17 |
46 |
N/A |
7.3 |
4.8 |
N/A |
11.8 |
6.8 |
Ladbrokes (LADB) |
119 |
2,286 |
13.0 |
8.7 |
7.7 |
16.6 |
11.8 |
9.4 |
Playtech (PTEC) |
829 |
2,656 |
9.3 |
7.8 |
7.0 |
14.3 |
11.6 |
10.4 |
Rank Group (RNK) |
199 |
776 |
6.4 |
6.3 |
6.0 |
13.0 |
12.6 |
11.7 |
Stride Gaming (STR) |
227 |
153 |
9.9 |
7.3 |
6.7 |
11.0 |
10.2 |
9.2 |
William Hill (WMH) |
259 |
2,229 |
8.1 |
7.8 |
7.4 |
11.8 |
10.6 |
9.7 |
Average UK listed peers |
9.8 |
8.0 |
7.0 |
15.3 |
12.2 |
10.3 |
||
Source: Bloomberg consensus estimates, Edison Investment Research. Note: share prices as at 31 January.
Exhibit 4: Financial summary
£m |
2013 |
2014 |
2015 |
2016e* |
2017e |
2018e |
||
31 December |
IFRS |
IFRS |
IFRS |
IFRS |
IFRS |
IFRS |
||
INCOME STATEMENT |
||||||||
Revenue |
|
|
25.4 |
32.1 |
48.7 |
62.3 |
76.0 |
88.0 |
Cost of Sales |
(17.5) |
(21.2) |
(35.8) |
(45.4) |
(53.7) |
(62.5) |
||
Gross Profit |
7.9 |
10.9 |
12.8 |
16.9 |
22.3 |
25.5 |
||
EBITDA |
|
|
3.8 |
5.4 |
5.2 |
10.5 |
15.5 |
18.0 |
Normalised operating profit |
|
|
3.0 |
3.9 |
3.3 |
8.9 |
13.3 |
15.7 |
Exceptionals |
(0.4) |
(0.2) |
(1.7) |
(0.1) |
0.0 |
0.0 |
||
Share option costs |
(0.3) |
(0.4) |
(0.6) |
(0.7) |
(0.8) |
(0.9) |
||
Reported operating profit |
2.3 |
3.4 |
0.3 |
6.4 |
10.8 |
13.1 |
||
Net Interest |
0.0 |
0.0 |
0.0 |
0.0 |
0.0 |
0.0 |
||
Profit Before Tax (norm) |
|
|
3.0 |
3.9 |
3.3 |
8.9 |
13.3 |
15.7 |
Profit before tax (reported) |
|
|
2.3 |
3.4 |
0.3 |
6.4 |
10.8 |
13.1 |
Reported tax |
(0.1) |
(0.1) |
(0.1) |
(0.3) |
(0.6) |
(0.7) |
||
Profit after tax (norm) |
2.9 |
3.8 |
3.2 |
8.6 |
12.8 |
15.1 |
||
Profit after tax (reported) |
2.2 |
3.3 |
0.2 |
6.1 |
10.3 |
12.5 |
||
Discontinued operations |
0.0 |
0.0 |
0.0 |
0.0 |
0.0 |
0.0 |
||
Net income (normalised) |
2.9 |
3.8 |
3.2 |
8.6 |
12.8 |
15.1 |
||
Net income (reported) |
2.2 |
3.3 |
0.2 |
6.1 |
10.3 |
12.5 |
||
Average Number of Shares Outstanding (m) |
71.4 |
73.0 |
78.3 |
84.6 |
85.3 |
85.3 |
||
EPS - normalised (p) |
|
|
4.1 |
5.2 |
4.1 |
10.2 |
15.0 |
17.7 |
EPS - normalised fully diluted (p) |
|
|
3.8 |
4.9 |
3.8 |
9.4 |
13.9 |
16.4 |
EPS - basic reported |
|
|
3.1 |
4.5 |
0.2 |
7.2 |
12.1 |
14.7 |
Dividend (p) |
4.3 |
2.4 |
2.8 |
6.3 |
3.6 |
4.0 |
||
Revenue growth (%) |
15.5 |
26.3 |
51.6 |
28.0 |
22.0 |
15.8 |
||
Gross margin (%) |
31.2 |
34.0 |
26.3 |
27.1 |
29.4 |
29.0 |
||
EBITDA margin (%) |
15.1 |
16.9 |
10.8 |
16.9 |
20.4 |
20.5 |
||
Normalised operating margin (%) |
11.8 |
12.3 |
6.8 |
14.3 |
17.5 |
17.8 |
||
BALANCE SHEET |
||||||||
Fixed assets |
|
|
3.2 |
2.7 |
9.9 |
11.1 |
10.4 |
9.5 |
Intangible assets |
2.3 |
1.9 |
8.8 |
10.0 |
9.2 |
8.2 |
||
Tangible assets |
0.9 |
0.8 |
1.1 |
1.1 |
1.2 |
1.3 |
||
Investments & other |
0.0 |
0.0 |
0.0 |
0.0 |
0.0 |
0.0 |
||
Current assets |
|
|
4.6 |
8.0 |
11.6 |
11.9 |
21.3 |
31.8 |
Stocks |
0.0 |
0.0 |
0.0 |
0.0 |
0.0 |
0.0 |
||
Debtors |
1.2 |
0.9 |
1.4 |
1.8 |
2.3 |
2.8 |
||
Cash & cash equivalents |
3.4 |
7.0 |
10.3 |
10.1 |
19.0 |
29.0 |
||
Other |
0.0 |
0.0 |
0.0 |
0.0 |
0.0 |
0.0 |
||
Current liabilities |
|
|
(3.3) |
(4.6) |
(10.2) |
(11.9) |
(13.2) |
(14.3) |
Creditors |
(2.7) |
(3.9) |
(8.5) |
(10.0) |
(11.0) |
(12.0) |
||
Tax and social security |
(0.1) |
(0.1) |
(0.1) |
(0.1) |
(0.2) |
(0.3) |
||
Player balances |
(0.6) |
(0.7) |
(1.6) |
(1.8) |
(2.0) |
(2.0) |
||
Short term borrowings |
0.0 |
0.0 |
0.0 |
0.0 |
0.0 |
0.0 |
||
Long-term liabilities |
|
|
(0.7) |
(0.3) |
0.0 |
0.0 |
0.0 |
0.0 |
Long-term borrowings |
0.0 |
0.0 |
0.0 |
0.0 |
0.0 |
0.0 |
||
Other long-term liabilities |
(0.7) |
(0.3) |
0.0 |
0.0 |
0.0 |
0.0 |
||
Net assets |
|
|
3.8 |
5.7 |
11.4 |
11.1 |
18.5 |
27.0 |
Minority interests |
0.0 |
0.0 |
0.0 |
0.0 |
0.0 |
0.0 |
||
Shareholders' equity |
|
|
3.8 |
5.7 |
11.4 |
11.1 |
18.5 |
27.0 |
CASH FLOW |
||||||||
Operating cash flow before WC and tax |
3.8 |
5.4 |
5.2 |
10.5 |
15.5 |
18.0 |
||
Working capital |
0.8 |
1.3 |
4.9 |
(0.7) |
(0.6) |
(1.0) |
||
Exceptional & other |
(0.5) |
(0.3) |
(0.7) |
(0.5) |
0.0 |
0.0 |
||
Tax |
(0.1) |
(0.1) |
(0.1) |
(0.4) |
(0.5) |
(0.6) |
||
Net operating cash flow |
|
|
4.1 |
6.3 |
9.3 |
8.9 |
14.4 |
16.4 |
Capex |
(2.3) |
(1.0) |
(2.8) |
(2.0) |
(2.0) |
(2.5) |
||
Acquisitions/disposals |
0.0 |
0.0 |
(7.4) |
(1.0) |
0.0 |
0.0 |
||
Net interest |
0.0 |
0.0 |
0.0 |
0.0 |
0.0 |
0.0 |
||
Equity financing |
0.2 |
(0.2) |
6.8 |
(0.5) |
0.0 |
0.0 |
||
Dividends |
(2.9) |
(1.5) |
(2.0) |
(5.0) |
(3.0) |
(3.2) |
||
Other |
0.0 |
(0.2) |
(1.6) |
(0.8) |
(0.7) |
(0.7) |
||
Net cash flow |
(1.0) |
3.4 |
2.4 |
(0.4) |
8.7 |
10.0 |
||
Opening net debt/(cash) |
|
|
(3.8) |
(2.8) |
(6.2) |
(8.6) |
(8.3) |
(17.0) |
FX |
0.0 |
0.0 |
0.0 |
0.0 |
0.0 |
0.0 |
||
Other non-cash movements |
0.0 |
0.0 |
0.0 |
0.0 |
0.0 |
0.0 |
||
Closing net debt/(cash) |
|
|
(2.8) |
(6.2) |
(8.6) |
(8.3) |
(17.0) |
(27.0) |
Source: 32Red accounts, Edison Investment Research. Note: * 2016e revenue of £62.3m is as reported in the trading update. ** The 2013 dividend includes a special dividend of 2.5p per share; the 2016e dividend includes a special dividend of 3.0p per share.
|
|