Last close As at 05/08/2026
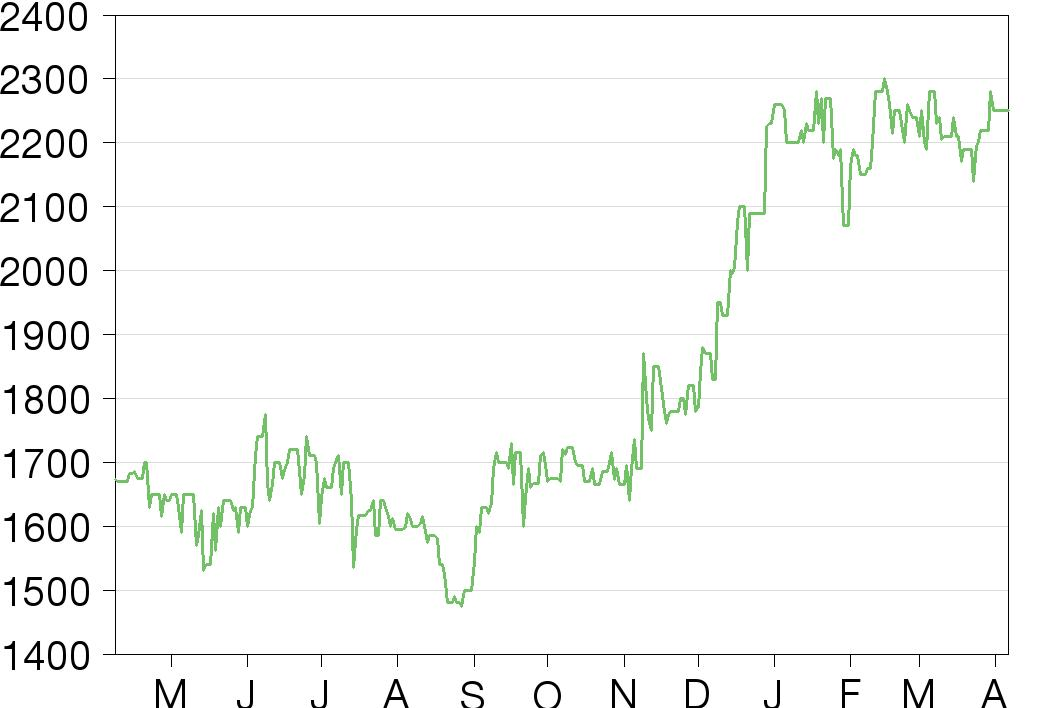
GBP19.60
▲ 20.00 (1.03%)
Market capitalisation
GBP239m
Research: Financials
S&U’s results for FY21 were significantly affected by the pandemic, but a near-term bounce back in demand for motor finance is in prospect as dealer showrooms reopen and consumer confidence improves. Underpinning the longer-term outlook for Advantage has been continued work to adapt and improve the business. Aspen Bridging also looks set to contribute to growth with loan-book growth reviving in the second half of FY21 and likely to see further significant growth in the next two years.
Written by
S&U |
Ready to meet unlocked demand |
FY21 results and outlook |
Financial services |
8 April 2021 |
Share price performance
Business description
Next events
Analysts
S&U is a research client of Edison Investment Research Limited |
|||||||||||||||||||||||||||||||||||||||||||||||
S&U’s results for FY21 were significantly affected by the pandemic, but a near-term bounce back in demand for motor finance is in prospect as dealer showrooms reopen and consumer confidence improves. Underpinning the longer-term outlook for Advantage has been continued work to adapt and improve the business. Aspen Bridging also looks set to contribute to growth with loan-book growth reviving in the second half of FY21 and likely to see further significant growth in the next two years.
Year end |
Revenue (£m) |
PBT* |
EPS* |
DPS |
P/E |
Yield |
01/20 |
89.9 |
35.1 |
239.4 |
120.0 |
9.4 |
5.3 |
01/21 |
83.8 |
18.1 |
120.7 |
90.0 |
18.6 |
4.0 |
01/22e |
88.6 |
23.9 |
159.2 |
100.0 |
14.1 |
4.4 |
01/23e |
94.5 |
31.8 |
211.9 |
110.0 |
10.6 |
4.9 |
Note: *PBT and EPS are reported. EPS are diluted.
FY21 results feature pandemic induced provisions
S&U reported FY21 revenue of £83.8m (-7%), pre-tax profit of £18.1m (FY20: £35.1m) and diluted EPS of 120.7p (FY20: 239.4p). A final dividend of 43p gives a total of 90p for the year (FY20: 120p). Advantage Motor Finance profit fell from £34.0m to £17.2m, driven by forward-looking pandemic-enlarged provisions of £36m versus £16.5m. Payment holidays and forbearance meant collections fell by £16m to £180m but lower advances of £102.6m (£149m) lead to cash inflows. Aspen property bridging saw a strong recovery in activity in the second half and nearly matched H220 profit giving a full-year profit of £0.8m versus £1.2m. Customer receivables at the year end increased to £34m (£21m).
Release of pent-up demand expected
S&U expects a strong recovery in demand for motor finance as lockdown restrictions ease and has added £25m to its borrowing facilities, taking the total to £155m to provide headroom for this rebound. Looking beyond this, Advantage has continued to work on refining its credit scorecard and product offering, is developing affinity relationships and sales through comparison websites and is enhancing its digital marketing. Aspen has also refined its product offering and remains on track to increase scale to become a more material contributor to the group. Subject to macroeconomic developments, S&U’s aspiration to deliver a sustained rebound in profits appears attainable. Our estimates are updated following the FY21 results with minor increases in profit and EPS numbers.
Valuation
The shares trade on a price to book ratio of c 1.5x, a prospective P/E that falls to 10.6x for FY23 and offers a yield of 4%. Using an ROE/COE model, the current share price implies a return on equity (ROE) of 14%, which is above our current 13% estimate for FY23. However, that year will probably not have seen the full effect of the potential recovery and the pre-COVID-19 five-year average ROE was over 16%.
Investment Summary
S&U is an established specialist lender with businesses addressing the non-prime motor finance and the property bridging markets. Advantage motor finance has a record of strong, profitable growth. While it has been affected by the pandemic, Advantage is preparing for a strong bounce back in demand as lockdown restrictions are released. It has also continued to work on improvements to support longer-term growth. Aspen Bridging, a relatively new business, has gained experience and is scaling up to make a more significant contribution to the group while maintaining a conservative underwriting approach. The Coombs family own c 52% of the equity and management take a long-term, sustainable approach to the development of the group. The shares are valued at c 1.5x book, a level that would be consistent with an ROE of 14%; this is above the level we estimate for FY22/FY23 but below the pre-Covid-19 five-year historical average of over 16%.
A long history incorporating significant evolution
S&U’s origins lie in a business founded by the chairman’s grandfather in 1938. That evolved into a home collected credit company and in 1999 a nonprime motor finance business was added with the foundation of Advantage Finance. The sale of the home collected credit business to Non Standard Finance in 2015 for £82.5m represented a significant change for the group and provided the means to finance a £15m special dividend and to invest in continued strong growth at Advantage and subsequently the formation of a new property bridging business (Aspen Bridging) in 2017.
Sustained growth in non-prime motor finance
Advantage Finance was formed in 1999 and is based in Grimsby with c 165 employees. Graham Wheeler took over as managing director in 2019, bringing extensive experience as a senior executive in the motor finance sector, while much of the management team has been with the company since launch. Advantage has a strong growth record and, at £247m, net customer receivables have grown at a 10-year compound growth rate of 20%, even after a contraction in FY21 as a result of the pandemic. The company has nearly 63,000 live customers and recorded 15,589 new transactions in FY21 (although pre-pandemic it had over 23,000 transactions in FY20). Advantage focuses on the non-prime area of the market, all loans are hire purchase loans and 90% of its lending is through over 40 brokers, with 5% each direct from dealerships and existing customers. The broker-sourced business is divided roughly 60/40 between internet and dealership brokers. S&U has relationships with the largest UK brokers including names such as Carfinance247, Zuto, Evolution Funding, Jigsaw and Midland Credit. This gives access to both large dealership networks and smaller local dealers.
Almost all the loan applications are submitted to the Advantage web-based system, which provides immediate in-principle lending decisions. The in-house IT capability at Advantage (about 10% of the staff) is an important enabler for the business as it helps maintain a high-speed response to loan applications (within 10 seconds for 95% of all applications) and rapid adjustments to systems to meet business requirements. An example of this is the introduction of a third credit rating agency (Equifax has been added to Experian and TransUnion) and the current project of merging of its data into the score card. The successful adjustment to working from home for most staff in FY21 validated the robustness of IT systems.
Most loans range from £5,000 to £8,000, with a maximum loan amount of £15,000; the average advance in FY21 was £6,581. The average original term was 52 months with a flat interest rate of 17.0% (c £11,700 repayable including interest and fees). The provisional approval rate for loan applications in the last financial year was approximately 25%, with c 0.38m out of c 1.5 million applications approved. The 15,589 that actually signed up in FY21 were therefore equivalent to about 4% of approvals or 1% of original applications. The small ratio of deals signed in part reflects buyers’ increased use of the internet to source finance before shopping for a car and is not onerous for Advantage given the automation of responses to applications. Advantage’s Dealflo esignature system helps to support the sign-up rate following approval, by guiding customers through terms and conditions and verifying their digital signatures.
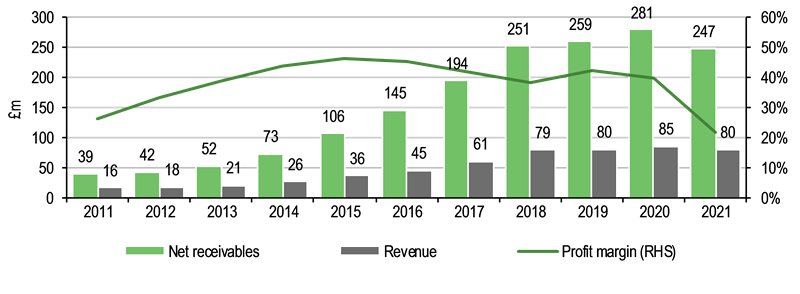
Advantage had achieved 20 years of consecutive profit growth until FY21, reflecting growth in the loan book paired with successful credit control, underpinned by continuous refinement of a bespoke underwriting and scoring system, developed in conjunction with Experian and referencing a range of data sources. The pandemic affected FY21 results through substantial forward-looking impairment provisions. Exhibit 1 shows the development in receivables, revenue and profit margin at Advantage since 2011. Growth accelerated in the post financial crisis period (notably from 2013) when limited availability of credit created a particularly favourable environment with customers who might previously have been served by the incumbent banks migrating to specialist providers such as Advantage. Revenue and margin benefited subsequently with the latter rising to more than 40% for four years followed by a moderation as a result of rising broker commission and impairments, and, to a lesser extent, the withdrawal from the sale of gap insurance (2015). In FY21 the impact of the pandemic on margins was marked as increased provisioning almost halved the profit margin (see results analysis below for further detail).
|
Exhibit 1: Motor receivables and revenue |
|
|
Source: S&U, Edison Investment Research |
Property bridging finance: A diversifying source of growth
Aspen Bridging launched as a pilot project in February 2017 to test the viability of developing property bridging finance as a diversifying activity and alternative source of growth for the group. In November 2018, S&U announced that it would move on from the pilot stage and invest further in the business.
Loans are made for refurbishment, light development or investment in the residential, houses of multiple occupation, prime semi-commercial and prime commercial market segments. The average original term is 11 months with an option for Aspen to extend the term by two months where appropriate; repayment is financed by sale or re-mortgaging. Loans are all unregulated (not owner-occupier) and are secured with a first charge. The maximum loan size was increased from £3m to £5m in January this year. S&U notes that it is addressing a market niche financing projects that larger institutions would find difficult to service with the speed and flexibility Aspen can offer.
Aspen follows a cautious underwriting approach with a process that includes third-party legal and valuation input, together with a site meeting with each customer by a member of the 15-strong Aspen team. Since launch 234 loans have been provided with an average gross value of c £500,000 and maximum loan to value of 71%. At end FY21 net receivables stood at £34.1m and during the year there were 80 transactions with a gross average loan size of £544,000.
FY21 results analysis
S&U’s FY21 results were close to expectation and were strongly affected by the pandemic. Total year-end amounts receivable from customers of £280.9m were 7% lower, reflecting a combination of the impact of lockdowns and tighter credit criteria. Group revenue was also 7% lower. The most noticeable feature of the P&L was the more than doubled impairment charge of £36m for motor finance, reflecting forward-looking provisioning. Other cost of sales fell by 28% to £14m reflecting lower motor finance transactions. Administration costs were 15% lower reflecting a review of all costs at Advantage and a one-off overhead VAT reclaim of £0.7m. As a result, group pre-tax profit fell by 48% to £18.1m.
Further details are set out in Exhibit 2 including a half-year analysis. This shows that second half group revenue was only 4% below the first half, although within this property bridging activity bounced back resulting in a 57% sequential increase. This and the first-half weighting of motor finance impairments meant that second half pre-tax profit increased 87% sequentially giving a more moderate 34% y-o-y reduction for H221.
Exhibit 2: FY21 and H221 results analysis
£000 |
H220 |
H121 |
H221 |
sequential % change |
FY20 |
FY21 |
y-o-y % |
Number of new motor loans |
11,269 |
7,811 |
7,778 |
-0.4 |
23,334 |
15,589 |
-33.2 |
Motor finance receivables at period end |
280,757 |
263,452 |
246,766 |
-6.3 |
280,757 |
246,766 |
-12.1 |
Bridging receivables at period end |
20,993 |
18,454 |
34,144 |
85.0 |
20,993 |
34,144 |
62.6 |
Revenue |
|||||||
Motor finance |
43,376 |
41,187 |
38,366 |
-6.8 |
85,465 |
79,553 |
-6.9 |
Property bridging |
2,401 |
1,640 |
2,568 |
56.6 |
4,474 |
4,208 |
-5.9 |
Total |
45,777 |
42,827 |
40,934 |
-4.4 |
89,939 |
83,761 |
-6.9 |
Impairments |
|||||||
Motor finance |
(8,929) |
(21,369) |
(14,626) |
-31.6 |
(16,507) |
(35,995) |
118.1 |
Property bridging |
(395) |
(307) |
(403) |
31.3 |
(713) |
(710) |
-0.4 |
Total |
(9,324) |
(21,676) |
(15,029) |
-30.7 |
(17,220) |
(36,705) |
113.2 |
Other cost of sales |
(9,623) |
(7,146) |
(7,118) |
-0.4 |
(19,872) |
(14,264) |
-28.2 |
Administration expenses |
(6,032) |
(5,455) |
(5,121) |
-6.1 |
(12,413) |
(10,576) |
-14.8 |
EBITDA |
20,798 |
8,550 |
13,666 |
59.8 |
40,434 |
22,216 |
-45.1 |
Depreciation |
(224) |
(252) |
(268) |
6.3 |
(450) |
(520) |
15.6 |
Operating profit/loss |
20,574 |
8,298 |
13,398 |
61.5 |
39,984 |
21,696 |
-45.7 |
Finance expense |
(2,578) |
(1,989) |
(1,579) |
-20.6 |
(4,850) |
(3,568) |
-26.4 |
Pre-tax profit |
17,996 |
6,309 |
11,819 |
87.3 |
35,134 |
18,128 |
-48.4 |
Tax |
(3,131) |
(1,225) |
(2,257) |
84.2 |
(6,252) |
(3,482) |
-44.3 |
Net profit |
14,865 |
5,084 |
9,562 |
88.1 |
28,882 |
14,646 |
-49.3 |
EPS fully diluted (p) |
123.3 |
41.9 |
78.8 |
88.1 |
239.4 |
120.7 |
-49.6 |
Dividend per share (p) |
86.0 |
22.0 |
68.0 |
120.0 |
90.0 |
-25.0 |
Source: S&U, Edison Investment Research
Looking more closely at Advantage Motor Finance results, there were 15,589 loan transactions, down 33% from FY20, reflecting caution on the part of customers and the limitations during lock-down periods on access to dealers and capacity constraints even for those customers who wished to use click and collect services. Transactions in the second half were slightly lower than the first half, but recovered to 80% of original budget by Q4 and were on track to reach 100% in March.
In managing the business Advantage focuses on cash collections and in FY21 the monthly collection rate against the contractual rate due was 84% compared with 94% in FY20. S&U notes that achieving this level of payment performance in the circumstances reflects the mitigating effect of its emphasis on customer relationships through clear communications, affordability analysis and forbearance. Exhibit 3 shows how the pandemic affected the payment profile in Advantage motor finance. Here S&U has included accounts on payment holiday as in arrears to illustrate the effect on cash payments (in the accounts, in line with Bank of England guidance, they are not counted as part of Stage 3 or credit impaired provisioning). In the analysis the proportion of net receivables where payments are up to date declined by 17 percentage points between FY20 and FY21. The over six months past-due category, at 10.1%, has seen the largest increase both over the year and compared with the half-year stage: a reflection of the impact of the pandemic on those customers already facing difficulties and the granting of extended payment holidays. Otherwise, the up-to-date percentage has nudged up since H121 and (not shown) the percentage of non-payment holiday accounts up to date was c 90%. At the year end 3,728 accounts were on payment holiday with the figure falling to below 3,000 at end March, and Advantage expects a reduction to below 2,000 during April.
Exhibit 3: Motor finance receivables payments analysis
% unless shown |
FY20 |
H121 |
FY21 |
Up to date |
77.9 |
59.4 |
60.8 |
Monthly payments past due - up to: |
|||
1 |
9.0 |
5.3 |
4.5 |
2 |
3.9 |
5.1 |
3.3 |
3 |
2.4 |
9.9 |
7.8 |
4 |
1.5 |
8.1 |
5.1 |
5 |
0.9 |
4.4 |
3.5 |
6 |
0.6 |
2.0 |
2.9 |
Over 6 |
2.0 |
4.1 |
10.1 |
Legal and debt recovery |
1.8 |
1.8 |
1.9 |
Total net receivables |
100.0 |
100.0 |
100.0 |
Total net receivables (£m) |
280.8 |
263.5 |
246.7 |
Source: S&U, Edison Investment Research. Note: Payment holidays here are shown as arrears.
As noted, the motor finance P&L impairment charge increased by more than 100% reflecting the forward-looking requirements of IFRS 9. While accounts where FCA-mandated payment holidays are in place are not treated as credit impaired, an economic overlay has been applied. A key assumption used in determining this is the level of UK unemployment.
Exhibit 4 sets out the analysis of balance-sheet loan-loss provisions for FY20 and FY21. This shows an overall increase in provisions from 18% to 25%1 of gross receivables with the increase arising in the stage 2 and stage 3 categories. Normally there are few stage 2 customers as all those one month or more in contractual arrears are counted as credit impaired and therefore in stage 3. Included within stage 2 for FY21 are customers who have requested a payment holiday and have had a previous delinquency or who have requested a second payment holiday, on the assumption that they have a significantly increased credit risk. The assumed loss rate on these customers is similar to those assigned to stage 3. The loss rate applied in stage 3 has been increased for those customers who have been granted a payment holiday; without this adjustment the level of impairment provision would have been £2.5m lower. While not expecting a write-back of provisions, S&U believes it has taken a prudent view in its provisioning assumptions, something that will only be demonstrated over the remaining life of the outstanding loans as collections are made.
For comparison, the June 2020 figure for Provident Financial’s Moneybarn subsidiary was 18.8% with PFG’s full year figures due to be announced in May.
Exhibit 4: Balance-sheet loan-loss provision analysis – motor finance
Year end January |
2020 |
2021 |
2020 |
2021 |
£m |
£m |
% of gross receivables |
|
Stage 1 (12 months ECL) |
13.4 |
14.4 |
3.9 |
3.8 |
Stage 2 (lifetime ECL) |
0.1 |
12.8 |
0.0 |
3.4 |
Stage 3 credit impaired (lifetime ECL) |
49.9 |
65.5 |
14.5 |
17.5 |
Provision |
63.4 |
92.6 |
18.4 |
24.8 |
Gross receivables |
344.1 |
373.8 |
100.0 |
100.0 |
Source: S&U, Edison Investment Research. Note: ECL= expected credit loss
Operationally, Advantage has been working to improve its sales offering, continuing to refine its business quality and underwriting, containing costs, maintaining regulatory standards, developing forbearance activities, enhancing digital marketing, developing new routes to market and carrying out a review of the electric vehicle market.
On the sales offering, a more aggressively priced product was introduced for lower-risk, near-prime customers (tier A+) and a selective return was made to lending to the higher-risk tier E. There was also a partial return to lending to the self-employed and a new rate structure has been adopted for this segment.
As noted earlier, a third credit rating agency has been introduced and work is under way to integrate its data into Advantage’s credit scoring system before carrying out a scorecard redesign.
Other IT work involves a redesign of the website portal, and search engine optimisation to target existing and previous customers.
Turning to Aspen Bridging, the business had a strong second half recovery with 55 transactions completed compared with 25 in H121, which was affected by a pandemic-related hiatus in activity. Full-year gross lending of £43.5m was at a record level and compared with £31.3m in FY20. Year-end net bridging receivables increased by 63% to £34.1m. While the average level of receivables increased by nearly 4%, interest/fee income was 6% lower giving a yield on average receivables of 18.3% versus 20.2% in FY20, reflecting changes in mix within a relatively small loan book. At the year-end only two loans were past due and since then no loans are past due or in agreed extension. The FY21 loan-loss provision was effectively unchanged at £0.7m and there were small increases in cost of sales and other costs leaving profit at £0.8m versus £1.2m.
Following the year end Aspen was approved as a Coronavirus Business Interruption Loan Scheme (CBILS) lender. These loans are backed by government guarantees, but normal Aspen underwriting criteria are applied. Applications had to be made by the end of March and need to be formalised by May. S&U indicated it could make loans of up to £40m under this scheme, although the net addition might well be lower given a potential reduction in normal business as the team processes CBILS loans. In addition to adding a significant tranche of debt to the book, the scheme lending will help establish relationships with new brokers and customers.
Background and outlook
This section provides updates on some of the indicators we monitor when assessing trends in the markets for the Advantage and Aspen businesses and discusses the outlook for the two businesses.
Starting with Advantage, Exhibit 5 shows forecasts for UK GDP and unemployment as collected by the UK Treasury in March. Focusing on 2021, the average GDP forecast is above the figure included in the January compilation with the low estimate switching from a contraction to 2.1% growth and the average estimate marginally up from 4.5% to 4.7%. Unemployment forecasts are also more positive, with the average unemployment expectation slightly lower at 6.4% compared with 6.7% and new forecasts at 6.2%. Here the continued success of the vaccination programme improves hopes for more limited further restrictions towards the end of calendar 2021, bolstering business confidence and hence job retention. For Advantage, a key sensitivity is unemployment, so any potential softening in the peak level of unemployment against earlier expectations could be helpful (subject to the actual incidence of unemployment in the customer base).
Exhibit 5: Comparison of independent economic forecasts for the UK (March)
% |
Average |
Average of new forecasts |
Low |
High |
|
GDP growth |
|||||
2021 |
4.7 |
4.8 |
2.1 |
6.1 |
|
2022 |
6.1 |
6.1 |
3.3 |
8.7 |
|
Labour Force Survey unemployment rate Q4 |
|||||
2021 |
6.4 |
6.2 |
5.7 |
7.5 |
|
2022 |
5.5 |
5.4 |
4.6 |
7.5 |
|
Source: HM Treasury
Exhibit 6 shows clear signs of consumer confidence reviving as further easing of lockdown restrictions come into sight. Prospectively, if positive trends in infections and related data with the build-up of the vaccination programme are maintained then this should have a further positive effect on confidence. Conversely, developments such as the emergence of more challenging COVID-19 variants cannot be ruled out. Exhibit 7 shows that the unemployment rate has moved up although it is a lagging indicator and is still being cushioned by government job protection measures. Redundancies have shown a sharp increase, topping the level seen during the global financial crisis. However, the rate of redundancies may subside quite rapidly as economic recovery becomes established and has already shown a decline from its peak level in the latest reading for January. Unemployment may worsen before easing given the prospective ending of government support measures, which is likely to be reflected in the economic forecasts shown above.
|
Exhibit 6: GFK UK consumer confidence indicator |
Exhibit 7: UK redundancies and unemployment |
|
|
|
Source: Bloomberg (last value March 2021) |
Source: Bloomberg (last value January 2021) |
|
Exhibit 6: GFK UK consumer confidence indicator |
|
|
Source: Bloomberg (last value March 2021) |
|
Exhibit 7: UK redundancies and unemployment |
|
|
Source: Bloomberg (last value January 2021) |
Next are data on used car transactions and used car finance. Exhibit 8 shows the sharp drop in used car transactions in the first half of calendar 2020 when compared with the monthly figures for the prior two years. The striking point here is how well volume recovered following the initial lockdown, albeit with a dip in Q4 coinciding with the second lockdown. Exhibit 9 tells a similar story for used car finance with the additional point that the January reading was depressed with a 34% y-o-y reduction. The Finance & Leasing Association (FLA) looks for overall car finance new business to fall by 16% in calendar Q1 as a whole as the impact of the latest lockdown has been mitigated by the use of click and collect. Once showrooms reopen, the FLA expects a strong recovery in the market with the overall value of new car finance business for calendar 2021 growing by 17%, followed by 12% in 2022. Advantage is preparing for a bounce in demand as showrooms reopen on 12 April, mirroring the bounce in demand it saw following the initial lockdown in 2020.
|
Exhibit 8: Used car transactions 2018, 2019 and 2020 |
Exhibit 9: Used car finance through dealerships |
|
|
|
Source: SMMT, Edison Investment Research |
Source: Finance and Leasing Association. Note: By volume. |
|
Exhibit 8: Used car transactions 2018, 2019 and 2020 |
|
|
Source: SMMT, Edison Investment Research |
|
Exhibit 9: Used car finance through dealerships |
|
|
Source: Finance and Leasing Association. Note: By volume. |
As far as used car prices are concerned, these have been buoyant in 2020 and early 2021 with strong consumer demand and reduced supply pushing prices up; the Autotrader retail price index showed like-for-like increases of over 7% y-o-y in the five months to January. Auctioneer Aston Barclay has commented that there was some softening of prices in February but, looking ahead, it expects the release of pent-up demand in April to put upward pressure on prices with supply unlikely to catch up for a few months. A return to a more balanced market and lower prices in some segments could be hastened by increased repossessions in due course. For Advantage the exposure to lower auction prices on repossessions is limited by the relatively low value of the vehicles it finances.
Beyond the near-term bounce in demand, Advantage looks to achieve growth through gaining a greater share of the deals it approves, but where the loan offer is not taken up, by its work to address existing and previous customers through search engine optimisation, by widening the numbers of broker relationships, by winning more business through comparison websites and by developing affinity partnerships.
Looking at the background for Aspen Bridging, Exhibit 10 shows the number of UK non-residential and residential transactions with residential being most relevant for Aspen. Both have seen an extended post lockdown bounce with a stronger move evident for residential transactions. On a longer view, S&U sees an imbalance between supply and demand for good quality homes as a favourable backdrop for its customers who are refurbishing and developing properties. Additionally, as a small business, Aspen should have significant scope for expansion now that it is more established in the market and has gained experience having provided 234 loan facilities since it was founded. To this end the team has been expanded and the product offering amended with a longer original term (11 months versus nine) and larger maximum size (£5m versus £3m) than originally. The CBILS lending mentioned earlier could also give useful access to new customers and brokers as well as expanding the loan book in the short term.
|
Exhibit 10: UK property transactions (seasonally adjusted) |
|
|
Source: HM Revenue & Customs. Note: Figures for December 2020 to February 2021 are provisional. |
As a balancing note to the broadly encouraging indicators set out above, it should be remembered that sensitivities remain for both businesses with maintenance of credit disciplines, regulatory developments, the nature of the macroeconomic background and funding costs and availability among the factors to consider. Also, both car finance and bridging markets are competitive and subject intermittently to increased pressure from new entrants or changes in competitor behaviour that could adversely affect results for a period.
In the next section we set out changes in our estimates and the group’s financial position.
Financials
Changes in the key numbers from our estimates following the FY21 results are shown in Exhibit 11. The figures for FY21 show our estimate (old) and actual outcome (new). As can be seen, the FY21 result was close to expectation and the changes to profit and EPS estimates for FY22 and FY23 are minor. Our new revenue estimate for FY22 is 8% higher, reflecting higher receivables and revenue growth at both Aspen and Advantage with a more cautious assumption on the impairment charge at Advantage largely offsetting this.
Exhibit 11: Changes to estimates
Year-end |
Revenue (£m) |
PBT (£m) |
EPS (p) |
DPS (p) |
||||||||
Old |
New |
Change (%) |
Old |
New |
Change (%) |
Old |
New |
Change (%) |
Old |
New |
Change (%) |
|
FY21 |
82.0 |
83.8 |
2.2% |
18.4 |
18.1 |
-1.5% |
122.7 |
120.7 |
-1.6% |
90.0 |
90.0 |
0.0% |
FY22e |
82.0 |
88.6 |
8.1% |
23.8 |
23.9 |
0.2% |
158.9 |
159.2 |
0.2% |
100.0 |
100.0 |
0.0% |
FY23e |
92.9 |
94.5 |
1.6% |
31.4 |
31.8 |
1.0% |
209.9 |
211.9 |
1.0% |
110.0 |
110.0 |
0.0% |
Source: Edison Investment Research. Note: For FY21 ‘old’ = estimate, and ‘new’ = actual.
The next table gives details of our estimate assumptions. In the motor business we have allowed for receivables growth of 7% and 8% for FY22 and FY23, respectively (similar to our previous estimate), and look for a decline in the level of impairments in both years leaving FY23 impairments at 25% of revenue and the risk-adjusted yield (revenue less impairments as a % of average receivables) at 21.5% (FY18–20 average 25.4%). Bridging receivables are assumed to reach £84m in the current fiscal year followed by £105m as the business is expanded to a level where it makes a more significant contribution to the group.
Exhibit 12: Estimate summary
£000 except where shown Year-end January |
FY21 |
FY22e |
FY23e |
% change FY22 |
% change FY23 |
Number of new motor loans |
15,589 |
21,800 |
23,050 |
39.8 |
5.7 |
Motor finance receivables at period end |
246,766 |
264,284 |
284,364 |
7.1 |
7.6 |
Bridging receivables at period end |
34,144 |
84,000 |
105,000 |
146.0 |
25.0 |
Revenue |
|||||
Motor finance |
79,553 |
78,126 |
78,779 |
-1.8 |
0.8 |
Property bridging |
4,208 |
10,461 |
15,683 |
148.6 |
49.9 |
Total |
83,761 |
88,587 |
94,461 |
5.8 |
6.6 |
Impairments |
|||||
Motor finance |
(35,995) |
(26,550) |
(19,695) |
-26.2 |
-25.8 |
Property bridging |
(710) |
(1,674) |
(2,509) |
135.7 |
49.9 |
Total |
(36,705) |
(28,223) |
(22,204) |
-23.1 |
-21.3 |
Other cost of sales |
(14,264) |
(20,156) |
(21,521) |
41.3 |
6.8 |
Administration expenses |
(10,576) |
(11,516) |
(12,563) |
8.9 |
9.1 |
EBITDA |
22,216 |
28,692 |
38,173 |
29.1 |
33.0 |
Depreciation |
(520) |
(528) |
(475) |
1.5 |
-10.0 |
Operating profit / loss |
21,696 |
28,164 |
37,698 |
29.8 |
33.9 |
Finance expense |
(3,568) |
(4,310) |
(5,946) |
20.8 |
37.9 |
Pre-tax profit |
18,128 |
23,853 |
31,752 |
31.6 |
33.1 |
Tax |
(3,482) |
(4,532) |
(6,033) |
30.2 |
33.1 |
Net profit |
14,646 |
19,321 |
25,720 |
31.9 |
33.1 |
EPS fully diluted (p) |
120.7 |
159.2 |
211.9 |
31.9 |
33.1 |
Dividend per share (p) |
90.0 |
100.0 |
110.0 |
11.1 |
10.0 |
Source: Edison Investment Research
The segmental cash flow analysis below highlights the major turnaround in cash flow at Advantage as growth was replaced by contraction during FY21. The pattern was as expected with the slowdown in advances outpacing the reduction in collections as payment holidays and forbearance took effect. As a result, the outflow of £6m in FY20 was replaced by an inflow of £32m. Aspen Bridging maintained good collections and debt recovery and with increased advances saw a greater outflow of £12.5m versus £1.8m. At the group level this left an inflow of £19m and net debt just below £100m and net debt/equity at 55%. Following the year end, committed funding facilities have been increased by £25m taking the total to £155m, providing headroom to meet the expected near-term bounce in demand for lending. On our estimates, net debt could rise to c £186m by end FY23 with net debt/equity at 92% (similar to our previous estimate and higher than historical levels – FY18–21 average 64%).
Exhibit 13: Segmental cash flow analysis
£m |
FY19 |
FY20 |
FY21 |
Comments on FY21 versus FY20 |
|
Motor Finance |
|||||
Advances |
(129.2) |
(149.0) |
(102.6) |
Lockdowns and tighter underwriting drive 31% fall |
|
Monthly collections |
138.1 |
148.1 |
138.5 |
Down on payment holidays and lower advances |
|
Settlements/reloans |
27.9 |
30.2 |
28.0 |
||
Debt recovery |
15.5 |
18.3 |
13.8 |
Forbearance plus FCA/COVID-19 restrictions on repossessions |
|
Overheads/interest |
(30.4) |
(34.8) |
(27.2) |
||
Corporation tax |
(5.5) |
(6.3) |
(6.2) |
||
Dividend |
(10.5) |
(12.6) |
(12.7) |
||
Motor Finance (outflow)/inflow |
5.9 |
(6.1) |
31.6 |
Cash generation as advances slow |
|
Property bridging |
|||||
Gross advances |
(23.1) |
(31.3) |
(43.5) |
Recovery in advances in last 8 months of year |
|
Retention collections |
2.5 |
3.3 |
5.2 |
||
Collections |
14.0 |
16.6 |
15.2 |
Good collections |
|
Debt recovery |
1.8 |
12.4 |
13.6 |
Successful recoveries and none outstanding in March |
|
Overheads/interest |
(1.7) |
(2.6) |
(2.8) |
||
Corporation tax |
(0.2) |
(0.2) |
|||
Property bridging (outflow)/inflow |
(6.5) |
(1.8) |
(12.5) |
Advances up despite pandemic pause in H1 |
|
Other (outflow)/inflow |
(2.4) |
(1.9) |
(0.1) |
||
Group (outflow)/inflow |
(3.0) |
(9.8) |
19.0 |
||
Opening net debt |
105.0 |
108.0 |
117.8 |
||
Closing net debt |
108.0 |
117.8 |
98.8 |
Source: S&U, Edison Investment Research. Note: Net debt is shown excluding lease liability.
Valuation
P/E comparisons with peers remain difficult to interpret given the impact of forward-looking provisions in the post-COVID-19 period so we continue to frame valuation using our ROE/COE calculations. If we assume a cost of equity (COE) of 10% and long-term growth of 2%, then the share price at the time of writing (2,250p) would be consistent with an ROE of 14%, which is modestly above the 13.2% we estimate for FY23. Arguably, even that year might not reflect a full recovery from the impact of COVID-19 with our assumed risk-adjusted yield still below prior levels and historically S&U has achieved higher returns on equity (the five-year average for the period FY16–20 is 16.3%).
Exhibit 14: Financial summary
£'000s |
2017 |
2018 |
2019 |
2020 |
2021 |
2022e |
2023e |
||
Year end 31 January |
|||||||||
PROFIT & LOSS |
|||||||||
Revenue |
|
|
60,521 |
79,781 |
82,970 |
89,939 |
83,761 |
88,587 |
94,461 |
Impairments |
(12,194) |
(19,596) |
(16,941) |
(17,220) |
(36,705) |
(28,223) |
(22,204) |
||
Other cost of sales |
(12,871) |
(17,284) |
(15,751) |
(19,872) |
(14,264) |
(20,156) |
(21,521) |
||
Administration expenses |
(8,332) |
(9,629) |
(10,763) |
(12,413) |
(10,576) |
(11,516) |
(12,563) |
||
EBITDA |
|
|
27,124 |
33,272 |
39,515 |
40,434 |
22,216 |
28,692 |
38,173 |
Depreciation |
|
|
(253) |
(294) |
(414) |
(450) |
(520) |
(528) |
(475) |
Op. profit (incl. share-based payouts pre-except.) |
|
|
26,871 |
32,978 |
39,101 |
39,984 |
21,696 |
28,164 |
37,698 |
Exceptionals |
0 |
0 |
0 |
0 |
0 |
0 |
0 |
||
Non recurring items |
0 |
0 |
0 |
0 |
0 |
0 |
0 |
||
Investment revenues / finance expense |
(1,668) |
(2,818) |
(4,541) |
(4,850) |
(3,568) |
(4,310) |
(5,946) |
||
Profit before tax |
|
|
25,203 |
30,160 |
34,560 |
35,134 |
18,128 |
23,853 |
31,752 |
Tax |
(4,861) |
(5,746) |
(6,571) |
(6,252) |
(3,482) |
(4,532) |
(6,033) |
||
Profit after tax |
|
|
20,342 |
24,414 |
27,989 |
28,882 |
14,646 |
19,321 |
25,720 |
Average Number of Shares Outstanding (m) |
12.0 |
12.1 |
12.1 |
12.1 |
12.1 |
12.1 |
12.1 |
||
Diluted EPS (p) |
|
|
169.1 |
202.4 |
232.0 |
239.4 |
120.7 |
159.2 |
211.9 |
EPS - basic (p) |
|
|
170.7 |
203.8 |
233.2 |
239.6 |
120.7 |
159.2 |
212.0 |
Dividend per share (p) |
91.0 |
105.0 |
118.0 |
120.0 |
90.0 |
100.0 |
110.0 |
||
EBITDA margin (%) |
44.8% |
41.7% |
47.6% |
45.0% |
26.5% |
32.4% |
40.4% |
||
Operating margin (before GW and except.) (%) |
44.4% |
41.3% |
47.1% |
44.5% |
25.9% |
31.8% |
39.9% |
||
Return on equity |
15.2% |
16.7% |
17.6% |
16.8% |
8.1% |
10.5% |
13.2% |
||
BALANCE SHEET |
|||||||||
Non-current assets |
|
|
138,004 |
181,015 |
185,383 |
197,806 |
173,413 |
231,494 |
258,273 |
Current assets |
|
|
57,763 |
84,178 |
95,430 |
108,275 |
111,426 |
122,305 |
136,754 |
Total assets |
|
|
195,767 |
265,193 |
280,813 |
306,081 |
284,839 |
353,799 |
395,027 |
Current liabilities |
|
|
(17,850) |
(7,927) |
(6,722) |
(7,424) |
(5,309) |
(4,357) |
(4,518) |
Non current liabilities inc pref |
(38,450) |
(104,450) |
(108,724) |
(119,183) |
(98,501) |
(160,923) |
(188,345) |
||
Net assets |
|
|
139,467 |
152,816 |
165,367 |
179,474 |
181,029 |
188,519 |
202,164 |
NAV per share (p) |
1,177 |
1,276 |
1,375 |
1,493 |
1,505 |
1,568 |
1,681 |
||
CASH FLOW |
|||||||||
Operating cash flow |
|
|
(27,431) |
(43,418) |
10,530 |
4,946 |
32,940 |
(47,259) |
(14,729) |
Net cash from investing activities |
(308) |
(1,040) |
(785) |
(265) |
(1,112) |
(250) |
(250) |
||
Dividends paid |
(9,548) |
(11,377) |
(13,080) |
(14,461) |
(13,098) |
(11,892) |
(12,134) |
||
Other financing (excluding change in borrowing) |
21 |
12 |
14 |
14 |
2 |
0 |
0 |
||
Net cash flow |
|
|
(37,266) |
(55,823) |
(3,321) |
(9,766) |
18,732 |
(59,401) |
(27,113) |
Opening net (debt)/cash |
|
|
(11,901) |
(49,167) |
(104,990) |
(108,311) |
(118,077) |
(99,345) |
(158,746) |
Closing net (debt)/cash |
|
|
(49,167) |
(104,990) |
(108,311) |
(118,077) |
(99,345) |
(158,746) |
(185,859) |
Source: S&U accounts, Edison Investment Research
|
|||||||||||||||||||||||||||||||||||||||||||||||||||
|
|
Research: Investment Companies
Heliad’s FY20 results were supported by 165% share price growth at flatexDEGIRO (formerly flatex), its largest portfolio holding, representing c 68% of NAV at end-FY20, and a partial exit from this company announced in July 2020. Liquidity was high at end-FY20 (cash at c 19% of NAV), which we believe could be used for new investments. Heliad continues to trade at a notable discount to NAV.