Last close As at 05/08/2026
EUR277.40
— 0.00 (0.00%)
Market capitalisation
—
Research: TMT
Esker reported a strong close to the year, with Q421 revenue up 16% y-o-y despite a resurgence of the pandemic in December and FY21 revenue ahead of our estimate. Growth in both the annual recurring value and average length of contracts signed in FY21 provides support for management’s expectations of 16% revenue growth in FY22. Esker also recently agreed to acquire Market Dojo, an e-procurement software provider, to enhance its Procure-to-Pay offering. We have revised our forecasts to reflect better FY21 revenues, currency and the acquisition. Our normalised diluted EPS forecast increases by 3.2% in FY21 and reflecting investment in Market Dojo, reduces by 3.2% in FY22.
Esker |
Positive outlook |
Q4 revenue update |
Software & comp services |
18 January 2022 |
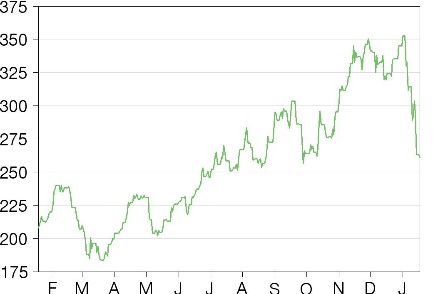
Share price performance
Business description
Next events
Analyst
Esker is a research client of Edison Investment Research Limited |
|||||||||||||||||||||||||||||||||||||||||||||
Esker reported a strong close to the year, with Q421 revenue up 16% y-o-y despite a resurgence of the pandemic in December and FY21 revenue ahead of our estimate. Growth in both the annual recurring value and average length of contracts signed in FY21 provides support for management’s expectations of 16% revenue growth in FY22. Esker also recently agreed to acquire Market Dojo, an e-procurement software provider, to enhance its Procure-to-Pay offering. We have revised our forecasts to reflect better FY21 revenues, currency and the acquisition. Our normalised diluted EPS forecast increases by 3.2% in FY21 and reflecting investment in Market Dojo, reduces by 3.2% in FY22.
Year end |
Revenue (€m) |
PBT* |
Diluted EPS* |
DPS |
P/E |
Yield (%) |
12/19 |
104.2 |
13.6 |
1.79 |
0.33 |
145.8 |
0.1 |
12/20 |
112.3 |
14.5 |
1.99 |
0.50 |
131.2 |
0.2 |
12/21e |
133.7 |
19.7 |
2.59 |
0.55 |
100.8 |
0.2 |
12/22e |
157.1 |
23.7 |
3.07 |
0.60 |
85.0 |
0.2 |
Note: *PBT and EPS are normalised, excluding amortisation of acquired intangibles, exceptional items and share-based payments.
FY21 revenue ahead of expectations
Esker reported Q421 revenue of €35.9m (+16% y-o-y) and FY21 revenue of €133.7m (+19% y-o-y, 1.6% ahead of our forecast). The annual recurring revenue (ARR) of orders received in the year increased 25% to €13.2m and the average contract length increased from 3.2 years in FY20 to 3.6 years in FY21. The company expects to generate revenue of c €155m in FY22 (+16%) and maintained its operating margin target range of 12–15%.
Acquiring e-procurement business, Market Dojo
Esker has agreed to acquire Market Dojo, a provider of SaaS-based e-procurement software, with the deal structured in two stages: 50.1% to be acquired upfront and the remaining 49.9% after four years, funded 80/20 cash/equity. We have factored in an initial cost of €10.2m in Q122 and assume the business is operating at break-even. Market Dojo provides software for the earlier part of the procurement process (eg e-sourcing, reverse auctions), rounding out Esker’s Procure-to-Pay offering. We have revised our forecasts to reflect currency, stronger than expected performance in Q421, guidance for FY22 and the Market Dojo deal.
Valuation: Reflects growth in recurring revenues
After doubling in 2021, the stock has declined 27% year to date, and continues to trade at a premium to document processing automation software and French software peers but at a discount to US SaaS peers. Esker’s valuation metrics have moved much closer to the US SaaS software peer group over the last two years. We believe this is due to the value placed on businesses with high levels of recurring revenue, providing visibility through a period of economic uncertainty, and the potential for multi-year, profitable, double-digit growth. Esker has the added advantage of a strong balance sheet to fund growth.
Acquisition of Market Dojo
Esker has announced the planned acquisition of e-procurement software business Market Dojo. Market Dojo (MD) was established in 2010 in the UK and has 20 employees and more than 160 customers (60% outside of the UK, including France, the US and the Middle East). MD provides SaaS-based software for the procurement market, with solutions for e-sourcing and supplier engagement. MD generated trailing 12-month revenue of £1.3m, representing growth of 30%.
Terms of the deal
Esker will initially buy 50.1% of the company and will buy the remaining 49.9% after four years. In both cases, the company will be valued at 13x annual recurring revenue (Esker currently trades at c 16.4x FY21e recurring revenue). The price will be settled in a mixture of cash and equity in the ratio 80/20, with shares locked up for two years. MD will continue to operate as a standalone business over the next four years, although we would expect Esker and MD to work closely together to grow the MD business and introduce MD customers to Esker.
The company has not disclosed the ARR to be used for the first payment. We have made the following assumptions:
■
Initial payment: using an ARR of £1.3m (trailing 12-month revenue), we estimate a payment of £8.5m/€10.2m (using €1.2/£).
■
Final payment: using a 30% growth rate per year, this would imply ARR of £3.7m after four years and a payment of £24.1m/€28.9m.
Deal rationale
Esker’s Procure-to-Pay suite has evolved from its Accounts Payable automation software, with functionality added over time to address the earlier parts of the procurement cycle such as supplier, contract and catalogue management. A major area of product development for the company has been and continues to be deepening this functionality. The acquisition of MD brings additional functionality for the procurement process, including e-sourcing, reverse auction and category spend analysis, as well as supplier management, supplier onboarding and contract management. In addition, MD typically serves customers for both direct and indirect spend, whereas Esker has historically served more of the indirect spend market.
Q421 revenue update
Esker reported Q421 revenue of €35.9m, up 16% y-o-y or 14% at constant currency (cc). This resulted in FY21 revenue of €133.7m, up 19% or 20% cc, and 1.6% ahead of our €131.6m forecast. The company noted that December saw a slowing in transaction volumes due to the resurgence of the pandemic but, despite this, saw Q421 SaaS revenue increase 20% y-o-y/18% cc and FY21 SaaS revenue increase 22%/23% cc. Revenue from implementation services increased 18% year-on-year/19% cc in FY21, growing from €5.5m in Q121 to €6.2m in Q421. Revenue from legacy products declined 12% y-o-y/10% cc.
The company received bookings worth €3.65m in ARR in Q421, slightly down from the €3.78m in Q420, which was a record quarter for Esker and reflected a catch-up in orders after pandemic-related delays earlier in FY20. The company noted that the resurgence of the pandemic delayed the signing of some contracts in Q421. The ARR of orders received in FY21 was €13.2m, 25% higher y-o-y.
The lifetime value of orders received in FY21 was €48.0m, 38% higher than in FY20 (note that this includes the value of SaaS subscriptions only, with volume-related fees excluded from this measure as they are variable). This implies an average contract length of 3.6 years for contracts signed in FY21 compared to 3.2 years in FY20.
Esker expects to report operating income at a similar level to H121 (14.3% margin) and closed the year with a net cash position of €38.6m.
For FY22, the company expects to achieve double-digit organic growth with sales around €155m (our forecast was €153.6m) and operating profitability of 12–15%.
Changes to forecasts
We have factored in the MD acquisition, assuming it completes in Q122. We assume that the company invests in Market Dojo in FY22 and FY23, reducing our operating margin forecast. We have also raised our revenue forecasts for the original Esker business in FY21 and FY22, mainly due to currency. We have revised our €/$ exchange rate assumptions for FY22 from 1.20 to 1.15 and this also results in increased operating expenses. Overall, our normalised diluted EPS increases by 3.2% in FY21e and falls by 3.2% in FY22e. We also introduce forecasts for FY23.
Exhibit 1: Changes to forecasts
€m |
FY21e old |
FY21e new |
change |
y-o-y |
FY22e old |
FY22e new |
change |
y-o-y |
FY23e new |
y-o-y |
Revenues |
131.6 |
133.7 |
1.6% |
19.1% |
153.6 |
157.1 |
2.3% |
17.5% |
183.2 |
16.6% |
EBITDA |
27.4 |
28.0 |
2.2% |
27.5% |
32.7 |
31.9 |
(2.4%) |
14.1% |
36.8 |
15.2% |
EBITDA margin |
20.8% |
20.9% |
0.1% |
1.4% |
21.3% |
20.3% |
(1.0%) |
(0.6%) |
20.1% |
(0.3%) |
Normalised EBIT |
18.2 |
18.8 |
3.3% |
33.9% |
23.1 |
22.3 |
(3.4%) |
18.9% |
26.6 |
19.0% |
Normalised EBIT margin |
13.8% |
14.1% |
0.2% |
1.6% |
15.1% |
14.2% |
(0.8%) |
0.2% |
14.5% |
0.3% |
Reported EBIT |
17.8 |
18.4 |
3.4% |
35.4% |
22.7 |
21.9 |
(3.5%) |
19.0% |
26.2 |
19.4% |
Reported EBIT margin |
13.5% |
13.8% |
0.2% |
1.7% |
14.8% |
14.0% |
(0.8%) |
0.2% |
14.3% |
0.3% |
Normalised PBT |
19.1 |
19.7 |
3.2% |
36.2% |
24.5 |
23.7 |
(3.2%) |
20.6% |
28.0 |
17.9% |
Normalised net income |
14.9 |
15.4 |
3.2% |
33.5% |
19.1 |
18.5 |
(3.2%) |
20.6% |
21.8 |
17.9% |
Reported net income |
14.6 |
15.1 |
3.2% |
30.4% |
18.8 |
18.2 |
(3.3%) |
20.7% |
21.5 |
18.2% |
Normalised dil. EPS (€) |
2.51 |
2.59 |
3.2% |
30.1% |
3.17 |
3.07 |
(3.2%) |
18.6% |
3.56 |
16.0% |
Reported basic EPS (€) |
2.54 |
2.63 |
3.2% |
28.8% |
3.22 |
3.11 |
(3.3%) |
18.6% |
3.62 |
16.2% |
Reported diluted EPS (€) |
2.46 |
2.54 |
3.2% |
27.1% |
3.11 |
3.01 |
(3.3%) |
18.7% |
3.50 |
16.3% |
Net cash |
38.2 |
38.5 |
0.7% |
27.0% |
47.9 |
38.4 |
(19.9%) |
(0.1%) |
49.8 |
29.7% |
DPS (€) |
0.55 |
0.55 |
0.0% |
10.0% |
0.60 |
0.60 |
0.0% |
9.1% |
0.65 |
8.3% |
Source: Edison Investment Research
Exhibit 2: Financial summary
€'000s |
2016 |
2017 |
2018 |
2019 |
2020 |
2021e |
2022e |
2023e |
||
Year end 31 December |
French GAAP |
French GAAP |
French GAAP |
French GAAP |
French GAAP |
French GAAP |
French GAAP |
French GAAP |
||
PROFIT & LOSS |
||||||||||
Revenue |
|
|
65,990 |
76,064 |
86,871 |
104,188 |
112,274 |
133,700 |
157,055 |
183,203 |
EBITDA |
|
|
14,871 |
16,399 |
18,279 |
20,054 |
21,927 |
27,968 |
31,922 |
36,771 |
Operating Profit (before amort and except) |
|
|
9,934 |
10,547 |
11,955 |
12,843 |
14,037 |
18,793 |
22,347 |
26,596 |
Amortisation of acquired intangibles |
(200) |
(300) |
(344) |
(425) |
(425) |
(425) |
(425) |
(425) |
||
Exceptionals and other income |
(474) |
(456) |
(88) |
(62) |
0 |
57 |
0 |
0 |
||
Other income |
0 |
0 |
0 |
0 |
0 |
0 |
0 |
0 |
||
Operating Profit |
9,260 |
9,791 |
11,523 |
12,356 |
13,612 |
18,425 |
21,922 |
26,171 |
||
Net Interest |
(108) |
(110) |
(57) |
268 |
(67) |
100 |
200 |
200 |
||
Profit Before Tax (norm) |
|
|
9,949 |
10,669 |
12,215 |
13,634 |
14,462 |
19,693 |
23,747 |
27,996 |
Profit Before Tax (FRS 3) |
|
|
9,275 |
9,913 |
11,783 |
13,147 |
14,528 |
19,325 |
23,322 |
27,571 |
Tax |
(2,950) |
(3,148) |
(2,940) |
(3,402) |
(2,966) |
(4,251) |
(5,131) |
(6,066) |
||
Profit After Tax (norm) |
6,785 |
7,281 |
9,168 |
10,106 |
11,509 |
15,360 |
18,522 |
21,837 |
||
Profit After Tax (FRS 3) |
6,325 |
6,765 |
8,843 |
9,745 |
11,562 |
15,073 |
18,191 |
21,505 |
||
Ave. Number of Shares Outstanding (m) |
5.3 |
5.3 |
5.4 |
5.4 |
5.7 |
5.7 |
5.8 |
5.9 |
||
EPS - normalised (c) |
|
|
128 |
138 |
170 |
186 |
203 |
268 |
317 |
368 |
EPS - normalised fully diluted (c) |
|
|
122 |
132 |
165 |
179 |
199 |
259 |
307 |
356 |
EPS - (GAAP) (c) |
|
|
120 |
128 |
164 |
180 |
204 |
263 |
311 |
362 |
Dividend per share (c) |
30 |
32 |
41 |
33 |
50 |
55 |
60 |
65 |
||
Gross margin (%) |
N/A |
N/A |
N/A |
N/A |
N/A |
N/A |
N/A |
N/A |
||
EBITDA Margin (%) |
22.5 |
21.6 |
21.0 |
19.2 |
19.5 |
20.9 |
20.3 |
20.1 |
||
Operating Margin (before GW and except) (%) |
15.1 |
13.9 |
13.8 |
12.3 |
12.5 |
14.1 |
14.2 |
14.5 |
||
BALANCE SHEET |
||||||||||
Fixed Assets |
|
|
28,324 |
37,912 |
39,635 |
47,201 |
48,987 |
51,687 |
65,247 |
68,847 |
Intangible Assets |
22,381 |
26,673 |
28,096 |
29,323 |
30,787 |
33,187 |
45,747 |
48,147 |
||
Tangible Assets |
5,158 |
7,115 |
7,050 |
10,434 |
10,036 |
9,536 |
9,336 |
9,336 |
||
Other |
785 |
4,124 |
4,489 |
7,444 |
8,164 |
8,964 |
10,164 |
11,364 |
||
Current Assets |
|
|
42,024 |
42,823 |
49,016 |
52,022 |
72,918 |
71,861 |
77,190 |
95,893 |
Stocks |
101 |
176 |
147 |
185 |
257 |
257 |
257 |
257 |
||
Debtors |
19,523 |
21,253 |
25,551 |
30,015 |
31,440 |
37,363 |
43,889 |
51,196 |
||
Cash |
21,338 |
20,632 |
22,794 |
21,357 |
40,421 |
33,441 |
32,243 |
43,640 |
||
Other |
1,062 |
762 |
524 |
465 |
800 |
800 |
800 |
800 |
||
Current Liabilities |
|
|
(28,299) |
(26,206) |
(30,072) |
(34,300) |
(50,150) |
(42,343) |
(46,368) |
(50,875) |
Creditors |
(28,299) |
(26,206) |
(30,072) |
(34,300) |
(38,650) |
(42,343) |
(46,368) |
(50,875) |
||
Short term borrowings |
0 |
0 |
0 |
0 |
(11,500) |
0 |
0 |
0 |
||
Long Term Liabilities |
|
|
(7,657) |
(14,909) |
(10,810) |
(8,276) |
(6,342) |
(3,842) |
(2,698) |
(2,698) |
Long term borrowings |
(7,657) |
(13,716) |
(9,318) |
(6,516) |
(3,644) |
(1,144) |
0 |
0 |
||
Other long term liabilities |
0 |
(1,193) |
(1,492) |
(1,760) |
(2,698) |
(2,698) |
(2,698) |
(2,698) |
||
Net Assets |
|
|
34,392 |
39,620 |
47,769 |
56,647 |
65,413 |
77,363 |
93,371 |
111,168 |
CASH FLOW |
||||||||||
Operating Cash Flow |
|
|
15,944 |
17,311 |
18,366 |
20,290 |
24,389 |
25,738 |
29,420 |
33,971 |
Net Interest |
(127) |
(75) |
63 |
352 |
(30) |
100 |
200 |
200 |
||
Tax |
(1,456) |
(2,053) |
(2,795) |
(3,329) |
(884) |
(4,251) |
(5,131) |
(6,066) |
||
Capex |
(7,021) |
(9,304) |
(7,789) |
(10,995) |
(10,167) |
(11,500) |
(12,200) |
(13,000) |
||
Acquisitions/disposals |
(935) |
(7,551) |
(225) |
(486) |
(492) |
0 |
(9,000) |
0 |
||
Financing |
467 |
(345) |
785 |
1,449 |
48 |
1,000 |
0 |
0 |
||
Dividends |
(1,550) |
(1,633) |
(1,756) |
(2,237) |
(1,896) |
(2,897) |
(3,343) |
(3,709) |
||
Net Cash Flow |
5,322 |
(3,650) |
6,649 |
5,044 |
10,968 |
8,189 |
(54) |
11,396 |
||
Opening net debt/(cash) |
|
|
(8,978) |
(13,681) |
(10,016) |
(16,576) |
(21,018) |
(30,285) |
(38,474) |
(38,420) |
HP finance leases initiated |
(645) |
0 |
0 |
0 |
0 |
0 |
0 |
0 |
||
Other |
26 |
(15) |
(90) |
(602) |
(1,701) |
0 |
(0) |
0 |
||
Closing net debt/(cash) |
|
|
(13,681) |
(10,016) |
(16,576) |
(21,018) |
(30,285) |
(38,474) |
(38,420) |
(49,817) |
Source: Esker, Edison Investment Research
|
|
Research: Industrials
Carr’s trading update for the first 20 weeks of FY22 notes that the group has made a positive start to the year with overall performance during the period broadly in line with Board expectations. Importantly, the announcement notes that while the Board sees potential for growth in each of the three divisions, there are limited opportunities to exploit inter-divisional synergies, so it has decided to conduct a strategic review. We leave our estimates unchanged and reiterate our indicative valuation of 170p/share.