Last close As at 05/08/2026
GBP6.14
— 0.00 (0.00%)
Market capitalisation
GBP898m
Research: Investment Companies
Standard Life Private Equity Trust (SLPET) recently reported a rebound in its NAV upon receiving the underlying valuations from its general partners (GPs) as at end-June, which brought its 12-month NAV total return to end-September 2020 to a positive 4.0%. Following the upsizing of its credit facility to £200m and the £61.9m in distributions received (vs £78.6m of capital calls in the period), SLPET’s commitments coverage ratio was a solid 49% at end September 2020. This is not adjusted for the £15.3m expected deferred consideration and £67.1m of commitments it considers unlikely to be called.
Standard Life Private Equity Trust |
Withstanding the crisis in good shape so far |
Investment trusts |
4 November 2020 |
Share price/discount performance
Three-year performance vs index
Gearing
Analysts
|
|||||||||||||||||||||||||||||||||||||||||||||||||||||||||||||||||||||||||||||||||||
Standard Life Private Equity Trust (SLPET) recently reported a rebound in its NAV upon receiving the underlying valuations from its general partners (GPs) as at end-June, which brought its 12-month NAV total return to end-September 2020 to a positive 4.0%. Following the upsizing of its credit facility to £200m and the £61.9m in distributions received (vs £78.6m of capital calls in the period), SLPET’s commitments coverage ratio was a solid 49% at end September 2020. This is not adjusted for the £15.3m expected deferred consideration and £67.1m of commitments it considers unlikely to be called.
|
SLPET’s 2020 ytd NAV TR performance vs peers (in sterling terms) |
|
|
Source: Morningstar, Edison Investment Research. Note: Based on latest available monthly NAV per share. *BMO Private Equity Trust based on end-June 2020, which is largely based on end-March 2020 valuations. |
The market opportunity
Although private equity investments remain at risk of further downward revaluations (alongside public markets) if the current crisis continues for a prolonged period, there are a number of supportive factors that could limit the impact on private equity (PE). These include: 1) private equity backed companies benefit from better access to capital, 2) value creation expertise allows GPs to perform well through the cycle, 3) a high level of dry powder is available to pursue new investment opportunities at more attractive prices and 4) fund-raising remains strong for top GPs.
Why consider investing in SLPET?
■
Continuous focus on top-performing European private equity managers.
■
Experienced investment team with strong PE manager relationships.
■
Top 10 conviction-based fund investments make up c 50% of NAV, while the underlying portfolio is diversified with 400+ holdings across different regions, sectors and vintages.
■
Long-term NAV outperformance of European and global PE indices.
Discount wider than peers and 10-year average
Following the recent NAV update (with the portfolio now valued as at end-June 2020), SLPET’s discount stands at c 34% and is much wider than its 10-year average of c 23% and the current peer group average (c 27%). The company has so far paid three interim dividends of 3.3p each, translating into an annualised yield of 4.2%.
Exhibit 1: Trust at a glance
Investment objective and fund background |
Recent developments |
|||||||||||||||||||||||||||||||||||||||||||||||||||||||||||||||||||||||||||||||||||||||||||
Standard Life Private Equity Trust’s objective is to achieve long-term total returns through investing in a diversified portfolio of leading private equity buyout funds and direct co-investments, a majority of which have a European focus, with exposure principally managed through the primary and secondary funds markets. No size or geographic restrictions apply to fund selection. There is currently no available benchmark that the board deems an appropriate measure of SLPET’s investment performance. |
■ 14 October 2020: Estimated NAV/share at end-September 2020: 466.5p. ■ 30 September 2020: Estimated NAV/share at end-August 2020: 459.9p. ■ 30 September 2020: Quarterly update at 30 June 2020, NAV/share: 473.9p. ■ 24 September 2020: Increase of loan facility to £200m. ■ 3 September 2020: Third interim dividend declared (3.3p per share). ■ 14 August 2020: Estimated NAV/share at end-July 2020: 421.4p. ■ 31 July 2020: Second interim dividend paid (3.3p per share). |
|||||||||||||||||||||||||||||||||||||||||||||||||||||||||||||||||||||||||||||||||||||||||||
Forthcoming |
Capital structure |
Fund details |
||||||||||||||||||||||||||||||||||||||||||||||||||||||||||||||||||||||||||||||||||||||||||
AGM |
March 2021 |
Ongoing charges |
1.09% (FY20)* |
Group |
Aberdeen Standard Investments |
|||||||||||||||||||||||||||||||||||||||||||||||||||||||||||||||||||||||||||||||||||||||
Full year results |
January 2021 |
Net cash |
4.6% (est. as at end-September 2020) |
Manager |
SL Capital Partners |
|||||||||||||||||||||||||||||||||||||||||||||||||||||||||||||||||||||||||||||||||||||||
Year end |
30 September |
Annual mgmt fee |
0.95% of NAV |
Address |
1 George Street, Edinburgh EH2 2LL |
|||||||||||||||||||||||||||||||||||||||||||||||||||||||||||||||||||||||||||||||||||||||
Dividend paid |
Jan, Apr, Jul, Oct |
Performance fee |
None |
|||||||||||||||||||||||||||||||||||||||||||||||||||||||||||||||||||||||||||||||||||||||||
Launch date |
29 May 2001 |
Trust life |
Indefinite |
Phone |
0131 245 0055 |
|||||||||||||||||||||||||||||||||||||||||||||||||||||||||||||||||||||||||||||||||||||||
Continuation vote |
N/A |
Loan facilities |
£200m revolving credit facility |
Website |
||||||||||||||||||||||||||||||||||||||||||||||||||||||||||||||||||||||||||||||||||||||||
Dividend policy and history (financial years) |
Share buyback policy and history (financial years) |
|||||||||||||||||||||||||||||||||||||||||||||||||||||||||||||||||||||||||||||||||||||||||||
Since FY17, the board’s intention has been to maintain the real value of the annual dividend. Four quarterly dividends of 3.3p are planned for FY20. |
The board views buybacks as part of its strategy in relation to capital efficiency. SLPET has authority to repurchase 14.99% and allot 5.0% of its issued capital. |
|||||||||||||||||||||||||||||||||||||||||||||||||||||||||||||||||||||||||||||||||||||||||||
|
|
|||||||||||||||||||||||||||||||||||||||||||||||||||||||||||||||||||||||||||||||||||||||||||
Shareholder base (as at 3 November 2020) |
Portfolio exposure by maturity (as at 31 March 2020) |
|||||||||||||||||||||||||||||||||||||||||||||||||||||||||||||||||||||||||||||||||||||||||||
|
|
|||||||||||||||||||||||||||||||||||||||||||||||||||||||||||||||||||||||||||||||||||||||||||
Top 10 underlying holdings |
||||||||||||||||||||||||||||||||||||||||||||||||||||||||||||||||||||||||||||||||||||||||||||
|
||||||||||||||||||||||||||||||||||||||||||||||||||||||||||||||||||||||||||||||||||||||||||||
Source: SLPET, Edison Investment Research. Note: *Company forecast for FY20 disclosed in the interim report to March 2020. **N/A where not in end-March 2019 top 10. ***Fund investment. ****Co-investment.
NAV rebounding in Q220
SLPET experienced a recovery in portfolio valuations in Q220, with an 11.9% net asset value (NAV) TR, ahead of the TR posted by UK All-Share Index of 10.2%. This has been a combination of both resilient portfolio earnings and a rebound in public market multiples. As at end-September 2020, the valuation of 100% of SLPET’s fund holdings (excluding new investments) were based on end-June 2020 valuations (no adjustments were made by SLPET’s investment manager to values provided by the respective GPs). Consequently, after accounting for subsequent minor NAV changes attributable primarily to foreign exchange changes (as SLPET has not received underlying valuations for Q320 yet), the company’s 12-month NAV TR to end-September 2020 stands at a 4.0% (vs LPX Europe NAV Index at 1.0%, see Exhibit 3).
|
Exhibit 2: Price, NAV and index TR performance, one- year rebased, to end-September 2020 |
Exhibit 3: Price, NAV and index TR performance to end-September 2020 (%) |
|
|
|
Source: Refinitiv, Edison Investment Research |
|
Exhibit 2: Price, NAV and index TR performance, one- year rebased, to end-September 2020 |
|
|
Source: Refinitiv, Edison Investment Research |
|
Exhibit 3: Price, NAV and index TR performance to end-September 2020 (%) |
|
|
Source: Refinitiv, Edison Investment Research |
As discussed in our previous note, SLPET’s investment manager considers only 9% of its top 100 investments to be highly affected by the COVID-19 crisis. Moreover, these were generally subject to write-downs in March and June already. We understand that these heavily affected businesses include, among others, Big Bus Tours – the UK sightseeing bus tour operator, which is now already fairly written down, a Spanish retailer, Burger King in France and a provider of technology for live music events. None of its top 10 investments has experienced long-term or permanent disruption from COVID-19. SLPET’s top 10 holdings are mostly in healthcare (though not biotech) and consumer staples. Moreover, its second-largest investment is TeamViewer (listed in Germany), whose share price is up c 17% ytd. Nevertheless, SLPET’s investment manager remains cautious with respect to the next six to 12 months as it expects another spike in COVID-19 cases (already materialising across Europe).
Coverage ratio improving to 49%
Capital calls normalising after April, though increasing in September
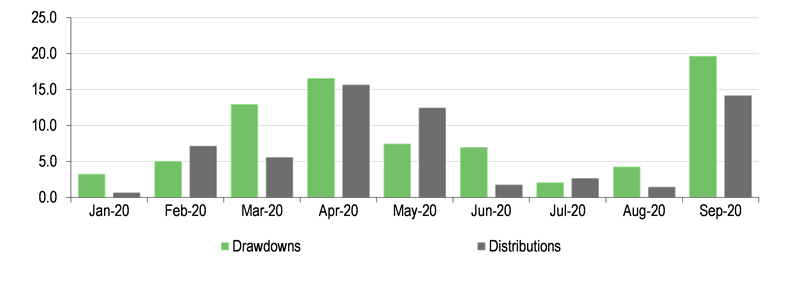
After a spike in capital calls in March and April, when aggregate drawdowns reached £29.6m, the situation normalised between May and August. Although there was an increase in capital calls in September to £19.7m, we believe this may be rather due to GPs seeking additional capital for new investments rather than covering liquidity shortfall at portfolio companies. Based on our conversation with the investment manager, we understand that the September figure includes a £5.4m drawdown related to the Visma co-investment (see below), as well as certain call activity related to primary investments (for instance Hg Saturn). This has brought the year-to-date capital calls (to end-September 2020) to £78.6m (see Exhibit 4), which represents a run-rate that is c 20% above the 2017–19 average.
Since our last review note, SLPET made a new €25m commitment to Nordic Capital X in September 2020, which will be invested across Europe, with a mandate for global investments with a particular focus on healthcare, technology & payments and financial services businesses. The same month, the company also acquired in the secondary market an original commitment of €6.4m to Vitruvian III, which brought a further €2.6m of outstanding commitments. As a result, SLPET’s total commitments stood at £471.4m at end-September 2020 (of which £67.1m are considered by the manager as unlikely to be called).
SLPET retains its core focus on the mid-market buyout segment (fund size between €150m and €3bn), with a selective focus on 1) mid-sized growth companies with low leverage and providing exposure to emerging trends and technology, 2) lower mid-market buyout fund sizes between €150m and €1bn and 3) the large/mega buyout segment (>€3bn), where it selectively invests in core managers that scaled up from the mid-market.
At the same time, it continues to look for attractive co-investment opportunities and intends to maintain a co-investment pace of c 5% of NAV pa. In line with this approach, SLPET made a $7.0m co-investment alongside Hg (lead sponsor) into Visma, a provider of business-critical software to SMEs and the public sector in the Nordics and Benelux regions. This represents SLPET’s second co-investment this year (after £22.6m invested in Action in January 2020), bringing the year-to-date co-investment volume to c 4% of end-2019 NAV.
Distributions continuing year-to-date
SLPET has received meaningful distributions of £61.9m to end-September 2020 (vs a full year 2017–19 average of c £132m), including £15.7m in April and £12.5m in May. Moreover, Q320 distributions within SLPET’s portfolio turned out to be stronger than initially anticipated by management, with SLPET receiving c £18.4m during the quarter. We also note that SLPET should benefit from the IPO of Allegro, a leading Polish e-commerce platform held by the Sixth Cinven Fund, to which SLPET committed c £25m in 2016. Allegro’s share price went up more than 60% vs the IPO price on its first day of listing on 12 October.
The above year-to-date figures for capital calls and distributions exclude the Action deal in January 2020 as a consequence of which the holding became SLPET’s second co-investment (after Mademoiselle Desserts); see our previous update note for details.
|
Exhibit 4: Monthly drawdowns and distributions in 2020 (£m) |
|
|
Source: SLPET, Edison Investment Research |
Increase in the syndicated multi-credit facility
SLPET has further strengthened its liquidity position by the extension of its syndicated multi-credit facility to £200m from £100m announced in September 2020. The facility has an interest rate of Libor/Euribor + 1.625% (Libor/Euribor + 1.50% previously), rising to 2.0% depending on utilisation (1.70% previously) and a non-utilisation fee of 0.7% pa. The company paid an arrangement fee of 0.8% on the additional £100m. No changes to covenants or expiry date (which remains December 2024) were introduced and the loan facility remains undrawn.
One of the main rationales behind the facility upsizing was SLPET’s planned ramp-up of its direct co-investment portfolio and the resulting need for additional dry powder (given the lack of realisations from co-investments in the initial stage).
Solid coverage of outstanding commitments
As a consequence of the rebound in NAV, continued realisations coupled with more normalised capital calls (except for September), as well as the upsizing of the credit line to £200m, SLPET’s overcommitment ratio declined from 42% at end-March 2020 to 33% at end-September 2020 (close to the lower bound of the target range of 30–75%). The corresponding commitment coverage ratio (calculated as cash plus undrawn credit facility to outstanding commitments) stood at a comfortable 49% at end-September 2020. This does not account for a deferred consideration of £15.3m (from an investment sold in 2019), which SLPET expects to receive during the remainder of 2020. After adjusting for this as well as the £67.1m commitments, which are unlikely to be drawn (according to the investment manager), the coverage ratio improves further to 61%.
|
Exhibit 5: Available resources and outstanding commitments |
|
|
Source: SLPET, Edison Investment Research |
|
|
Research: Healthcare
We are expecting a major shift in day-to-day operations for Bioasis going into the second half of FY21 (year ending February) as it transitions to developing a pathway to the clinic for xB3-001 and the advancement of its preclinical programs. Progress on the business front has been encouraging over the first half, with the signing of the licensing agreement with Chiesi Group in June. This will offset some of Bioasis’s costs, but we expect more partnering activity and other fund-raising to bridge that gap.