Last close As at 05/08/2026
—
— 0.00 (0.00%)
Market capitalisation
—
Research: Investment Companies
European Assets Trust (EAT) aims to deliver long-term capital growth through a fundamental approach to investing in small and medium-sized companies in Europe (excluding the UK). The manager, Sam Cosh, also concentrates on the preservation of capital, which is reflected in the focus on quality companies and a disciplined approach to valuation. Over the past 10 years, the trust has delivered an annualised c 14% NAV total return. EAT has a high payout policy and its 6% dividend yield is the highest among peers. Dual listed in the Netherlands and the UK, EAT’s shareholders have approved the migration of the company to the UK, effective in mid-March 2019. This may result in EAT’s inclusion in the FTSE Small Cap and FTSE All-Shares indices, which could increase demand for the shares. Combined with the attractive dividend yield, there is scope for its current wider-than-average discount to NAV to narrow.
Written by
European Assets Trust |
Wider than normal discount has scope to narrow |
Investment trusts |
28 January 2019 |
Share price/discount performance
Three-year performance vs index
Gearing
Analysts
|
|||||||||||||||||||||||||||||||||||||||||||||||||||||||||||||||||||||||||||||||||||||
European Assets Trust (EAT) aims to deliver long-term capital growth through a fundamental approach to investing in small and medium-sized companies in Europe (excluding the UK). The manager, Sam Cosh, also concentrates on the preservation of capital, which is reflected in the focus on quality companies and a disciplined approach to valuation. Over the past 10 years, the trust has delivered an annualised c 14% NAV total return. EAT has a high payout policy and its 6% dividend yield is the highest among peers. Dual listed in the Netherlands and the UK, EAT’s shareholders have approved the migration of the company to the UK, effective in mid-March 2019. This may result in EAT’s inclusion in the FTSE Small Cap and FTSE All-Shares indices, which could increase demand for the shares. Combined with the attractive dividend yield, there is scope for its current wider-than-average discount to NAV to narrow.
12 months ending |
Share price |
NAV |
EMIX Smaller European ex-UK (%) |
FTSE AW Europe ex-UK (%) |
FTSE All- |
31/12/14 |
8.5 |
7.6 |
(1.9) |
(1.4) |
1.2 |
31/12/15 |
20.2 |
20.6 |
17.2 |
5.5 |
1.0 |
31/12/16 |
(2.9) |
7.2 |
23.3 |
21.2 |
16.8 |
31/12/17 |
37.0 |
22.8 |
23.3 |
16.9 |
13.1 |
31/12/18 |
(23.1) |
(15.5) |
(12.7) |
(9.1) |
(9.5) |
Source: Morningstar, Thompson Datastream. Note: All % on a total return basis in GBP.
Investment strategy: Valuation discipline and patient
The manager looks for quality companies with sustainable competitive advantages that are attractively valued over the long term. Cosh is comfortable with being contrarian, investing in stocks that may be out of favour and is patient, awaiting a price entry point that provides sufficient protection for downside risks and good upside reward. Unconstrained by benchmark considerations, the portfolio of c 40 stocks reflects his highest-conviction investment ideas.
Market outlook: Geopolitical factors driving markets
European equities have corrected over the past year, and the EMIX Smaller Europe ex-UK index has fallen c 12% sterling terms since its August 2018 peak. Cyclical headwinds prevailed, such as higher US interest rates and less favourable liquidity conditions as central banks reverse quantitative easing (QE). Valuations a year ago were also looking demanding. However, the magnitude of the derating has been exacerbated by geopolitical risks, which have been more acute than expected, including the US-China trade dispute and Brexit. Such factors seem likely to continue to drive investor sentiment and the direction of European stock markets for the time being.
Valuation: Wider than average discount, high yield
European Assets Trust is a research client of Edison Investment Research Limited
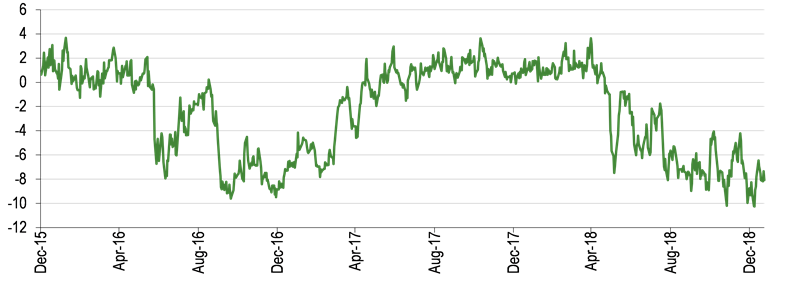
EAT is trading at a discount to cum-income NAV of 7.8%, which is considerably wider than the three-year average of 2.3%, reflecting investors’ increased sensitivity to risk. The 6% dividend yield continues to be significantly higher than the peer group, and has traditionally supported strong demand for the company’s shares.
Exhibit 1: Trust at a glance
Investment objective and fund background |
Recent developments |
||||||||||||||||||||||||||||||||||||||||||||||||||||||||||||||||||||||
European Assets Trust is an investment company incorporated in the Netherlands and listed on the LSE and Euronext Amsterdam. Following shareholders’ approval, the trust will legally migrate to the UK from mid-March 2019. It targets capital growth through investment in quoted small- and medium-sized companies in Europe (ex-UK), taking the EMIX Smaller Europe ex-UK index as a benchmark. It has adopted a high distribution policy; dividends have been paid from a combination of income and capital. |
■ 10 January 2019: EGM – shareholders approved the migration of the company’s legal seat and structure from the Netherlands to the UK, effective March 2019. ■ 8 January 2019: declaration of 2019 total dividend of €0.0684 per share. ■ 27 November 2018: board proposal to migrate EAT from the Netherlands to the United Kingdom by means of a cross border merger. |
||||||||||||||||||||||||||||||||||||||||||||||||||||||||||||||||||||||
Forthcoming |
Capital structure |
Fund details |
|||||||||||||||||||||||||||||||||||||||||||||||||||||||||||||||||||||
AGM |
May 2019 |
Ongoing charges |
1.06% |
Group |
BMO Global Asset Mgt (formerly F&C) |
||||||||||||||||||||||||||||||||||||||||||||||||||||||||||||||||||
Final results |
March 2019 |
Net gearing |
0.7% as at end-Dec 2018 |
Manager |
Sam Cosh |
||||||||||||||||||||||||||||||||||||||||||||||||||||||||||||||||||
Year end |
31 December |
Annual mgmt fee |
0.8% of gross assets reducing to 0.65% above €500m |
Address |
Exchange House, Primrose Street, London, EC2A 2NY |
||||||||||||||||||||||||||||||||||||||||||||||||||||||||||||||||||
Dividend paid |
Quarterly |
Performance fee |
None |
||||||||||||||||||||||||||||||||||||||||||||||||||||||||||||||||||||
Launch date |
1972 |
Trust life |
Indefinite |
Phone |
+44 (0)800 136420 |
||||||||||||||||||||||||||||||||||||||||||||||||||||||||||||||||||
Continuation vote |
None |
Loan facilities |
€45m with Kas Bank |
Website |
|||||||||||||||||||||||||||||||||||||||||||||||||||||||||||||||||||
Dividend policy and history |
Share buyback policy and history |
||||||||||||||||||||||||||||||||||||||||||||||||||||||||||||||||||||||
The board targets a distribution of 6% of euro-denominated NAV as at the end of the preceding year, normally payable in January, April, July and October. |
EAT is authorised to both repurchase and allot its ordinary shares. The chart of buybacks and issuance excludes shares issued as scrip dividends. |
||||||||||||||||||||||||||||||||||||||||||||||||||||||||||||||||||||||
|
|
||||||||||||||||||||||||||||||||||||||||||||||||||||||||||||||||||||||
Portfolio exposure by sector (as at 31 December 2018) |
Portfolio exposure by geography (as at 31 December 2018) |
||||||||||||||||||||||||||||||||||||||||||||||||||||||||||||||||||||||
|
|
||||||||||||||||||||||||||||||||||||||||||||||||||||||||||||||||||||||
Top 10 holdings (as at 31 December 2018) |
|||||||||||||||||||||||||||||||||||||||||||||||||||||||||||||||||||||||
|
|||||||||||||||||||||||||||||||||||||||||||||||||||||||||||||||||||||||
Source: EAT, Edison Investment Research, Bloomberg, Morningstar. Note: *N/A where not in December 2017 top 10.
Market outlook: More volatile and politically driven
At the start of 2018, Europe’s economic recovery was still relatively nascent. Led by exporters in 2017, activity extended to domestic sectors and consumer confidence continued to improve. At that time, there were well-known headwinds, including the prospect for higher interest rates, the withdrawal of liquidity as central banks reverse QE, and lofty valuations for European smaller companies, following two years of strong performance (Exhibit 2, LHS). Nevertheless, investors were optimistic that an immature recovery cycle and another solid year of earnings growth could be supportive for European equities. However, the economic recovery appears to have stalled and European stock markets have corrected with the EMIX Smaller Europe ex-UK index down c 12% in sterling terms since its August 2018 peak. Political factors, including a US-China trade dispute and Brexit, have weighed on market sentiment and global growth. Although European equities have fallen, so have expectations for earnings growth and investors’ appetite for risk. These political factors seem likely to continue to drive sentiment and the direction of European stock markets over the foreseeable future.
|
Exhibit 2: Market performance and valuation |
|
European and world index total returns over five years (£) |
Valuation metrics for European small-cap, large-cap and world equities* |
|
|
|
Source: Thomson Datastream, Edison Investment Research, MSCI. Note: *Valuation data as at 24 January 2019. |
|
Fund profile: Fundamental and long term
EAT was launched as a Dutch company in 1972. It aims to achieve capital growth through investing in listed small and medium-sized companies in Europe (excluding the UK), following a fundamental approach in selecting around 40 high-conviction stocks and employing a long-term investment horizon. The board adopts a high distribution policy and EAT’s current dividend yield of 6.0% is significantly above its peers (Exhibit 8).
The trust is dual listed on the London and Amsterdam stock exchanges. At a recent EGM held on 10 January 2019, shareholders approved the board’s proposal to migrate EAT’s legal seat and structure from the Netherlands to the UK (the migration). On completion of the migration, the entire portfolio of investments of the company will transfer to the UK entity. There will be no change to the manager, investment policy or dividend policy. The migration is expected to become effective on 16 March 2019, and the company will be admitted to the premium segment of the main market of the London Stock Exchange on 18 March 2019. Reasons for the migration include:
■
an overwhelming majority of the trust’s shareholders are UK residents and the investment management and market activities are also performed from the UK;
■
a simplified corporate structure;
■
a single jurisdiction for current and future regulation;
■
a potential reduction in the ongoing charges rate; and
■
a premium listing on the London Stock Exchange and potential inclusion in the FTSE Small Cap and FTSE All-Share indices, subject to satisfying liquidity requirements. The manager believes inclusion in these indices could increase demand for the company’s shares.
The fund manager: Sam Cosh
The manager’s view: Quality and valuation are key
Cosh started to turn more cautious on European equities in early 2018, as he believed the extraordinarily favourable liquidity conditions of the past several years were coming to an end, and valuations for European small-cap equities looked stretched. As a result, he reduced EAT’s cyclical exposure during 2018. The manager notes the slowdown in Europe’s economic growth has been greater than anticipated and may have been much exacerbated by political developments, such as the US-China trade dispute and Brexit. However, Cosh does not focus on macroeconomic predictions and concentrates on finding quality companies with good valuation support that should do well through economic cycles. He believes European small-cap equities could continue to be volatile for the foreseeable future, and the need to exercise valuation discipline is particularly important. Cosh maintains a ‘patient fishermen’ list of companies that are fundamentally attractive, but unattractively valued. These names are constantly monitored for opportune entry points. However, despite the correction in European small-cap equities, the manager finds few high quality businesses that have fallen enough to offer a sufficient balance of upside potential and downside protection, relative to the holdings in the portfolio.
Asset allocation
Investment process: Rigorous and disciplined
The manager follows a fundamental approach to investing in small to medium-sized companies listed in Europe (excluding the UK), defined as those with a market capitalisation below that of the largest company in the EMIX Smaller European Companies (ex UK) index. The investment approach is benchmark agnostic and Cosh is comfortable being contrarian. He focuses on quality companies with sustainable competitive advantages that have attractive and understandable business models. Company managements are assessed, looking for a track record of good capital allocation and interests that are aligned with those of minority investors. Standardised and proprietary research is produced on investee companies, involving rigorous and detailed analysis, to help ensure objectivity in investment decisions. Capital preservation is as important an objective as capital growth, and therefore analysis of cash flow and determining the intrinsic worth of a business are key parts of the investment process.
The manager has four broad investment themes (typical portfolio weights shown in brackets):
■
Durable franchises (40–50%). Businesses with robust models, disciplined management, sustainable good returns and scope for at least modest growth.
■
Wide moat growth (25–30%). Companies with a sustainable competitive advantage, able to defend their market position and support higher capital growth.
■
Transformation/recovery (15–20%). Firms that can unlock value; for example, as a result new management or an improvement in capital allocation.
■
Deep value (10–15%). Investments in companies that are out of favour but have surmountable obstacles to business performance, and very attractive risk-reward ratios.
The investment process involves a strong sell discipline, and qualitative sell triggers are identified for each stock prior to purchase. These are in addition to valuation and relative performance-related triggers that would automatically flag a review of an investment.
Current portfolio positioning
Exhibit 3 shows the portfolio’s country and sector exposures at end-December 2018 compared to the previous year. Over the past year, most of the activity occurred in H118. The consumer goods and industrials exposures have fallen notably by 7.0pp and 4.0pp respectively, reflecting the manager’s decision in early 2018 to reduce EAT’s exposure to cyclical and more expensively valued stocks (see EAT July 2018). Sales included Spain-listed Ebro Foods, Finnish sports brand company Amer Sports and Sweden-listed building materials supplier Nordic Waterproofing.
The largest exposure increases are to the consumer services (+6.5pp) and healthcare (+3.8pp) sectors. In H218 EAT initiated a new position in Netherlands-listed online food delivery company Takeaway.com. Established in 2000, it has a dominant position in its Dutch home market and has been expanding its platform in Europe. The manager believes the company has particularly attractive growth prospects in Germany and Poland. In December 2018, Takeaway.com acquired its competitor in Germany, Delivery Hero, consolidating its leadership in this market, a development that was well received by investors (reflected in a 26% appreciation in its stock price following the announcement of the transaction). When EAT initiated the position, Cosh believed the valuation largely reflected Takeaway.com’s Dutch operations, suggesting very low values were being ascribed to the company’s businesses in Germany and Poland.
In the healthcare sector, EAT purchased two new stocks, DiaSorin (in Italy) and Tecan (in Switzerland). Both companies are involved in diagnostics and are well-placed beneficiaries of increasing automation in the healthcare industry, which the manager believes can support long-term growth prospects, while being relatively less sensitive to economic cycles.
Portfolio activity in H218 was modest. The manager sold Spanish stock market operator, Bolsas y Mercados Españoles (BME) as he believes increasing pressure from the regulator to increase competition may erode the company’s ‘moat’ and future margins. Furthermore, BME was trading at a relatively expensive valuation and was vulnerable to derating.
Exhibit 3: Portfolio geographic and industrial exposure* (% unless stated)
Portfolio end-Dec 2018 |
Portfolio end- Dec 2017 |
Change (pp) |
Portfolio end- Dec 2018 |
Portfolio end- Dec 2017 |
Change (pp) |
|||
Germany |
19.4 |
21.0 |
(1.5) |
Industrials |
26.7 |
30.7 |
(4.0) |
|
Switzerland |
13.5 |
8.5 |
5.0 |
Consumer goods |
17.9 |
24.9 |
(7.0) |
|
Sweden |
12.5 |
11.1 |
1.4 |
Consumer services |
17.1 |
10.6 |
6.5 |
|
Netherlands |
10.4 |
5.4 |
5.0 |
Financials |
15.3 |
16.4 |
(1.1) |
|
Norway |
9.8 |
8.6 |
1.2 |
Healthcare |
9.6 |
5.8 |
3.8 |
|
Italy |
9.4 |
6.4 |
3.0 |
Basic materials |
7.8 |
6.2 |
1.6 |
|
Spain |
8.5 |
13.3 |
(4.8) |
Technology |
4.0 |
5.4 |
(1.4) |
|
Ireland |
6.8 |
11.4 |
(4.6) |
Oil & gas |
1.6 |
0.0 |
1.6 |
|
Denmark |
3.7 |
5.0 |
(1.3) |
|||||
France |
3.3 |
4.2 |
(0.9) |
|||||
Austria |
2.6 |
2.0 |
0.6 |
|||||
Finland |
0.0 |
3.1 |
(3.1) |
|||||
Total |
100.0 |
100.0 |
Total |
100.0 |
100.0 |
Source: European Assets Trust, Edison Investment Research. Note: *All figures are subject to rounding.
Other activities in H218 involved marginal trims and additions to existing positions. Strong performance from Norway-listed Tomra presented multiple opportunities for partial profit taking. The company has the world’s largest market share in reverse vending machines and a growing sorting business (used by the food, recycling and mining industries). In the manager’s view, Tomra is particularly well placed to benefit from a rising global trend for recycling, with its leading technology and scale advantages. These factors should support long-term growth, as well as reduce the company’s sensitivity to economic cycles.
The manager believes the portfolio is in good shape with characteristics that reflect the focus on quality and valuation. EAT has a similar forward P/E multiple valuation to the benchmark; however, it has a higher ROE of 15% (vs 12%) and lower net debt/EBITDA of 0.8x (vs 2.7x).
Performance: Strong long-term returns
The manager is focused on long-term performance and Exhibits 4 (RHS) and 5 show that EAT’s NAV total return over 10 years has significantly outperformed the EMIX Smaller Europe ex-UK, FTSE AW Europe ex-UK and FTSE All-Share indices. However, over the shorter periods EAT has underperformed. The most pronounced period of underperformance is over three years as the trust was poorly positioned for the outcome of the EU referendum in June 2016 with a significant position in Irish companies heavily exposed to the UK. Over one year, a large part of the underperformance occurred in April 2018, when the index performance was led by a narrow set of companies in the utilities, telecoms and oil & gas sectors. EAT was underweight these sectors, which are typically dependent upon regulation and commodity prices, characteristics the manager finds unattractive.
|
Exhibit 4: Investment trust performance to 31 December 2018 |
||||||||
Price, NAV and benchmark total return performance, one-year rebased |
Price, NAV and benchmark total return performance (%) |
|||||||
|
|
|||||||
|
Source: Thomson Datastream, Edison Investment Research. Note: Three-, five- and 10-year performance figures annualised. |
||||||||
|
Exhibit 5: Share price and NAV total return performance, relative to indices (%) |
||||||||
|
One month |
Three months |
Six months |
One year |
Three years |
Five years |
10 years |
|
Price relative to EMIX Smaller Europe ex-UK |
(1.5) |
(3.7) |
(8.3) |
(11.9) |
(22.9) |
(12.6) |
18.4 |
|
NAV relative to EMIX Smaller Europe ex-UK |
(0.7) |
(2.2) |
(2.1) |
(3.5) |
(16.4) |
(5.7) |
17.5 |
|
Price relative to FTSE AW Europe ex-UK |
(2.1) |
(7.4) |
(13.6) |
(15.4) |
(20.5) |
(0.4) |
71.9 |
|
NAV relative to FTSE AW Europe ex-UK |
(1.3) |
(6.0) |
(7.8) |
(7.3) |
(13.8) |
7.4 |
70.6 |
|
Price relative to FTSE All-Share |
(3.0) |
(8.0) |
(10.7) |
(15.0) |
(14.4) |
9.3 |
55.1 |
|
NAV relative to FTSE All-Share |
(2.2) |
(6.6) |
(4.6) |
(6.9) |
(7.2) |
17.8 |
54.0 |
|
|
Source: Thomson Datastream, Edison Investment Research. Note: Data to end-December 2018. Geometric calculation. |
||||||||
|
Exhibit 6: NAV total return performance relative to benchmark over five years |
||||||||
|
||||||||
|
Source: Thomson Datastream, Edison Investment Research |
||||||||
Capital structure and fees
EAT has one class of share and, following a 10-for-one stock split in May 2018, there are 359.8m ordinary shares in issue and none held in treasury. On completion of the migration, shareholders will be entitled to receive one ordinary share in the UK-registered company for each share held in the Netherlands-registered company. Demand for the trust’s shares has historically been positive, and the board has been able to issue new shares through block listing arrangements to meet investor demand. During FY18, EAT allotted 7.7m shares, raising c €16.2m (FY17 issued the equivalent of 1.6m shares, raising €20.5m). This leaves a balance of 5.2m shares available for issuance.
The trust has a €45m loan facility with Kas Bank and as at end-December 2018, EAT had net gearing of 0.7%. A tiered management fee was introduced in November 2017, payable annually to BMO Global Asset Management. A fee of 0.80% is payable on the value of funds below €500m, reducing to 0.65% on funds above €500m (previously a flat fee of 0.80%).
Dividend policy and record
The EAT board has a distribution policy to pay shareholders a dividend of 6% of the trust’s preceding year-end NAV, funded from income and other reserves. It recently announced 2019 total dividends of €0.0684 per share (2018: €0.088) reflecting a 16.3% decline in the trust’s euro-denominated NAV total return (with dividends reinvested) for the year to end-December 2018. The annual dividend is paid in four instalments, normally in January, April, July and October. In 2019, the instalment normally paid in April will be paid in March to ensure the company still has its Dutch taxation status until the migration in March. Following the migration, dividends will be paid by the UK entity and will no longer be subject to Dutch withholding tax. Dividends are declared in euros and paid in either euros or sterling, with the exchange rate determined as close as practicable to the date of payment. Following the migration, dividends will initially continue to be declared in euros for at least the first financial year.
Peer group comparison
EAT is a member of the AIC European Smaller Companies peer group, which consists of just four trusts. It has a significantly higher dividend yield than its peers (at 6%). It also ranks first in terms of the discount to cum-fair NAV. EAT’s ongoing charges are close to the peer group average, ranking second. The trust’s NAV total returns rank second over one and 10 years, and fourth over three and five years.
Exhibit 8: AIC European Smaller Companies peer group as at 23 January 2019*
% unless stated |
Market cap £m |
NAV TR |
NAV TR |
NAV TR |
NAV TR |
Discount (cum fair) |
Ongoing charge |
Perf. fee |
Net gearing |
Dividend yield (%) |
European Assets Trust |
349.0 |
(13.8) |
24.4 |
47.5 |
303.2 |
(7.4) |
1.1 |
No |
101 |
6.0 |
JPMorgan European Smaller Cos |
545.4 |
(14.3) |
40.3 |
60.0 |
257.0 |
(12.6) |
1.0 |
No |
103 |
2.0 |
Montanaro European Smaller |
142.2 |
0.2 |
65.5 |
70.7 |
318.8 |
(8.8) |
1.2 |
No |
94 |
1.0 |
TR European Growth |
419.4 |
(23.1) |
48.3 |
60.9 |
295.5 |
(9.7) |
0.7 |
Yes |
113 |
2.3 |
Simple average in sector |
364.0 |
(12.7) |
44.7 |
59.8 |
293.6 |
(9.6) |
1.0 |
103 |
2.8 |
|
EAT rank in sector |
3 |
2 |
4 |
4 |
2 |
1 |
2 |
3 |
1 |
Source: Morningstar, Edison Investment Research. Note: *Performance data to 22 January 2019. TR = total return. Net gearing is total assets less cash and equivalents as a percentage of net assets.
The board
EAT is incorporated in the Netherlands and has five independent supervisory board members, all of whom will remain on the board after the migration. It is chaired by Jack Perry (appointed in 2014). Professor Robert van de Meer is deputy chairman (2007) and Julia Bond is the senior independent director (2014). The other directors are Laurence Jacquot (2011) and Martin Breuer (2016).
|
|
Research: Investment Companies
European Assets Trust (EAT) aims to deliver long-term capital growth through a fundamental approach to investing in small and medium-sized companies in Europe (excluding the UK). The manager, Sam Cosh, also concentrates on the preservation of capital, which is reflected in the focus on quality companies and a disciplined approach to valuation. Over the past 10 years, the trust has delivered an annualised c 14% NAV total return. EAT has a high payout policy and its 6% dividend yield is the highest among peers. Dual listed in the Netherlands and the UK, EAT’s shareholders have approved the migration of the company to the UK, effective in mid-March 2019. This may result in EAT’s inclusion in the FTSE Small Cap and FTSE All-Shares indices, which could increase demand for the shares. Combined with the attractive dividend yield, there is scope for its current wider-than-average discount to NAV to narrow.