The overall valuation of Is Private Equity’s (ISGSY) private equity investments remained resilient in 2017, with gross asset exposure to these investments increasing (and liquid assets reduced) as ISGSY invested further, for larger stakes in existing assets. With economic recovery taking hold, investee companies saw total revenue growth of c 35% in 2017, and the increased investment may prove to be well timed, especially if inflation and interest rates decline as the Central Bank expects. A pick-up in M&A activity may also provide additional opportunity for capital recycling from mature assets into new opportunities. The significant 52% discount to NAV provides scope for a re-rating.
Is Private Equity |
Valuation yet to reflect improving conditions |
Full year results |
Investment companies |
16 March 2018 |
Share price performance
Business description
Next events
Analysts
Is Private Equity is a research client of Edison Investment Research Limited |
||||||||||||||||||||||||||||||||||||||||||||||||||||||||||||||
The overall valuation of Is Private Equity’s (ISGSY) private equity investments remained resilient in 2017, with gross asset exposure to these investments increasing (and liquid assets reduced) as ISGSY invested further, for larger stakes in existing assets. With economic recovery taking hold, investee companies saw total revenue growth of c 35% in 2017, and the increased investment may prove to be well timed, especially if inflation and interest rates decline as the Central Bank expects. A pick-up in M&A activity may also provide additional opportunity for capital recycling from mature assets into new opportunities. The significant 52% discount to NAV provides scope for a re-rating.
To 31 December 2017* |
Price total return |
NAV total return** |
LPX Direct Index TR (%) |
BIST 100 Index TR (%) |
One year |
16.0 |
0.3 |
22.6 |
52.1 |
Three years |
(17.0) |
(0.1) |
117.1 |
45.7 |
Five years |
5.9 |
48.3 |
259.5 |
64.9 |
Ten years |
239.6 |
191.2 |
283.9 |
162.5 |
Note: *Last published NAV. ISGSY and BIST 100 Index TR from Bloomberg. Note: LPX Direct is a global index of listed private equity companies that pursue a direct private equity investment strategy. All data are calculated in TRY. **ISGSY NAV is calculated at fair value.
Increased exposure to PE assets
Despite the challenging environment, NAV increased marginally to TRY256.9m (2016: TRY256.2m) or TRY3.44 per share. The total return on the liquid asset portfolio remained strong, generating TRY13.3m (2016: TRY14.8m), sufficient to cover the administrative expenses, little changed at TRY10.4m. The private equity (PE) investment portfolio showed a small fair value reduction of TRY2.0m (2016: TRY3.5m reduction) or c 1.1% of the opening value. Including TRY45.25m committed to existing investments, the PE portfolio increased to TRY182.6m or 71% of total assets compared with 54% in 2016. This included increased ownership of Toksoz Spor, Ortopro and Nevotek.
Improving environment
The Turkish economy has recovered well through 2017. GDP growth was c 7.0% in 2017 and most forecasters expect strong growth in 2018, with the IMF now forecasting 4.3%. If currently high inflation falls as the Central Bank expects, there should be room for interest rates to moderate. Listed equities have performed well (the IBIS 100 Index is up c 50% since the beginning of 2017) and M&A activity has also picked up. A continuation of the favourable trend would represent a positive backdrop for ISGSY to return to more active capital recycling, perhaps divesting of some of its mature investments to reinvest in new opportunities. Any gains realised on historical investment values would provide an offset to likely lower returns on the smaller liquid portfolio and raise the possibility of a return to dividend distributions.
Valuation: Slightly narrower discount
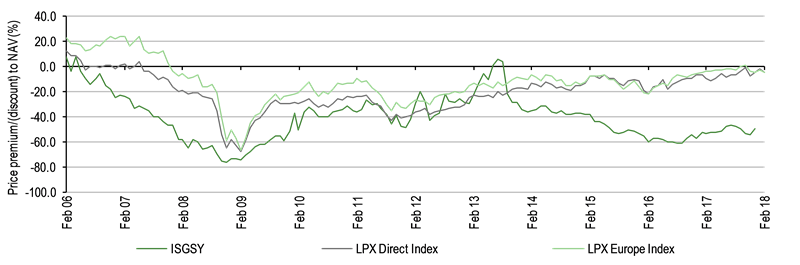
The discount to NAV has reduced from a peak of c 60% at the time of the mid-2016 attempted coup, to c 52% today, but has not kept pace with the improving environment or the valuation of listed equities.
|
Exhibit 1: Is Private Equity at a glance |
|||||||||||||||||||||||||||||||||||||||||||||||||||||||||||||||||||||||||||||||||||||||||||||||||||||||
|
|||||||||||||||||||||||||||||||||||||||||||||||||||||||||||||||||||||||||||||||||||||||||||||||||||||||
|
Source: ISGSY, Bloomberg, Edison Investment Research. Note: Dividend history has been adjusted to account for bonus issues, the last of which increased the share count from 66.6m to 74.7m and was announced at the AGM on 26 March 2014. |
|||||||||||||||||||||||||||||||||||||||||||||||||||||||||||||||||||||||||||||||||||||||||||||||||||||||
Company description
Is Private Equity (İş Girişim Sermayesi, or ISGSY) is a private equity investor, focusing on the lower/mid-market sized Turkish companies. It was established in 2000 by one of the largest Turkish banks, Turkiye İş Bankasi (or Işbank) as a way to both invest in, and support the development of, Turkish SMEs with high growth potential. ISGSY listed on the Borsa Istanbul in 2004, when shares representing 37.7% of the company were offered in an IPO, and İşbank affiliates still control 57% of the shares, representing a valuable and supportive core shareholder base.
ISGSY focuses on lower/mid-private equity transactions where it faces less competition for deals from the large international private equity firms, which prefer larger transactions. Its first two investments came in 2002, following an initial period of research and fund-raising, and it has now made a total of 17 investments, with an investment volume of US$148.5m since inception. There have been 11 exits to date, realising US$166.9m from total investment in those assets of US$72.5m. The company calculates an IRR from its exits of 26.4% on a dollar basis. At the end of 2017, the fair value of investment in the current six private company holdings was TRY182.6m, with other investments, mainly private sector bonds and fund holdings, of TRY46.4m, and cash of TRY29.4m. The company itself has no debt, although investee companies do have debt.
The investment case is based on SME growth potential
Small and medium-sized enterprises (SMEs) are the backbone of the Turkish economy, accounting for more than 90% of all enterprises by number, more than 50% of GDP and providing more than three-quarters of all jobs. In a relatively fast developing economy, access to capital is an important issue for these companies and private equity investors, like ISGSY, make an important contribution by providing permanent capital commitments and strategic support. ISGSY aims to help its investee companies expand into new markets and compete, not only in Turkey, but also in international markets where appropriate, and to grow organically or through acquisition. Private equity investment generally has a long-term time horizon as it typically takes from three to seven years for investee companies to implement their strategies, but long-term industry returns, compared with listed equity investment, have generally been attractive.
An investment in ISGSY offers:
■
access to the dynamic middle market in Turkey not available on the Istanbul Stock Exchange, which has predominantly larger companies, an experienced management team with more than 15 years’ experience in Turkish private equity and a track record of success;
■
considerable balance sheet resources and no debt, reducing risk and providing flexibility at a time of uncertainty that may present opportunities; and
■
a considerable discount of c 52% to the last published NAV of TRY3.44, of which 29% represents cash and short-term investments, equivalent to TRY1 per share. At a price of TRY1.62 per share, the market capitalisation excluding cash and short-term investments is equivalent to 25% of the residual value of the PE investments.
The economy is recovering strongly
The Turkish business environment has been affected by geopolitical tensions over the past three years, including war in neighbouring Syria and Iraq and the failed coup attempt in July 2016. In headline terms, the economy has remained resilient; while GDP growth slowed to 2.9% in 2016 from 4.4% in 2015, it remained above the OECD average of closer to 2%, and rebounded strongly to c 7% in 2017, and most forecasters look for continued strong growth of c 4.0% or more in 2018. The IMF recently increased its forecast from 3.9% in January 2018 to 4.3%.
Growth in the past year was supported by government incentives to stimulate the economy (tax holidays, a business credit guarantee fund), as well as improved exports, responding to the weaker lira and, more recently, falling unemployment and an improvement in domestic consumption. Less helpfully, inflation hit a 14-year high of 13.0% in November 2017 and remains in double digit territory at 10.3% in February 2018. The authorities expect it to remain high through the year, but fall to 7.9% by year-end. As a result, monetary conditions remain tight; the key official interest rate increased to 12.75% in December 2017 and any reduction is likely to require a further moderation in inflation. More importantly than official rates, private banks are charging rates of interest of up to 20%. High rates of cost inflation and high borrowing costs mean that the business environment is more challenging than the headline GDP growth figures may suggest, especially for domestically focused SMEs. However, if inflation moderates as expected there should be room for interest rates to decline, providing welcome relief to corporate borrowers.
Having lost a third of its value versus the US$ in the past three years, the Turkish lira has been showing signs of stability more recently. Losses in the past year are modest and it is stable in 2018 ytd.
|
Exhibit 2: Turkish lira versus US dollar |
|
|
Source: Bloomberg |
Quoted shares have seen a strong performance since the coup attempt and have increased by c 50% in Turkish lira terms since the beginning of 2017, exceeding the c 38% gain in terms of US$.
|
Exhibit 3: Turkish BIST 100 equity index in TRY and US$ |
|
|
Source: Bloomberg |
Investment strategy, process and resources
ISGSY’s strategy is to invest in Turkish SMEs with strong growth prospects and good historical performance, with the potential to become a significant player in their sector, and where possible with some exposure to foreign markets. ISGSY looks for investments with sustainable growth and operational improvement opportunities. When assessing growth prospects, the team targets companies that operate in growth markets and can capture additional market share. All of its investments are equity stakes, although convertible debt or a structured mix of debt and equity are considered. Investments mainly take the form of growth capital and buyouts, but may be project-based restructuring transactions. Other criteria include:
■
average investment size of TRY10-40m;
■
operational profitability and realistic growth forecasts;
■
a strong and committed management team, which can make decisions quickly;
■
a business plan with genuinely differentiated products or services;
■
sustainable competitiveness and market share; and
■
clear exit opportunities.
ISGSY is sector agnostic, but focuses on niche sectors with growth potential and structural drivers based on long-term trends, such as data centres and online travel agencies. It tends to take majority stakes in order to establish control, but will co-invest if the size of the required investment is above its preferred range. ISGSY will also consider taking a significant minority stake where a secure exit strategy exists and where it can be certain of having sufficient influence to ensure that any decisions taken in running the investee company are in line with its own plans and strategy.
ISGSY has a team of 10 investment professionals with broad experience in consultancy, strategic planning, corporate finance, operational management, risk management and industry. The team screens c 100 opportunities a year and aims to achieve an IRR of 15-20% in US$ terms over a three- to seven-year investment horizon. If a company passes the initial screening process, a more detailed assessment is carried out, which includes research into the wider sector, competitor analysis and benchmarking, calls with management and to referees, as well as financial and commercial analysis. ISGSY seeks to introduce competitiveness, superior management and reporting processes, and to foster leadership in portfolio companies to bring depth to the management team.
The investment team works up its own deal entry forms and investment proposals on each target company before approving (or not) each proposal internally. Successful proposals are then presented to the investment committee, which may make a recommendation to the board of directors that is responsible for the final decision. After a deal has closed, ISGSY proposes representatives on the investee company’s board and monitors the company until a decision to exit is made and executed. ISGSY, through its board member representation, does not become directly involved in the day-to-day management of its investees, but does seek to determine strategy, will replace senior management if necessary and help create the most suitable capital structure for the company.
The company has built a track record of successful exits
As noted above, ISGSY has made 17 investments to date and has exited 11 of these, the last exit being that from Aras Kargo in 2013. We show details of the exited investments in Exhibit 4, with proceeds amounting to US$166.9m from US$72.5m of invested capital, a money multiple of 2.3x. The current investments, discussed in the next section, have a carrying value of TRY182.6m, equivalent to c US$48m.
Exhibit 4: Summary of exited investments
Investment date |
Company |
Sector |
Investment ($m)* |
Exit date |
Period owned |
Exit value ($m) |
IRR |
ROI |
2002 |
ITD |
Telecoms & IT |
1.9 |
2010 |
8 |
4.2 |
11.8% |
128.0% |
Probil |
Telecoms & IT |
3.2 |
2011 |
9 |
4.2 |
3.1% |
31.0% |
|
2003 |
Cinemars |
Consumer |
11.5 |
2006 |
3 |
19.4 |
30.3% |
69.0% |
2004 |
Step |
Consumer |
3.5 |
2008 |
4 |
6.8 |
19.0% |
93.0% |
2005 |
Tuyap |
Consumer |
7.0 |
2007 |
2 |
10.8 |
45.8% |
54.0% |
2006 |
Beyaz |
Services |
4.0 |
2008 |
2 |
8.8 |
58.7% |
119.0% |
2007 |
ODE |
Services |
5.0 |
2012 |
5 |
10.5 |
17.0% |
110.0% |
Turkmed |
Healthcare |
2.5 |
2013 |
6 |
0.2 |
N/A |
-90.0% |
|
2008 |
Dr Frik |
Healthcare |
13.4 |
2011 |
3 |
30.5 |
34.6% |
128.0% |
2010 |
Havas |
Services |
10.8 |
2012 |
2 |
19.7 |
26.7% |
82.0% |
2011 |
Aras Kargo |
Services |
9.8 |
2013 |
2 |
51.9 |
165.0% |
428.0% |
Total/average |
72.6 |
4 |
166.9 |
26.46% |
130% |
Source: ISGSY. Note:* Investments in TRY converted to US dollars at historical exchange rates.
The six current private equity investments are detailed in Exhibit 6. As we show on page 2, the portfolio is well spread by investee company, and overall has a significant (65%) exposure to consumer services (restaurants, sports goods, tourism).
During 2017 ISGSY made follow-on investments in Toksoz Spor, Ortopro and Nevotek amounting to TRY45.25m/US$12.0m, increasing its ownership in each of the companies (Exhibit 5).
Exhibit 5: Follow-on investment in 2017
Investee |
ISGSY ownership/voting power |
Change in ownership 2017 |
2017 Capital committed |
||
2017 |
2016 |
TRYm |
US$m* |
||
Toksoz Spor |
88.27% |
55.00% |
33.3% |
27.500 |
7.7 |
Ortopro |
90.63% |
83.64% |
7.0% |
12.750 |
2.9 |
Numnum |
83.57% |
83.57% |
0.0% |
||
Radore |
25.50% |
25.50% |
0.0% |
||
Nevotek |
89.72% |
81.24% |
8.5% |
5.000 |
1.5 |
Tatil Budur |
20.00% |
20.00% |
0.0% |
||
Total |
45.250 |
12.0 |
|||
Source: ISGSY. Note: *Converted at exchange rate at time of investment.
The proceeds of the capital increase at Nevotek are to be used to support its new cloud-based product in the US, aimed at the hospitality sector (Exhibit 5). Ortopro will mainly direct the cash proceeds of its capital increase at a reduction in borrowings. This includes an additional TRY4.75m, which was committed in 2017 and paid in February 2018.
Exhibit 6: ISGSY private equity investments at 31 December 2017
Date of investment |
Fair value |
Ownership (%) |
Description |
|
Nevotek |
30/9/2003 |
23.8 |
89.72 |
Nevotek, headquartered in Turkey, is a global player that specialises in the interconnection of internet protocol (IP) telephony, IP TV and connected real estate technology for use in hospitality, healthcare, multi-tenanted real estate and public space management. Its platform allows the rapid development of unified applications across voice, data, video and building management. Nevotek has a large, international customer base. In H217 it established a US-based company (Koridor Inc), which will launch a new cloud-based self-service platform for the hospitality industry that among other services will allow guests to select their own rooms from the hotel floor plan. |
Ortopro |
10/12/2007 |
22.8 |
90.63 |
Ortopro is a Turkish orthopaedic implant company. It runs a modern production facility with 2,750m2 of closed space in Izmir. In addition to sales of its own brands in Turkey and international markets, Ortopro serves as a contract manufacturer to global orthopaedic companies. In 2017 a new sales director was recruited with the aim of increasing export sales further by reaching new customers in Europe and the MENA region. 2017 revenues grew by 29% versus 2016. |
Toksoz Spor |
13/11/2012 |
51.8 |
88.27 |
Toksoz Spor is a leading sporting goods wholesaler and retailer in Turkey. In its wholesale activities it is the Turkey-region distributor of global sports brands and in 2017 added Puma to its list, which also includes Arena, Head, Mammut and O’Neill. The company also sells products under its own brand, Sportive. Wholesale customers include department stores, other sports retailer chains, sports clubs, universities and sports federations. There are plans to further expand the retail activities over the medium term, and in 2017 four new stores were opened in shopping malls, while five unprofitable locations were exited. ISGSY says that online sales grew 66% in 2017, and Toksoz Spor management expects further growth. Total revenues grew by 12% in 2017. |
Numnum |
05/12/2012 |
37.8 |
83.57 |
Istanbul Food and Beverage Group (IFBG) is a leading Turkish restaurant service and gastronomy company operating under five major brands: Mikla, Numnum, Trattoria Enzo, Terra Kitchen and Kronotrop. Mikla is an upscale fine dining restaurant, Numnum is a full-service casual restaurant chain, Trattoria Enzo serves “home-made” Italian food, Terra Kitchen is a casual self-service concept has the motto “eat well, feel good” and Kronotrop is a third wave coffee roastery and shop. The group established a new management team in 2017, including a new CEO, and revisited its growth strategy. Management says that trading conditions in the leisure sector were more positive in 2017 compared with 2016, with revenues growing by 11%. |
Radore |
01/12/2014 |
17.9 |
25.50 |
Radore provides data centre services in Turkey, including co-location, dedicated cloud, web hosting and domain sales. Established in 2004, it offers data centre solutions to over 3,000 clients, including both individuals and corporations, and with capacity to support up to 10,000 servers to meet the emerging requirements of the growing data processing and internet economy in Turkey. Radore made its first data centre investment in 2005 and was the fastest growing data centre in Turkey according to the 2012/13, 2013/14 and 2014/15 Deloitte Technology Fast 50 survey. ISGSY reports that Radore continues to grow in terms of revenue (up 30% in 2017), capacity utilisation and client numbers. |
Tatil Budur |
06/11/2015 |
28.5 |
20.00 |
ISGSY invested in Mika Tur, which incorporates Tatil Budur, one of the leading tour operators in Turkey, alongside MCI Private Ventures, one of the private equity funds specialized in the field of online tourism services. Tatil Budur is focused on the domestic market, and distinguishes itself from many other tour operators with sales offices across Turkey and a broad product offering including domestic hotels, corporate travel organisations, outbound tourism, flight tickets, cultural tours and transport services. The company underwent management changes in 2017, including a new CEO and CFO, and implemented a rebranding strategy and restructured its online platform. Revenues grew strongly in 2017, with a 61% increase. |
Source: ISGSY
Revival in Turkish M&A may support portfolio activity
With its permanent capital base, ISGSY is under no time pressure to make exits from its investments in the way that a limited partnership fund may typically be. However, its portfolio is relatively mature, with investments in Nevotek (2003) and Ortopro (2007) in particular dating back some time. Capital recycling is a common feature of private equity, whereby IRRs may be optimised by divesting of mature investments to enable reinvestment in new opportunities. The level of activity in M&A serves as a barometer of the market potential for exits and, despite economic and political challenges in the market, there were signs of an increase in Turkish M&A activity in 2017. The increase in aggregate deal value followed a particularly weak 2016 and overall activity generally remains at a low level by historical standards.
|
Exhibit 7: Turkish M&A deal value recovered in 2017… |
Exhibit 8: …but deal volume still low as % GDP |
|
|
|
Source: Deloitte Annual Turkish M&A Review 2017 |
|
Exhibit 7: Turkish M&A deal value recovered in 2017… |
|
|
Source: Deloitte Annual Turkish M&A Review 2017 |
|
Exhibit 8: …but deal volume still low as % GDP |
|
|
Source: Deloitte Annual Turkish M&A Review 2017 |
Total deal value is dominated by a small number of large transactions where foreign investors are disproportionately represented. More positive for ISGSY than the increase in total deal value is the further increase in the number of deals, indicating improving liquidity in the SME segment of the market in which it operates. A continuation of the favourable trend would represent a positive backdrop for ISGSY to return to more active capital recycling.
Financials
Robust net asset value
ISGSY reports according to Turkish Accounting Standards (TAS), as per the Turkish Commercial Code, and is IFRS compliant, with financial statements prepared on an historical cost basis, with the exception of investment securities, which are measured at fair value. The investment securities measured at fair value include the private equity investments as well as the liquid asset investments, the bond and investment fund holdings, and a small amount of listed investments. Changes in the fair value of these assets are taken through the profit and loss account, in line with practices in most other countries.
During the year ended 31 December 2017, net asset value increased by TRY0.8m, or 0.3%, to TRY256.9m and NAV per share by a similar amount to TRY3.44. As in the previous year, income from the liquid asset portfolio was sufficient to meet the administrative costs of the company and cover a negative fair value movement in the value of the PE investments. The latter amounted to TRY2.0m or 1.4% of the opening value. The interest rate applicable to ISGSY’s Turkish time deposits ended the year at 15.0% compared with 11.5% a year earlier, while two-year government bond yields were between c 11% and c 13% during the year.
Exhibit 9: Change in total comprehensive income
TRYm |
2017 |
2016 |
|
Interest income from private sector and treasury bonds |
3.5 |
6.6 |
-48% |
Net fair value gains on investment securities |
3.2 |
3.3 |
-4% |
Bank deposit interest |
3.7 |
3.1 |
18% |
Net trading income from investment securities |
1.9 |
0.8 |
129% |
Dividend income |
0.6 |
0.6 |
0% |
Reverse repo and Takasbank income |
0.5 |
0.3 |
56% |
13.3 |
14.8 |
-10% |
|
Change in fair value of PE investments |
(2.0) |
(3.5) |
|
Total revenue |
11.3 |
11.3 |
0% |
Administrative expenses |
(10.4) |
(10.3) |
0% |
Other operating income/(expense) |
(0.0) |
0.1 |
|
Net profit |
0.9 |
1.1 |
-11% |
Actuarial gains/(losses) |
(0.2) |
(0.0) |
|
Total comprehensive income |
0.8 |
1.1 |
-28% |
Source: ISGSY
Balance sheet changes reflect follow-on investments
As noted above, during the year, ISGSY invested further in three of the existing assets: Nevotek, Ortopro and Toksoz (see below). The aggregate investment was TRY45.25m, funded by a reduction in the liquid asset investments.
Exhibit 10: Balance sheet development
TRYm |
2017 |
2016 |
Change |
Cash and cash equivalents |
29.4 |
45.7 |
-36% |
Short-term investments |
|||
Private sector bonds |
19.7 |
23.6 |
-17% |
Governments bonds |
1.5 |
22.5 |
-93% |
Investments funds |
20.3 |
21.8 |
-7% |
Shares quoted on stock exchange |
4.9 |
5.0 |
-1% |
75.8 |
118.6 |
-36% |
|
Other |
0.9 |
0.8 |
|
Current assets |
76.8 |
119.4 |
|
Long-term investments |
|||
PE Investments |
182.6 |
139.3 |
31% |
Other |
0.0 |
0.1 |
|
Non-current assets |
182.6 |
139.4 |
|
Total assets |
259.4 |
258.8 |
|
Liabilities |
2.5 |
2.6 |
|
Equity |
256.9 |
256.2 |
0% |
Equity and liabilities |
259.4 |
258.8 |
Source: ISGSY
By the end of 2017, private equity investments comprised 71% of total assets, up from 54% a year earlier. The main reductions in liquid assets were from the government bond portfolio as well as in the substantial cash position. Cash and cash equivalents continued to represent 11% of total assets at the 2017 year end, and other liquid investments 18%. ISGSY continues to have considerable flexibility to undertake further long-term investment as it identifies suitable opportunities, although the reduction in liquid assets is likely to have a negative impact on revenues in the current year in the absence of unrealised or realised gains from the PE investments.
There is no company debt (the long-term liability represents provisions for employee benefits), although there is an undisclosed amount of operational debt within the investee companies, and this is reflected in the external valuation of the portfolio carried out by Deloitte.
External DCF and peer comparison PE valuation
As in previous years, the PE investments were valued externally by Deloitte using a discounted cash flow and peer comparison methodology. ISGSY publishes the discount rate and growth rate assumptions used for each investee company, and this year the data are presented as a single number, which we have compared with the midpoint of the previously disclosed range. For each company the discount has increased, with an average increase of 2.1% weighted by closing fair value, although the increases vary quite considerably according to the external valuer’s assessment of the appropriate risk premium.
Exhibit 11: Discount rate assumptions
Discount rate |
2016 midpoint |
2017 v 2016 midpoint |
||
2017 |
2016 |
|||
Toksoz Spor |
18.6% |
17.4-18.4% |
18.0% |
0.6% |
Ortopro |
20.9% |
17.0-18.2% |
17.6% |
3.4% |
Numnum |
20.3% |
16.9-17.9% |
17.4% |
2.9% |
Radore |
19.9% |
15.0-16.0% |
15.5% |
4.4% |
Nevotek |
14.6% |
11.5-12.5% |
12.0% |
2.6% |
Tatil Budur |
20.7% |
19.1-20.1% |
19.6% |
1.1% |
Source: ISGSY
There has been no change to the assumed growth rates, with the exception of a small increase in the rate assumed for Nevotek. The growth rates assumed are in nominal terms and appear relatively low compared with current Turkish inflation, but reflect the external valuer’s assessment of long-term inflation prospects. The Nevotek growth rate assumption continues to be noticeably below that of the other companies because the external valuation is conducted in US$ terms, reflecting Nevotek’s underlying operations.
Exhibit 12: Growth rate assumptions
Growth rate |
2016 mid-point |
2017 v 2016 mid-point |
||
2017 |
2016 |
|||
Toksoz Spor |
5.5% |
5.0%-6.0% |
5.5% |
0.0% |
Ortopro |
5.5% |
5.0%-6.0% |
5.5% |
0.0% |
Numnum |
5.5% |
5.0%-6.0% |
5.5% |
0.0% |
Radore |
5.5% |
5.0%-6.0% |
5.5% |
0.0% |
Nevotek |
1.9% |
1.3%-2.3% |
1.8% |
0.1% |
Tatil Budur |
5.5% |
5.0%-6.0% |
5.5% |
0.0% |
Source: ISGSY
ISGSY has also provided an updated sensitivity analysis, showing the effect of changes to the assumptions on the value of the investments. An increase of 0.5% in the revenue growth assumption would add TRY6.3m to fair value (TRY4.9m in 2016), an increase of 0.5% in the assumed growth of EBITDA would add TRY10.2m to fair value (previously TRY7.6m) and a 0.5% reduction in the risk rate would add TRY13.4m to fair value (previously TRY8.2m). Changes to the assumptions in the opposite direction are anticipated to have broadly symmetrical impacts.
Exhibit 13: Fair value sensitivity of ISGSY’s private equity investments
TRYm |
Increase |
Decrease |
Annual revenue growth 0.5% change |
6.2 |
(5.7) |
EBITDA growth rate 0.5% change |
10.2 |
(10.2) |
Risk-adjusted discount rate 0.5% change |
(12.3) |
13.4 |
Source: ISGSY
Fair values held up in challenging business environment
As noted above, the value of the PE investments increased significantly as a result of new investment, but this was partly offset by a negative fair value adjustment, amounting to TRY2.0m or 1.4% of the opening value of the PE investments.
Exhibit 14: Change in value of PE investments
Opening value |
Capital increase |
Change in fair value |
Closing value |
Change in fair value as % opening value |
|
TRY |
|||||
Toksoz Spor |
31,617,850 |
27,500,000 |
(7,307,396) |
51,810,454 |
-23% |
Ortopro |
23,512,701 |
12,750,000 |
(13,507,156) |
22,755,545 |
-57% |
Numnum |
36,189,989 |
1,572,162 |
37,762,151 |
4% |
|
Radore |
18,301,605 |
(358,020) |
17,943,585 |
-2% |
|
Nevotek |
15,980,785 |
5,000,000 |
2,852,113 |
23,832,898 |
18% |
Tatil Budur |
13,711,800 |
14,764,600 |
28,476,400 |
108% |
|
Total |
139,314,730 |
45,250,000 |
(1,983,697) |
182,581,033 |
-1% |
Fair value movement as % opening value |
1.4% |
Source: ISGSY
Although the economic and geopolitical environment remained challenging in 2017, ISGSY reports that the investee companies saw aggregate revenue growth of 35%. Despite higher discount rates being applied across the portfolio, Nevotek and Tatil Budur saw good increases in fair value, but this was offset by the declines at Toksoz and Ortopro.
The accounts of Is Yatirim (ISMEN), which owns 30.5% of ISGY and consolidates it as a subsidiary, do provide some insight into developments. The accounting principles applied by ISMEN not only consolidate ISGSY but also its majority-owned subsidiaries, and equity account for Radore and Tatil Budur. In respect of ISGSY, the 2017 ISMEN accounts (Exhibit 15) show a further increase in gross profits and a slight decline in expenses, with the operating performance improving significantly. This result gives a sense of the trading results of Numnum, Nevotek, Ortopro and Toksoz Spor. The result from associates also improved significantly, a positive indication for Radore and Tatil Budur.
Exhibit 15: ISMEN P&L data
TRYm |
2017 |
2016 |
Change |
Revenue |
262.6 |
228.4 |
15% |
Cost of sales |
(184.5) |
(159.1) |
16% |
Gross profit |
78.2 |
69.4 |
13% |
Expenses |
(96.7) |
(97.9) |
-1% |
Operating profit |
(18.5) |
(28.6) |
-35% |
Associates |
(2.4) |
(4.1) |
|
Net finance expense |
(15.9) |
(12.9) |
24% |
Profit/(loss) before tax |
(36.9) |
(45.5) |
-19% |
Source: Is Yatirim Menkul Degerler
The improving operational result is encouraging, while the increased investment in certain subsidiaries may well see a reduction in net interest expense going forwards.
Valuation
ISGSY trades at a substantial discount of c 52% to its end-2017 NAV. ISGSY’s dividend policy is to distribute at least 30% of distributable profit as bonus shares and/or cash. Historically, the company has a reputation for paying high dividends, particularly when realising gains from the disposal of investments, but not during 2016 and 2017 (see Exhibit 1 on page 2).
Although there are other quoted private equity companies in Turkey, none is included within the Morningstar database, used by the Association of Investment Companies and our source for comparison of ISGSY with other similar companies. From Morningstar, we can extract data on a small number of closed-ended private equity funds that invest in emerging markets (EM). Unfortunately, that list has become smaller with the transition of East Capital Explorer (previously included in our analysis) to an externally managed real estate investor in the Baltics. Exhibit 16 shows their performance, which is presented in sterling terms for each.
Exhibit 16: Selection of closed-ended quoted EM private equity companies
Group/Investment |
Latest market cap (£m) |
NAV TR 1 year (%) |
NAV TR 3 years (%) |
NAV TR 5 years (%) |
Latest discount (ex-par) |
Adamas Finance Asia Ord |
49.5 |
(8.2) |
(25.5) |
(84.9) |
(37.3) |
China Assets Ord |
725.4 |
(9.7) |
(13.2) |
7.3 |
(56.0) |
Origo Partners Ord |
5.0 |
(42.5) |
(20.4) |
(75.2) |
(81.5) |
Symphony International Holding Ord |
390.1 |
7.3 |
28.7 |
34.2 |
(37.8) |
Simple average |
292.5 |
(13.3) |
(7.6) |
(29.6) |
(53.1) |
Weighted average |
(4.1) |
0.3 |
12.0 |
(49.2) |
|
Is Private Equity |
23.0 |
0.3 |
(0.1) |
48.3 |
(52.9) |
Source: Morningstar. Note: Prices as at 2 March 2018 in £. China Assets is listed in Hong Kong.
Broadening the comparison to include a larger group of listed PE investment companies, not limited to EM-specific investment, we can see that in the period up to 2013, ISGSY saw its P/NAV ratio reach a relative high, with a peak premium of c 5%. This valuation peak coincided with the realisation of a TRY82.5m profit from the sale of Aras Kargo in July 2013, making the declaration of a substantial TRY0.45 per share special dividend for the year possible (see page 2). The subsequent period of de-rating began with the first Gezi Park protests in Istanbul, which has been followed by a period of significant macroeconomic and geopolitical challenge.
The narrowing of the discount to NAV in the past c 18 months, from a high of c 60% in mid-2016, broadly mirrors that of the wider sector but is supported by the improved domestic political and economic conditions in Turkey since the attempted coup in mid-2016. The gap with the broader group of PE investors has been maintained, with the latter showing stronger gains in NAV TR to support their share price advances. The one-year return for the LPX Direct Index is a little more than 50%.
Further improvements in the Turkish political and economic environment have the potential to both support underlying NAV TR through improved business conditions for investee companies, and narrow the P/NAV ratio, enhancing share price total return.
|
Exhibit 17: Discount to NAV progression |
|
|
Source: Bloomberg, Edison Investment Research |
Sensitivities
Although the domestic political environment has become more settled, geopolitical tensions and war in the region continue to represent risk factors beyond the control of management that may have a significant impact on both the business and trading environment of investee companies and the market valuation of Turkish assets.
However, economic conditions have improved materially, which is a positive indication for the performance of the existing asset portfolio, and raises the prospect of exits for some of the mature assets. ISGSY’s balance sheet remains liquid, providing the resources for new investment as opportunities arise.
A lack of visibility to the look-through performance of the underlying (private) assets is a feature of the private equity industry and valuations are inevitably subjective, not being based on traded prices. In this respects, ISGSY can point to a track record of profitable exits and the fact that its portfolio valuations are independently and externally produced.
|
|
Research: Investment Companies
HarbourVest Global Private Equity (HVPE) offers broad, selected exposure to leading private equity managers globally, and has a highly diversified underlying portfolio. HVPE celebrated its 10th anniversary in December 2017, and its 10-year sterling NAV total return of 12% pa is ahead of its global listed equity benchmark’s 10% pa return, as well as the 6% pa return of the LPX 50 Index, representing its global listed private equity peers. However, an 11% gain in sterling versus the US dollar (HVPE’s functional currency) has weighed heavily on its one-year sterling returns. Looking ahead, HVPE believes its unique access to HarbourVest funds should enable it to capture the opportunities created by key global megatrends that are expected to dominate private markets over the next 10 years.