Last close As at 06/08/2026
—
— 0.00 (0.00%)
Market capitalisation
—
Research: Consumer
Treatt
Written by
Treatt |
What a Treatt |
FY16 results |
Food & beverages |
18 January 2017 |
Share price performance
Business description
Next events
Analysts
Treatt is a research client of Edison Investment Research Limited |
|||||||||||||||||||||||||||||||||||||||||||||||||||
Treatt is steadily transforming itself from a seller of flavour and fragrance-based commodities to a value-added ingredients supplier. The strategy of deep customer knowledge is paying off, leading to stronger relationships, a real competitive advantage and greater profitability, with EBIT margins increasing from 9.6% in 2014 to 10.8% in 2016. Management has delivered four consecutive years of earnings above expectations and the momentum remains strong. Our DCF analysis calculates a fair value of 293p, supported by benchmark analysis that places the stock at a c 30% discount to its peer group.
Year end |
Revenue (£m) |
PBT* |
EPS* |
DPS |
P/E |
Yield |
09/16 |
88.0 |
9.6 |
14.3 |
4.4 |
18.2 |
1.7 |
09/17e |
92.4 |
10.3 |
15.2 |
4.6 |
17.1 |
1.8 |
09/18e |
96.1 |
10.6 |
15.7 |
4.7 |
16.5 |
1.8 |
09/19e |
100.0 |
10.8 |
16.0 |
4.8 |
16.2 |
1.9 |
Note: *PBT and EPS are normalised, excluding amortisation of acquired intangibles, exceptional items and share-based payments.
A winning strategy
Since CEO Daemmon Reeve took over in 2012, Treatt’s culture has changed significantly. The old ‘silo’ mentality has been broken down and replaced by an open, collaborative and customer-focused culture. This has allowed the company to deliver on its strategy of moving up the value chain and delivering sustainable growth in profits in the flavour, fragrance and fast-moving consumer goods (FMCG) markets. During FY16 the performance was broad based, spanning beverages, core flavours and fragrances and personal care. Cash-flow generation continued to be strong and hence net debt now sits at an 11-year low, which will stand the business in good stead ahead of the relocation of the UK head office.
Ingredient solutions are an attractive segment
Consumers continue to demand products with cleaner labels and better health credentials, which require specialist ingredients. Sugar reduction is a key area of focus in the food and beverage space, which is likely to continue for the foreseeable future. Growth and margins are typically higher at the value-added end of the ingredients spectrum. Treatt’s ingredient solutions are used by both food ingredients companies in their formulations and by food and beverages companies directly. Treatt has particular emphasis in the beverages space, with tea becoming an interesting area of growth and expertise.
Valuation: Attractive ingredients play
Our DCF-derived fair value is 293p (previously 272p: we have reduced our risk free rate by 50bp to reflect the current environment), an attractive c 13% upside to the current share price. This is supported by its benchmark valuation, with Treatt trading at 16.9x and 11.7x CY17 P/E and EV/EBITDA, representing a c 25% discount to its ingredients peer group on both metrics. Given our outlook for the business and strong track record, we believe this level of discount is unwarranted.
Investment summary
Company description
Treatt provides high-quality innovative ingredient solutions to the flavours, fragrance and cosmetics industries, as well as directly to global FMCG manufacturers. The beverages space has proved to be a growth segment for the company recently, in particular sugar reduction and ready-to-drink tea. Treatt’s in-depth knowledge of the commodities markets in which it operates (non exchange-traded) and its long-term relationships with suppliers provide the group with an important competitive advantage. Treatt has more than 125 years of experience and knowledge of sourcing and trading raw materials, which acts as a barrier to entry for potential new entrants.
Valuation
Despite the share price rising 32% in absolute and 11% in relative (FTSE All-Share) terms over the last 12 months, it still trades at a significant discount to its peer group based on benchmark valuation metrics. We value Treatt on a DCF basis and derive a fair value of 293p, or c 13% upside. This is predicated on a WACC of 7.5% (encompassing a beta of 0.8, an equity risk premium of 5.0% and a borrowing spread of 5.0%) and a terminal growth rate of 2%. We have reduced our risk free rate from 4% to 3.5% to reflect the current environment.
We note that on a benchmark valuation basis, Treatt trades at a substantial discount to its ingredients peer group on both P/E and EV/EBITDA. Treatt trades at 16.9x and 11.7x CY17 P/E and EV/EBITDA, representing a 29% and 23% discount to the peer group respectively. This gap is unwarranted in our view.
Financials: Another strong year
The company enjoyed another strong year in FY16 with revenue growth of 2.5%, profit before tax was up 11% on an adjusted basis, and adjusted diluted EPS was up 7%. The new year has started well, despite Q1 being seasonally the quieter quarter. We therefore expect the momentum built through FY16 to somewhat dampen at the start of FY17. New business wins are continuing, and Treatt is still improving its systems and processes to drive further efficiencies in the business.
Looking into the medium term, we forecast 4.3% revenue CAGR and 4.2% pre-exceptional PBT CAGR, translating to 3.8% pre-exceptional earnings CAGR for 2016-19. Management’s proven track record in meeting or beating expectations, in combination with the positive outlook for the natural ingredients industry, gives us confidence that our forecasts will be met. In addition, we note that management has been successful in controlling costs through internal self-help measures, and we expect this trend to continue.
UK relocation
The company has announced its intention to fully relocate the UK business to another site near the existing one. The project is complex and multifaceted, but the overall cash outflow over two to three years is estimated to be £21-31m, which we expect to be funded from existing facilities.
Sensitivities
Despite 60% of turnover being exposed to the ‘defensive’ beverage sector, Treatt has a couple of key sensitivities, which it seeks to mitigate through the in-depth knowledge and skills base of its buying team and undertaking an active hedging policy where possible:
■
Commodity exposure: namely citrus oils, which make up c 30% of revenues.
■
Foreign exchange: translation risk on US dollar profits, which it manages through hedging.
Company description
Treatt has more than 125 years’ experience as a supplier of innovative ingredient solutions to the flavour, fragrance and consumer goods industries. Its historic strength has been in ingredient sourcing and risk management, but it has invested in manufacturing its own higher value-added, higher-margin products. These now account for more than half of sales and three-quarters of group profits. Treatt’s main customers operate in the flavours and fragrance industries: its products are used by flavours and fragrances manufacturers and blended together to create highly value-added ingredients, which are in turn sold to FMCG companies. Treatt also sells directly to FMCG companies for use in their products, and brewing has proved to be a growth segment for the company over recent years.
Treatt’s customer base is broad reaching in terms of size and geographic spread and, while a key part of the new strategy is to focus on growing sales with a smaller number of larger customers, at present the breadth of its customer base means the group is not overly dependent on any one relationship, with its largest customer representing c 10% sales, and the top 10 customers representing c 35% sales. Approximately 75% of Treatt’s product portfolio is flavour ingredients, and these are mostly used in the beverages space. The remaining 25% of the portfolio encompasses fragrance ingredients. Typical end-products that use Treatt ingredients range from soft drinks, alcoholic beverages (mainly craft beers) and confectionery, to soaps, shampoos and basic pharmaceutical products. Treatt has manufacturing sites in the UK, US and Kenya, in which its three 100%-owned subsidiaries, RC Treatt, Treatt USA and Earthoil, are principally based. In addition to its manufacturing centres, Treatt has sales offices in China and France and a network of agents throughout the world, through which it exports to more than 90 countries worldwide. In FY16 the company added headcount and laboratory facilities to its Chinese office to increase its sales focus there.
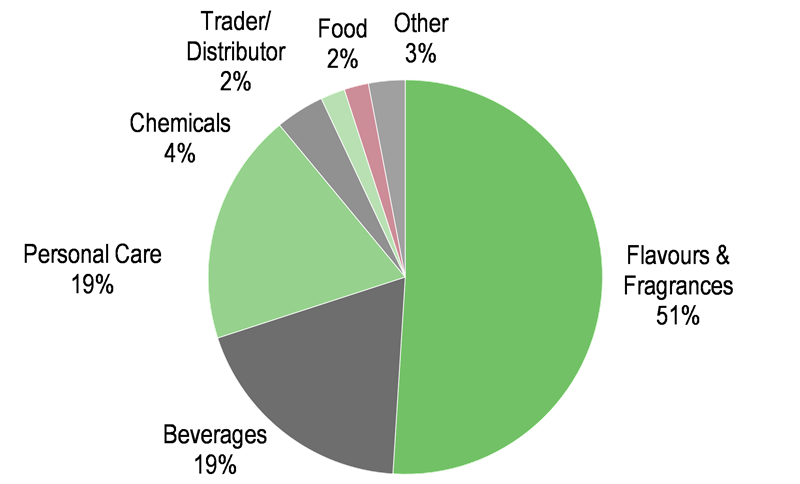
Exhibits 1 and 2 show a breakdown of revenue by geographic market and by customer sector.
|
Exhibit 1: Revenue by geography (FY16) |
Exhibit 2: Revenue by customer sector (FY16) |
|
|
|
Source: Treatt |
Source: Treatt |
|
Exhibit 1: Revenue by geography (FY16) |
|
|
Source: Treatt |
|
Exhibit 2: Revenue by customer sector (FY16) |
|
|
Source: Treatt |
In Exhibit 3 we illustrate Treatt’s product suite. Treatt used to be run along discrete product lines, but when CEO Daemmon Reeve took over in 2012 one of his key strategic priorities was to break down the ‘silo’ mentality that existed among the three operating units. Treatt now has a number of key areas of focus, and the product suite supports these: beverages remain Treatt’s main area of expertise as liquid flavourings are most often used in beverages, and the company now derives c 60% of its revenues from the beverage industry. Citrus is a historic segment of strength for the group and remains the largest; sugar reduction is growing very quickly given current consumer trends; RTD Tea has also witnessed strong growth and is a popular area for new product launches given its health credentials which resonate with the consumer. The high impact flavours business remains a good-sized contributor, albeit generally at a somewhat lower margin.
|
Exhibit 3: Treatt product suite |
|
|
Source: Edison Investment Research, Company data |
Treatt has outgrown its current UK manufacturing facilities in Bury St Edmunds. The company has announced its intention to fully relocate the UK business to another site near the existing one to continue to deliver its medium-term growth objectives. The project is complex and multifaceted, but the overall cash outflow over two to three years is estimated to be £21-31m. The exact timing is still not known as the new site is part of a major strategic business development in the area. On 22 December 2016, Treatt announced it had conditionally exchanged contracts on a ten-acre plot of land. Completion of the purchase is subject to the vendor obtaining outline planning permission and hence is not expected to occur until later in CY17.
Industry overview
The food and beverage industry has evolved and the current trend is for natural, clean label, calorie-free and sustainable products. Consumers demand these product features, causing the market for natural and naturally-derived products to accelerate in growth and creating significant profit potential for both food and beverage manufacturers and ingredients suppliers. The products are highly desirable but also require a significant degree of complexity and know-how to formulate and utilise, thus giving rise to higher margins.
Consumers perceive natural ingredients as having a positive impact on general health, while synthetic ingredients are viewed with suspicion. As a result, food and beverage manufacturers have promptly responded to the situation by completely or partially replacing synthetic ingredients with their natural or clean-label counterparts. One example is the launch by the Coca-Cola Company of Coca-Cola Life, which is sweetened with cane sugar and stevia leaf extract and has 45% fewer calories than regular (full sugar) colas. This followed Pepsi’s launch of Pepsi True in October 2014 (and Pepsi Next in some markets), which is also sweetened with stevia leaf extract. This is a constantly-evolving process, as we note the original Coca-Cola Life had 35% fewer calories and sugar than regular Coca-Cola, whereas now it has 45% fewer calories.
A common problem in the wellness space is that the better-for-you variants often have a compromised taste. To keep taste as close as possible to the regular product, complex formulations take centre stage and may require an ongoing iterative process to optimise the taste. For example, stevia is an increasingly popular 100% natural sweetener; however, it is also renowned for a signature bitter liquorice aftertaste. Treattaromes are Treatt’s trademark From the Named Food (FTNF) portfolio of clear aqueous distillates that naturally offset the aftertaste. They provide a natural sweet top-note flavour and are an exciting potential way for Treatt to participate in this fast-growing sector of the beverage market.
We believe Treatt is in an excellent position to benefit from the constant need for FMCG manufacturers to produce a stream of new product formulations to keep consumers engaged, particularly given its focus on deep customer knowledge and relationships, thus enabling it to work closely with its clients. It is also well placed to capitalise on the natural and clean-label trends given its expertise in FTNF solutions. In the short term, capacity constraints in the UK, and in the medium term in the US, are limiting factors in the group’s ability to take full advantage of its expertise; however, payback on any future capacity investment, both in terms of percentage return and the time taken to achieve it, is likely to look attractive.
An interesting space
The flavours and fragrances space spans a wide range of applications and end-markets. We outline below the factors that we believe mean Treatt is well positioned within the space.
■
Expertise in the natural and organic segments. Its FTNF ingredients portfolio (which is constantly expanding and now encompasses around ten different key flavours, supported by a wide range of variants) is in the sweet spot for current consumer preferences regarding clean-labelling. One in four products launched globally in 2015 had a label-friendly claim (defined as no additives/preservatives, natural, organic and/or non-GMO), which amounted to 65,000 launches (source: Innova Market Insights).
■
A constantly expanding diverse product portfolio that enables Treatt to meet any customer specification. The company has a strong and established background in citrus, and the extensive Treattarome and Treattzest ranges are registered trademarks. Tea is also an increasingly interesting area.
■
The beverage industry is valued at c $1300bn globally (source: Lucintel, Treatt) and natural flavours are key ingredients. In addition, sugar reduction is an important area of focus. Treatt now derives c 60% of its revenues from the beverage industry (including ingredients sold to flavours and fragrances customers that are then sold on to beverage customers). Its FTNF portfolio of clear aqueous (and hence liquid) distillates is ideal for application in the beverage industry and Treatt continues to win new business in large-cap FMCG.
■
The company’s long-term relationships with farmers and growers globally ensure the traceability and sustainability of its products. In addition, these deep-rooted relationships also ensure a reliable and consistent supply even in periods of commodity price hikes or product shortages.
■
Its origins as a raw material supplier mean Treatt benefits from a vertically integrated supply chain, which to a certain extent safeguards the efficacy of its raw material sources and allows it to compete more effectively with its larger peers.
■
Treatt is increasingly valuing strong relationships with both customers and suppliers (see Strategy section below), thus enabling the use of long-term contracts to mitigate commodity price risk and hence reduce gross margin volatility.
■
Treatt’s ingredients ensure a consistent and high-quality flavour profile, which is a key attribute in the FMCG space. While consumers demand natural products, they also have a marked preference for consistency. The latter is very hard to achieve with natural flavours alone, as these are complex and contain hundreds or more volatile constituents, versus their far more stable synthetic counterparts.
■
Treatt has the ability to supply a broad range of flavour and fragrance ingredients and has been very flexible in terms of size and location. This has historically formed a point of differentiation between the company and its larger multinational competitors, which often have stricter policies on minimum quantity and standardised packaging. However, to protect margins, this capability is now strictly applied where an existing profitable relationship exists with a client, or where the provision of a broad range of ingredients may be built into a profitable relationship.
■
The company is proactive in meeting the challenges of the ever-changing regulatory landscape, not only ensuring consistent compliance with industry standards (resulting in an accreditation from the Global Food Safety Initiative), but also using its expertise as a value-added service to its global customer base. The ever-increasing level of regulation in the industry serves as an additional barrier to entry to potential new competitors. As illustrated in Exhibit 1, Treatt’s geographical exposure is diverse. The US is its single largest market, accounting for c 40% of sales, followed by the UK at c 10%. Treatt is investing in the US business by enhancing its technical facilities, and is relocating the UK business to provide it with necessary investment for future growth. China is still relatively small at 5%, but management believes it represents a significant growth opportunity, hence the opening of a sales office and application and sample lab in China in FY16.
Strategy
The group updated its strategy in H215 as the previous strategic priorities had been embedded within the business ahead of schedule. The group now has five key pillars to support a focused sales approach, thus leading to long-term, sustainable profit growth:
■
Meeting customer needs: the flavours and fragrances and ingredient solutions arena is increasingly dynamic and competitive as customers seek to differentiate their products with ever-more sophisticated formulations to win over the consumer. Treatt has a very good reputation in the market and its deep-rooted expertise ensures customers consistently receive quality products.
■
Solutions in many forms: Treatt is engaging ever-more closely with its customers by deploying its highly skilled experts to assist its customers. This allows both parties to be at the forefront of flavour innovation and development, and helps cement deep trust. In turn, this increases the likelihood of customers using Treatt as the ‘go-to’ supplier, rather than shopping around. Not all ingredient solutions, however, are necessarily highly innovative, and Treatt continues to operate its traditional ingredients business, though it is increasingly focused and streamlined to avoid unprofitable client relationships.
■
Differential advantage: Treatt’s highly skilled experts are key to its competitive edge. The experts are deployed to the customers and also travel with the sales team to maximise customer engagement. To this end, sales are seen as every employee’s responsibility and not just a separate company department.
■
Customer intimacy: this has become a key area of focus to understand customers better and hence deliver superior and more profitable solutions. This in turn should ensure customers deem Treatt to be their first choice supplier.
■
Culture: the CEO, Daemmon Reeve, is committed to cultural change, and more specifically a culture of empowerment to champion a can-do attitude. Treatt recognises that a happy, well-motivated and experienced workforce will be more successful. The drive for cultural change started as soon as the current CEO took the helm in 2012, and the business now operates on an increasingly global platform. Internal structures are continually improved to ensure collaboration and knowledge-sharing across the business.
Combined, the individual strategies outlined above contribute to the final strategy objective of consistent, sustainable growth in profit. While in the short term gross margins can fluctuate due to cyclical changes in raw material costs (specifically citrus oils),over time the evolution of the portfolio towards higher-margin, higher value-added ingredient solutions suggests gross margins should rise over the medium term. Equally, management commitment to contain fixed costs is clear; as such management views an EBIT margin in the low teens as achievable in the medium term, versus our forecast for FY17 of 10.9% and our DCF terminal EBIT margin assumption of 13%.
While M&A could prove to be a value-added opportunity in the medium to long term, in the near term management believes that enough opportunity exists in executing on its organic strategy, without the inevitable distraction of exploring external opportunities. In addition, the relocation of the UK head office and manufacturing site is likely to use much of the available financial as well as management resource over the next couple of years.
Sensitivities
Commodity exposure
Due to its background as a trader in raw material ingredients and the breadth of the product range it offers to customers, Treatt is exposed to a wide range of commodities. In general, this means that fluctuations in commodity prices tend to even out across the portfolio, as a ‘natural hedge’. The exception, however, is the group’s sizeable exposure to citrus oils, mainly orange and lemon.
Citrus oils
Citrus oils represent c60% of Treatt’s raw materials expenditure. Orange oil is a non exchange-traded commodity, so its supply is managed by Treatt’s highly skilled stock teams in the US and UK, with their deep market knowledge and expertise adding value to customers by consistently ensuring best prices and consistency of supply.
95% of Treatt’s supply of orange oil comes from two key markets – Brazil and Florida – yet both markets have been negatively affected in recent years by disease and adverse weather patterns that have reduced both quantities of oranges grown and the quality of the overall crop. Orange oil is a by-product of orange juice, extracted through the process of centrifugation. Despite being a by-product, there is no direct relationship between the price of orange oil and the publicly traded price of orange juice. This is because the key determinant of price is not simply the quantity of fruit grown in any one growing season, but rather the complex interaction of a number of influences, driven in the main by the amount of fruit that the processors need to buy to produce the quantities of juice they need to satisfy demand. The current influences on the price of orange oil are:
■
Florida production was down 16% on last year and was the lowest crop in 50 years. In addition, citrus greening (HLB, or yellow shoot disease) has had a significant impact on the Florida crop over the last few years and this affects the colour of the orange oil (turning it green).
■
The Brazilian crop was down 18% on last year’s already low volumes, although yields have improved.
While prices have moderated since the elevated levels of 2015 (when prices reached $10/kg vs the long-term average of $2-3/kg), they remain at a heightened $7-8/kg. Management is expecting citrus oil prices to soften somewhat through FY17.
The lemon oil market, on the other hand, is expected to be stable. Supply from Spain was well-below average, and both Spanish and Italian prices for fruit were very high. Although the Argentinean season has started late due to the weather, the output should make up for the Spanish shortfall. Management expects pricing to be below that of last year but to remain stable.
The group’s deep insight into the markets of both commodities has very clearly helped it navigate the worst of the volatility, and gives a significant value-added service to customers who may not have a similar level of insight. Increasingly, Treatt is looking to secure longer-term contracts from both customers and suppliers to smooth out volatility in raw material procurement and revenues, thus hoping to reduce volatility in group gross margin.
Foreign exchange
The principal foreign exchange risk is sterling/US dollar, which affects the company from both a transactional and a translational point of view:
■
Transactional: raw materials (including orange oil) are mainly purchased in US dollars, thus affecting the cash values of sales and the gross margin if subsequently sold in a different currency. Movements in the US dollar can also affect the replacement cost of stock, which can and does have an impact on profitability as well as competitiveness.
■
Translational: sales are made to more than 90 countries, thus fluctuation in the sterling exchange rate can affect reported revenues, gross profit and operating costs.
To try to mitigate the main sterling/US dollar exposure, Treatt has a policy of maintaining the majority of its cash balances – including group overdraft facilities – in US dollars, and to a lesser extent in euros, as this is a cost-effective way of providing a natural hedge. In addition, the company takes out forward FX contracts to hedge the risk.
For the full year to September 2016, we calculate that on average the sterling weakened by 9.1% against the US dollar. However, due to the hedging activity undertaken by the company as per its standard procedure, the full-year foreign exchange impact on group results was a reduction in PBT of c £0.5m.
New UK headquarters
Treatt has outgrown its current UK manufacturing facilities in Bury St Edmunds and had been exploring options for some time. In May 2015 the company announced its intention to fully relocate the UK business to another site near the existing one. On 22 December 2016, Treatt announced it had conditionally exchanged contracts on a ten-acre plot of land. The purchase is conditional upon the vendor obtaining outline planning permission, so the exact timing is unknown, but is likely to be later during CY17.
The new facility will be purpose-built, with upgraded machinery and the latest technology. The project is obviously complex, but the overall cash outflow over two to three years is forecast to be £21-31m, including spend of £3-5m on some capital projects that have been held back in view of the relocation (in effect delayed capex, and indeed FY16 capex was particularly low at £0.7m as management sensibly reduced capital expenditure to the minimum possible in view of the imminent relocation). Construction is expected to begin in 2018, with the site up and running by late 2019. We currently forecast costs of £6.5m in FY17, £18m in FY18 and £3.5m in FY19, or £28m in total, which is towards the upper end of the £21-31m guidance range. We expect the cost to be met from existing funding facilities.
Valuation
We illustrate Treatt’s valuation versus its ingredients peer group below. It trades at a significant discount to its peer group on all metrics. While some discount can be applied given its small size and some of its products are relatively ‘upstream’ in the ingredients spectrum (in particular the bulk ingredients that are sold to other ingredients companies and tend to be lower value-added/lower margin and are then further refined and mixed by the other ingredients companies to produce their own proprietary value-added ingredients) and hence would command a lower multiple, we believe a 25% discount on EV/EBITDA and P/E is unwarranted.
Exhibit 4: Benchmark valuation
Market cap |
PE (x) |
EV/EBITDA (x) |
Dividend yield (%) |
||||
(m) |
2017e |
2018e |
2017e |
2018e |
2017e |
2018e |
|
Givaudan |
CHF 16,731 |
24.4 |
22.0 |
15.3 |
14.7 |
3.2% |
3.4% |
IFF |
$9,277 |
21.4 |
19.9 |
14.3 |
13.3 |
2.0% |
2.3% |
Symrise |
CHF 7,884 |
25.4 |
23.1 |
14.4 |
13.0 |
1.5% |
1.7% |
Frutarom |
ILS 12,050 |
25.2 |
20.6 |
16.7 |
14.2 |
0.5% |
0.6% |
Chr Hansen |
DKK 52,345 |
31.6 |
28.1 |
20.7 |
18.6 |
1.6% |
2.1% |
Kerry |
€ 12,057 |
21.3 |
19.8 |
15.3 |
14.1 |
0.8% |
0.9% |
Ingredion |
$9,171 |
17.9 |
16.8 |
10.1 |
9.3 |
1.5% |
1.6% |
Peer group average |
23.9 |
21.5 |
15.2 |
13.9 |
1.6% |
1.8% |
|
Treatt |
£133.8 |
16.9 |
16.5 |
11.7 |
11.1 |
1.8% |
1.8% |
Premium/(discount) to peer group |
-29.2% |
-23.3% |
-23.0% |
-19.9% |
12.2% |
1.7% |
|
Source: Bloomberg. Note: Treatt figures are calendarised to aid comparison. Prices as at 18 January 2017.
Our DCF-derived fair value is 293p (previously 272p). This is predicated on a WACC of 7.5% (encompassing a beta of 0.8, an equity risk premium of 5.0% and a borrowing spread of 5.0%) and a terminal growth rate of 2%. We have reduced our risk free rate from 4% to 3.5% to reflect the current environment.
Below, we show a sensitivity analysis to these assumptions and note that the current share price is implying a terminal EBIT margin of 13.0% and a terminal growth rate of c 1%.
Exhibit 5: DCF sensitivity to terminal growth rate and EBIT margin (p)
Terminal growth |
EBIT margin |
|||||
12.0% |
12.5% |
13.0% |
13.5% |
14.0% |
||
-1.0% |
202 |
207 |
213 |
218 |
223 |
|
0.0% |
220 |
226 |
232 |
239 |
245 |
|
1.0% |
244 |
251 |
258 |
265 |
273 |
|
2.0% |
276 |
285 |
293 |
302 |
310 |
|
3.0% |
323 |
334 |
344 |
355 |
365 |
|
4.0% |
397 |
411 |
424 |
438 |
452 |
|
Source: Edison Investment Research
Financials
FY16 sales were up 2.5%, profit before tax was up 11% on an adjusted basis, and adjusted diluted EPS was up 7%. The drive towards higher value-added products helped improve gross margins, and this continues to be an area of focus for the group. Strategically, the main objective is to collaborate ever more closely with its customers, to deliver superior solutions and become the supplier of choice, thus leading to long-term, sustainable profit growth. The group has invested in innovation and staff development, and more recently on growing its activities in China, where it sees great potential and hence has increased its capabilities. Net debt continued to fall and stood at £1.7m at the end of FY16. It is likely to increase once the UK site relocation goes ahead.
Forecasts
We updated our forecasts following the FY16 results published at the end of November (see our research report here for the details), and hence we leave our key forecasts unchanged. We have introduced FY19 forecasts into our model.
Exhibit 6: Financial summary
£000s |
2014 |
2015 |
2016 |
2017e |
2018e |
2019e |
||
Year end September |
IFRS |
IFRS |
IFRS |
IFRS |
IFRS |
IFRS |
||
PROFIT & LOSS |
||||||||
Revenue |
|
|
79,189 |
85,934 |
88,040 |
92,442 |
96,140 |
99,985 |
Cost of Sales |
(61,218) |
(66,955) |
(67,639) |
(72,403) |
(75,203) |
(78,111) |
||
Gross Profit |
17,971 |
18,979 |
20,401 |
20,039 |
20,937 |
21,874 |
||
EBITDA |
|
|
9,068 |
10,307 |
11,604 |
12,421 |
13,098 |
13,802 |
Operating Profit (before amort., except and sbp.) |
|
|
7,846 |
9,063 |
10,257 |
10,880 |
11,496 |
12,135 |
Intangible Amortisation |
(172) |
(175) |
(142) |
(160) |
(160) |
(160) |
||
Share based payments |
(46) |
(198) |
(566) |
(652) |
(673) |
(686) |
||
Other |
0 |
0 |
0 |
0 |
0 |
0 |
||
Operating Profit |
7,628 |
8,690 |
9,549 |
10,068 |
10,663 |
11,290 |
||
Net Interest |
(724) |
(740) |
(703) |
(559) |
(851) |
(1,291) |
||
Exceptionals |
(1,402) |
(174) |
(553) |
0 |
0 |
0 |
||
Profit Before Tax (norm) |
|
|
7,122 |
8,323 |
9,554 |
10,321 |
10,645 |
10,844 |
Profit Before Tax (FRS 3) |
|
|
5,502 |
7,776 |
8,293 |
9,509 |
9,812 |
9,998 |
Profit Before Tax (company) |
|
|
6,904 |
7,950 |
8,846 |
9,509 |
9,812 |
9,998 |
Tax |
(1,553) |
(1,786) |
(2,144) |
(2,425) |
(2,502) |
(2,550) |
||
Profit After Tax (norm) |
5,326 |
6,537 |
7,410 |
7,896 |
8,143 |
8,294 |
||
Profit After Tax (FRS 3) |
3,949 |
5,990 |
6,149 |
7,084 |
7,310 |
7,449 |
||
Average Number of Shares Outstanding (m) |
51.3 |
51.5 |
51.9 |
51.9 |
51.9 |
51.9 |
||
EPS - normalised (p) |
|
|
10.4 |
12.7 |
14.3 |
15.2 |
15.7 |
16.0 |
EPS - normalised & fully diluted (p) |
|
|
10.3 |
12.6 |
14.1 |
15.0 |
15.5 |
15.8 |
EPS - (IFRS) (p) |
|
|
7.7 |
11.6 |
11.8 |
13.7 |
14.1 |
14.4 |
Dividend per share (p) |
3.8 |
4.0 |
4.4 |
4.6 |
4.7 |
4.8 |
||
Gross Margin (%) |
22.7 |
22.1 |
23.2 |
21.7 |
21.8 |
21.9 |
||
EBITDA Margin (%) |
11.5 |
12.0 |
13.2 |
13.4 |
13.6 |
13.8 |
||
Operating Margin (before GW and except.) (%) |
9.9 |
10.5 |
11.7 |
11.8 |
12.0 |
12.1 |
||
BALANCE SHEET |
||||||||
Fixed Assets |
|
|
13,777 |
13,381 |
16,161 |
22,347 |
40,027 |
43,200 |
Intangible Assets |
1,801 |
1,736 |
3,364 |
3,204 |
3,044 |
2,884 |
||
Tangible Assets |
10,994 |
10,998 |
11,361 |
17,707 |
35,547 |
38,880 |
||
Investments |
982 |
647 |
1,436 |
1,436 |
1,436 |
1,436 |
||
Current Assets |
|
|
43,590 |
45,045 |
54,435 |
49,626 |
50,437 |
51,235 |
Stocks |
28,020 |
25,799 |
29,990 |
30,565 |
30,826 |
31,059 |
||
Debtors |
14,509 |
17,635 |
17,853 |
18,561 |
19,111 |
19,675 |
||
Cash |
629 |
1,477 |
6,588 |
500 |
500 |
500 |
||
Other |
432 |
134 |
4 |
0 |
0 |
0 |
||
Current Liabilities |
|
|
(16,005) |
(13,481) |
(16,388) |
(17,405) |
(26,337) |
(25,548) |
Creditors |
(12,729) |
(12,675) |
(15,834) |
(15,223) |
(15,832) |
(16,465) |
||
Short term borrowings |
(2,356) |
(567) |
(487) |
(2,182) |
(10,506) |
(9,083) |
||
Provisions |
(920) |
(239) |
(67) |
0 |
0 |
0 |
||
Long Term Liabilities |
|
|
(12,602) |
(11,760) |
(17,021) |
(10,403) |
(14,365) |
(13,453) |
Long term borrowings |
(7,857) |
(7,065) |
(7,755) |
(1,091) |
(5,253) |
(4,541) |
||
Other long term liabilities |
(4,745) |
(4,695) |
(9,266) |
(9,312) |
(9,112) |
(8,912) |
||
Net Assets |
|
|
28,760 |
33,185 |
37,187 |
44,165 |
49,762 |
55,434 |
CASH FLOW |
||||||||
Operating Cash Flow |
|
|
3,528 |
8,667 |
10,804 |
12,010 |
12,696 |
13,437 |
Net Interest |
(724) |
(740) |
(703) |
(559) |
(851) |
(1,291) |
||
Tax |
(1,552) |
(1,469) |
(2,022) |
(2,425) |
(2,502) |
(2,550) |
||
Capex |
(538) |
(924) |
(679) |
(7,887) |
(19,442) |
(5,000) |
||
Acquisitions/disposals |
(208) |
(103) |
(861) |
0 |
0 |
0 |
||
Financing |
105 |
147 |
280 |
0 |
0 |
0 |
||
Dividends |
(1,899) |
(1,978) |
(2,095) |
(2,257) |
(2,386) |
(2,462) |
||
Net Cash Flow |
(1,288) |
3,600 |
4,724 |
(1,118) |
(12,486) |
2,134 |
||
Opening net debt/(cash) |
|
|
8,294 |
9,584 |
6,155 |
1,654 |
2,773 |
15,259 |
HP finance leases initiated |
0 |
0 |
0 |
0 |
0 |
0 |
||
Other |
(2) |
(171) |
(223) |
(1) |
0 |
(0) |
||
Closing net debt/(cash) |
|
|
9,584 |
6,155 |
1,654 |
2,773 |
15,259 |
13,124 |
Source: Edison Investment Research, Company data
|
||||||||||||||||||||||||||||||||||||||||||||||
|
|