TRC provides a full range of freight forwarding services to a broad range of customers in Russia. Its customers span all major Russian industries but it has a particular exposure to chemicals, paper and pulp, autos, machine tools and timber. TRC offers truck delivery, rail handling capabilities and rail freight services via its fleet of rail flatcars. In recent years, it has increased the proportion of its business that provides all of these capabilities to its customers in the form of integrated freight forwarding. In FY11 this accounted for 30% of revenues, and this had expanded to 61.6% in FY15.
Valuation: Stellar growth at a very reasonable price
We view TRC’s FY17 EV/EBITDA (TRC own definition) of 6.2x as undervaluing the fundamentals of the company. It has maintained positive EBITDA and a low level of indebtedness throughout Russia’s economic downturn, which started in 2014. TRC is a cash flow-generative, conservatively managed, asset-backed transportation and logistics company, which comfortably leads the Russian market and is investing in upscaling its product offering. Our fair value per share of RUB3,400 implies 8.1% upside to the current market price and is based primarily on an peer comparison-derived EV/EBITDA multiple. We use 6.7x FY16 EBITDA to arrive at our fair value, well within an average of TRC’s international and domestic peers of 8.2x current year EV/EBITDA. Despite its superior cash generation and earnings growth relative to most transport peers, we use a discount to reflect economic headwinds in Russia.
Financials: Q116 challenging, more positive on outlook
Q1 results, published on 31 May 2016, communicated a continuation of the negative operating environment of recent years but offered some upbeat comments in the outlook:
■
Q116 EBITDA (TRC definition) fell by 19.4% year-on-year, including a nearly 4% drop in EBITDA margins. Underlying the negative year-on-year growth were volume contractions in domestic, import, export and transit end markets.
■
Management were keen to point out that, for the first time in six quarters, the Russian rail container market demonstrated positive year-on-year growth in April and May.
Sensitivities: Cash flow and valuation sensitivity to macro
Currently, TRC is suffering from both the negative volume effect and the increased country risk premium associated with the recession in Russia. As we describe in our discussion on the valuation, the WACC is the single biggest moving part in TRC’s valuation and it is currently at 13.0%, which is punitive. Other than this, the principal sensitivities are to the ruble, Russian GDP and Russian inflation.
Macro issues: TRC is particularly exposed to political risk, with the sanctions imposed by the West on Russia over Ukraine the most eminent. For this reason, we include a table showing our fair value’s sensitivity to changes in WACC and terminal growth rate (Exhibit 13).
Ownership changes: Initially, it seemed likely that RZD, the Russian Railway Operator, would ultimately sell down its 50%+2 stake in TRC; however, this has not happened. Recent Russian press reports (Kommersant, 17 June 2016) have suggested the possibility that Russian Railways (RZD/ UTLC) might sell its stake to Summa.
TransContainer: Dominant market position
Former state-owned firm that has invested in change
Privatised initially in 2006, part-listed in 2007 and still majority-owned by Russian railway operator RZD, TRC has transitioned from a rail container-based operation to an integrated, intermodal freight market leader in Russia. It owns almost all the assets it uses, from trucks, to flatcars, to rail terminals. Despite suffering in terms of earnings and market value during the downturn, TRC has maintained its strategy of growing along the value chain.
Formerly part of JSC Russian Railways (the Russian rail network operator), TransContainer (TRC) was established in 2006. Initially, 100% of its shares were owned by RZD. 15% of TRC’s equity was placed privately in 2007 and a further 35% of the stock was listed in 2010. This took JSC’s overall stake down to 50% plus two shares (50%+2). TRC is listed on both the Moscow and London stock exchanges. The company retains its market leadership position in Russia and has invested RUB24bn enhancing its fleet of flatcars, containers, trucks, rail-side terminals and IT in its 10 years as a standalone company.
Russian rail market: Cyclical, competitive with huge potential
Exhibit 1: Russian rail container volume growth
|
Exhibit 2: Rail container volume to GDP multiple
|

|

|
Source: Edison Investment Research, TransContainer data
|
Source: Edison Investment Research, TransContainer data
|
Exhibit 1: Russian rail container volume growth
|
|
Source: Edison Investment Research, TransContainer data
|
Exhibit 2: Rail container volume to GDP multiple
|
|
Source: Edison Investment Research, TransContainer data
|
Since management of the Russian rail network was taken over by RZD in 2003, several competitors have been attracted into the sector as a result of its high levels of growth. The 8.2% volume CAGR from 2001-15 (Exhibit 1) was driven by high levels of economic growth, growth in trade and an increasing level of ‘containerisation’ (the market share of rail container cargo as a percentage of ‘containerisable’ cargo).
Exhibit 3: Russian rail containerisation level
|

|
Source: Edison Investment Research, TransContainer data, AT Kearney
|
These market fundamentals drew in competitors to TRC’s core market – most notably Modul, FESCO and Fintrans although there are more than a hundred small flat car operators in the fragmented Russian market – and reduced TRC’s market share from 60% to 46% currently. TRC states that pricing within the market is still competitive given the high degree of competition.
While underlying growth is a key attraction of TRC, it has to be acknowledged that the rail freight market in Russia is very cyclical. In 2008 and again in 2014, container volumes dropped significantly, by as much as 25% in 2008-09. Therefore, sensible companies in the space must manage their balance sheet, cash flow and cost structures accordingly.
Exhibit 2 shows the multiple of railway container market growth year-on-year to GDP growth year-on-year. This further emphasises the cyclical nature of TRC’s market. Addressable volumes fluctuate by a multiple of Russian GDP ranging between two and six times. Since 2014, the Russian rail cargo market has contracted markedly. However, through the cycle, TRC has remained profitable, and generated positive cash flows.
Economic sanctions and oil have hit the market hard
Since economic sanctions were first introduced on Russia in response to events in Ukraine in 2014, rail container volumes in transit, import and export have declined by 7.6%, 26.5% and 7.8%, respectively. These three types of route, taken together, accounted for 44.5% of TRC’s FY15 transportation volumes. Until there is a thawing of relations between Russia and the West, it is very unlikely that import, export and transit volumes will return to their 2013 peaks.
Market leader in a weak market
TRC is the dominant intermodal freight transport and logistics company in Russia. With a market share of 46% in rail container transportation, TRC is number one in Russia in terms of volume of rail transportation, size of flatcar fleet and volume of rail-side container handling. TRC’s assets are spread across Russia and it also has a presence in Europe and Asia.
Exhibit 4: Russian rail container market volume split
|

|
Source: Edison Investment Research, TransContainer data, RZD Information Centre
|
TRC’s revenues contracted by 20% between FY13 and FY15 as economic sanctions and the oil price decline lead to recession in Russia (Exhibit 4). During 2015, the overall Russian rail-container market contracted by 8%. Within this, domestic volumes were flat year-on-year, while imports declined by 18.5%, exports declined 12.6% and transit dropped by 13.6%. While TRC has a market share of 46%, it does have a slight skew to domestic markets (55% of TRC volumes versus 50% of total market split), which cushioned the negative impact of the heavy import and export losses. This explains why TRC’s sequential revenue loss was smaller than that of the overall market. Since 2008, TRC’s EBITDA (TRC definition) margin has ranged from 26.2% to 40.3%, with an average through the cycle of 35.7%.
Some evidence of a recovery, but early days
At Q116, management highlighted that in April and May the “Russian rail container market demonstrated a positive year-on-year dynamics (sic) for the first time following six consecutive quarters of year-on-year decline”. RZD data confirm this by showing that rail container transportation volumes increased year-on-year in April by 10.5%. While this would seem consistent with Russian economic leverage to the oil price, which has increased in recent months, we are more cautious and need to see sustained evidence of a recovery before updating our short-term forecasts. We do factor in volume growth this year and in coming years, but we do not forecast a return to the previous EBITDA (TRC definition) peak until FY19.
Taking advantage of strong Chinese-European trade
Bucking the trends seen elsewhere in TRC’s operations, year-on-year rail transit volumes between China and Europe in 2015 grew by 83%. TRC has deliberately made itself the most likely beneficiary of this trend. It has a stake in key cross-border rail terminals in Dostyk, on China’s north-western border, and Zabaikalsk, on China’s north-eastern frontier. These two terminals between them accounted for 92% of total Chinese-European rail freight volumes in 2015, allowing TRC to achieve dominance of the market. TRC believes that, on cost terms, rail is the most efficient means of transporting goods by land over long distances such as from China to Europe; according to its own data, this cost advantage is true for distances over 2,000km. This ‘transit’ market still only accounts for 6% of TRC’s volumes, but accounts for some of its larger customers (shown in Exhibit 5), such as UNICO, a Korean manufacturer.
Diverse range of end-customers and industries
Significant end-markets to which TRC is exposed include chemicals (17%), pulp and paper (13%), timber (10%) and food, auto and non-ferrous metals (7% each). It is noteworthy that, at group level, it has little direct exposure to the oil and gas or natural resources sectors, unlike its close peer Globaltrans. The cyclical nature of some of TRC’s customer base (eg chemicals, autos, pulp and paper, metals and machinery, which together account for 56% of FY15 adjusted revenues) goes some way to explaining TRC’s revenue decline in FY14 and FY15.
Exhibit 5: 2015 customer split (% revenues)
|
Exhibit 6: 2015 end-market exposure (% revenues)
|

|

|
Source: Edison Investment Research, TransContainer data
|
Source: Edison Investment Research, TransContainer data
|
Exhibit 5: 2015 customer split (% revenues)
|
|
Source: Edison Investment Research, TransContainer data
|
Exhibit 6: 2015 end-market exposure (% revenues)
|
|
Source: Edison Investment Research, TransContainer data
|
Macro-factors likely to delay 2020 objectives
TRC’s 2020 targets, originally communicated in 2013, were as follows:
■
To be the largest player in the Russian rail container transportation market.
■
Rail container traffic to reach 2.7m TEU and fleet to reach 42,000 cars.
■
50% share of 80-foot flatcars in the total fleet capacity, lower empty run ratio, better car fleet turnover.
■
Integrated logistics and freight-forwarding services to generate more than 50% of sales.
The subsequent downturn points to likely slippage in the targets. However, we should point out that the company is making good progress towards its efficiency goals.
Resilience, cost management, balance sheet control
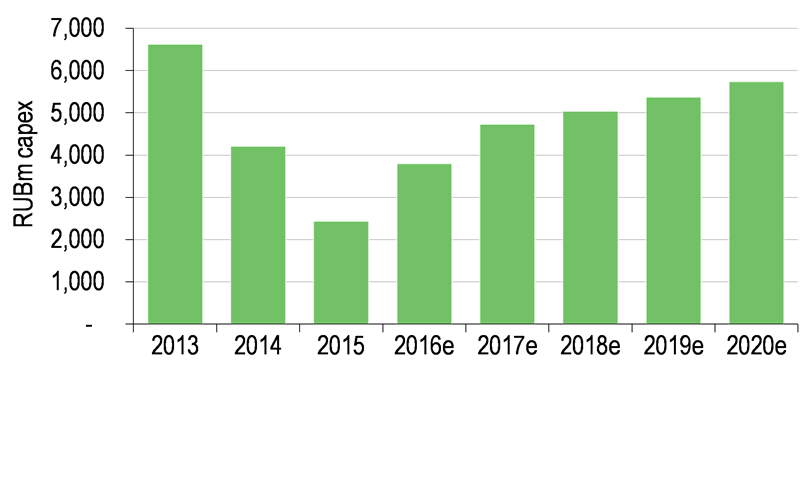
The nature of TRCs business, whereby capital outlays can easily be scaled back or deferred, means it can be extremely responsive with its investment programme, adjusting it to match market conditions. For instance, TRC demonstrated flexibility when it reduced headcount, maintained a conservative balance sheet and cut capital investment during FY14 and FY15. The ability to insulate itself against cyclical downturns, we believe, is a key attraction of the stock: despite its cyclical nature, it is able to be flexible and cut spending and investment in order to retain a focus on cash generation during downturns. We believe this reflects the several economic cycles navigated by TRC management and their combined expertise in Russian rail freight.
Exhibit 7: Volatile returns profile
|
Exhibit 8: Capex flexibility
|

|
|
Source: Edison Investment Research, TransContainer data
|
Source: Edison Investment Research, TransContainer data
|
Exhibit 7: Volatile returns profile
|
|
Source: Edison Investment Research, TransContainer data
|
Exhibit 8: Capex flexibility
|
|
Source: Edison Investment Research, TransContainer data
|
TRC has pursued a shift in revenues to integrated freight forwarding from each of the other itemised services. As TRC grows its end-to-end business, so it can consolidate its market leadership position and, importantly, look to earn superior returns due to a combination of scale through vertical integration and by increasing its value-add offering to clients. The shift to integrated revenues is shown in Exhibit 9.
Exhibit 9: Dominating the value chain
|

|
Source: Edison Investment Research, TransContainer data
|
Note: the data beneath is ‘adjusted revenue’, which deducts third-party revenues. As TRC has grown its capabilities, third-party revenues have increased but are a straight pass through.
Exhibit 10: TRC activities across the Russian freight value chain
|

|
Source: Edison Investment Research, TransContainer data
|
Leveraging scale to dominate the value chain
TRC has an unrivalled asset base in Russia, with 24,461 flatcars, 64,596 ISO containers, 66 rail-side terminals and 220 trucks and semi-trailers. Given the scale of its operating assets and its experienced senior management, TRC has successfully moved its business to a predominantly integrated freight forwarding and logistics model over recent years. This ability to provide end-to-end freight services for its customer base rather than focusing on specific individual parts of the value chain, such as truck deliveries, is a more scalable and profitable business model. In FY15, its integrated freight forwarding and logistics unit contributed 61.6% of revenues versus 29.6% in FY11.
Investment in customer experience
Client focus is a key part of the offering. TRC’s client presentation shows that each customer gets a dedicated account manager who will work with the client to understand their specific requirements as regards customs clearance, storage and route optimisation. The e-Shop allows customers to get quotes and make and track orders from, for example, China to Poland. It is a good example of investments made and management focus on enhancing TRC’s customer offering.
In FY15, TRC transported a total of 1,390,000 TEUs (twenty foot equivalent units). It is notable that of this, only 1,031,000 TEUs were ‘profitable’. In other words, the difference was ‘empty runs’ or legs of journeys for which no freight is shipped. The ‘empty-run ratio’ has increased in recent years as trade sanctions means there are fewer imports and exports to Russia. This has put downward pressure on TRC’s margins in recent years. The company hopes to get empty-run ratios back to around 27%, from their current rate of 29.3% (Q116).
TRC Chairman Ivan Besedin, a graduate of the Moscow Institute of Railway Transport Engineers, was head of the Central Kaliningrad Railway from 2006 to 2011. From 2011 to 2014, he was head of the Moscow Metro system. As well as being chairman of the board, Mr Besedin also has a role at TRC’s parent, JSC Russian Railways, where he is head of the Department of Transport and Logistics Business Block Management.
Chief Executive Petr Baskakov and his team have managed the business over the last decade. Mr Baskakov, in common with several other directors, has had a long career in the Russian rail industry. His 24 years in industry started after graduating from the Moscow Institute for Railway Transport Engineers in 1986 with a degree in the Management of railway transportation processes. Also on the executive board, Vladimir Drachev graduated from Krasnoyarsk Technical School for Rail Transport in 1970. Many other board members have either rail-specific training and experience or engineering backgrounds, which, given the complexities of the Russian rail market, are essential.
That said, the executive board has some experience from more general commercial backgrounds. Deputy Director and CFO Anton Lopatin previously worked for Protek, a Russian pharmaceutical company from 2000-06, after completing an MBA at INSEAD. At the 27 June AGM, several director changes were announced. We view this as a continuation of management focus on enhancing operational efficiency and expect more news on the appointments later in the year.
TransContainer’s discount to global peers should narrow
Our preferred valuation methodology is EV/EBITDA multiple. We read across to TRC’s domestic and international peers and ascribe a discount to their average EV/EBITDA to reflect country risk within Russia. EV/EBITDA is preferable to price-to-earnings ratio as EV explicitly takes capital structure into account, which is important in capital intense industries such as transport. For the purposes of our valuation, we use TRC’s EBITDA definition (PBT + interest expense + depreciation and amortisation).
We compare a wide range of TRC’s peers in the global transportation sector in order to arrive at sector multiples (Exhibit 12). This overcomes comparing specific stocks, which may vary from TRC meaningfully. For instance Globaltrans, another listed Russian rail transportation firm, has a prospective EV/EBITDA of 1x. While Edison does not cover this stock, we acknowledge that Globaltrans has a high degree of revenue exposure to the energy and mining sectors, which were significantly and negatively affected by the global commodities sell-off from 2014 onwards. Therefore there is little direct read-across, but we include Globaltrans in our valuation table for as complete a picture as possible.
Exhibit 12: Transport comparative valuation sheet
|
|
|
Market Cap (local m) |
Current EV/ EBITDA |
Next EV/ EBITDA |
Current P/E |
Next P/E |
FCF Yield |
Div Yield This Yr |
Moscow Exchange MICEX-RTS PJSC |
|
|
255,731 |
|
|
10.2x |
11.0x |
-7.24% |
6.3% |
|
|
|
|
|
|
|
|
|
|
European Transport |
|
|
|
|
|
|
|
|
|
TransContainer PJSC |
|
RUSSIA |
43,699 |
7.0x |
5.6x |
11.8x |
10.4x |
4.37% |
2.1% |
Globaltrans Investment PLC |
|
CYPRUS |
724 |
1.1x |
1.0x |
0.2x |
0.2x |
21.34% |
3.7% |
PKP Cargo SA |
|
POLAND |
1,404 |
3.1x |
2.7x |
13.3x |
8.3x |
-9.74% |
7.6% |
VTG AG |
|
GERMANY |
730 |
6.8x |
6.5x |
16.2x |
12.5x |
0.11% |
2.5% |
Average |
|
|
|
4.5x |
4.0x |
10.4x |
7.8x |
4.02% |
3.97% |
|
|
|
|
|
|
|
|
|
|
Emerging Markets Transport |
|
|
|
|
|
|
|
|
|
China Railway Tielong Container Logistics Co Ltd |
|
CHINA |
9,021 |
16.7x |
17.5x |
31.8x |
29.7x |
0.16% |
0.9% |
Daqin Railway Co Ltd |
|
CHINA |
90,539 |
5.9x |
6.3x |
10.3x |
10.3x |
7.64% |
5.1% |
Guangshen Railway Co Ltd |
|
CHINA |
22,665 |
6.6x |
6.1x |
23.3x |
20.6x |
3.44% |
2.0% |
Average |
|
|
|
9.7x |
10.0x |
21.8x |
20.2x |
3.75% |
2.67% |
|
|
|
|
|
|
|
|
|
|
Developed Market Transport |
|
|
|
|
|
|
|
|
|
Canadian Pacific Railway Ltd |
|
CANADA |
25,626 |
10.2x |
9.6x |
16.3x |
14.3x |
2.17% |
1.1% |
Kansas City Southern |
|
UNITED STATES |
9,563 |
10.5x |
9.6x |
19.3x |
17.1x |
1.86% |
1.5% |
Union Pacific Corp |
|
UNITED STATES |
74,155 |
9.2x |
8.6x |
17.3x |
15.4x |
4.27% |
2.6% |
Norfolk Southern Corp |
|
UNITED STATES |
25,099 |
8.3x |
7.8x |
15.3x |
13.9x |
2.99% |
2.8% |
Canadian National Railway Co |
|
CANADA |
59,570 |
10.8x |
10.2x |
17.3x |
15.8x |
4.11% |
2.0% |
Genesee & Wyoming Inc |
|
UNITED STATES |
3,425 |
9.8x |
9.2x |
16.8x |
15.7x |
4.39% |
0.0% |
CSX Corp |
|
UNITED STATES |
25,025 |
7.7x |
7.3x |
15.0x |
13.6x |
4.10% |
2.8% |
Aurizon Holdings Ltd |
|
AUSTRALIA |
10,054 |
9.5x |
8.3x |
20.4x |
17.9x |
3.24% |
4.9% |
Average |
|
|
|
9.5x |
8.8x |
17.2x |
15.5x |
3.39% |
2.21% |
|
|
|
|
|
|
|
|
|
|
Overall Transport Average |
|
|
|
8.2x |
7.8x |
16.3x |
14.4x |
3.63% |
2.77% |
Source: Bloomberg, Edison Investment Research. Priced at 7 July 2016
We derive our fair value of RUB3,400 per share by using an EV/EBITDA (TRC definition) multiple of 6.7x for the current year. This compares to a group of international peers (Exhibit 12), which trade on an average of 8.2x current year EBITDA. We apply a 1.5x EBITDA discount to international peers (from 8.2x to 6.7x EV/EBITDA – TRC definition) as this, we believe, risk adjusts our fair value to reflect country risk in Russia. Given macroeconomic and geopolitical uncertainty in Russia, plus TRC’s cyclical nature, we believe the stock merits a discount to its peers, but not as much as current market multiples imply. The average prospective (or +1yr) EV/EBITDA and price-to-earnings multiples of international transport stocks are 7.8x and 14.4x, respectively. This compares to 6.2x and 9.6x for TRC – based on our own EBITDA and EPS forecasts.
Exhibit 13: EBITDA multiple sensitivity based on FY16 Edison EBITDA est (TRC definition)
|
|
|
|
EBITDA multiple |
|
|
|
|
Current Px |
Target Px |
|
|
|
|
5.0x |
6.0x |
6.7x |
7.0x |
8.0x |
Edison FY16 EBITDA (RUBm) |
7,599 |
7,599 |
7,599 |
7,599 |
7,599 |
Value per share (RUB) |
2,451 |
2,950 |
3,283 |
3,561 |
4,116 |
Upside/ (downside) % |
-22% |
-4% |
8% |
13% |
31% |
Source: Edison Investment Research, TransContainer data. Note: Based on TRC share price of RUB3,145 (7 July 2016).
WACC leads to low DCF valuation
We have also tested a DCF valuation, but note that this is penalised by the high cost of capital in Russia currently. Macro factors well beyond the control of TRC mean its WACC is currently at a very high level. We calculate a WACC of 13.3% based on a risk-free rate of 4.0%, a post-tax cost of debt of 7.9%, a beta of 1.0 and an equity risk premium of 9.6%. Reversing the DCF, this is well above the 10.6% WACC we believe the market is using to value TRC. The debt weighting is 9.8% and equity is 90.2%. TRC is very sensitive to its WACC and economic normalisation could well decrease its WACC rapidly. Currently, however, the fact that Russian 10-year Eurobonds are yielding 4-5%, TRC’s debt is trading at 8.5% and its income statement interest charge is 8.5% all suggest that our WACC of 13.0% is appropriate.
We highlight TRC’s superior level of cash generation and potential for earnings growth as key drivers of value and believe that when the Russian economy rebounds, shareholders will see not only improved cash flows but a stock re-rating as the country risk premium and cost of debt normalise and TRC’s WACC decreases. In the meantime, TRC’s pre-tax ROCE, which peaked at 9.8% in FY13 and dipped to 4.3% in FY15, is well below its WACC of 13%. We forecast ROCE to rebound to 6.9% by 2020, with capital employed increasing at a high pace due to the company’s capex programme. Once again, we highlight that any improvement in Russia’s macroeconomic and geopolitical situation will lower the WACC and therefore can return the company to economic profitability. Meanwhile, the unwinding of the current discount applied by the market should better reflect, in our view, the sustained positive cash flow, high interest cover and payout ratio.
TRC’s overall earnings prospects are sensitive to economic activity in Russia and its nearest neighbours. They are complicated by current economic sanctions, political considerations and volatility in the price of oil and the other extractives that drive the Russian economy. However, profitability, while cyclical, has been partly mitigated by management’s focus on cash flows, leading to a flexible control of cash outlays, responsive to cyclical moves. In the event of a recovery in the Russian economy and consequent uplift in Russian rail container volumes, TRC will produce meaningful free cash.
Exhibit 14: EBITDA (rub) evolution (TRC definition)
Adjusted Revenue and Profitability Analysis |
2013 |
2014 |
2015 |
2016e |
2017e |
2018e |
Commentary |
Integrated Freight Forwarding and Logistics Services |
10,437 |
11,352 |
12,518 |
13,832 |
15,492 |
16,887 |
Increased containerisation, diversion of volumes from other units continue to drive growth |
% y-o-y |
|
8.8% |
10.3% |
10.5% |
12.0% |
9.0% |
Rail-based Container Shipping Services |
8,154 |
5,405 |
4,390 |
4,522 |
4,612 |
4,704 |
Recovery in volumes, increase in containerisation, offset by diversion to Integrated FF&L |
% y-o-y |
|
-33.7% |
-18.8% |
3.0% |
2.0% |
2.0% |
Terminal Services and Agency Fees |
4,181 |
2,167 |
2,130 |
2,194 |
2,238 |
2,271 |
Recovery in volumes, increase in containerisation, offset by diversion to Integrated FF&L |
% y-o-y |
|
-48.2% |
-1.7% |
3.0% |
2.0% |
1.5% |
Truck Deliveries |
1,367 |
978 |
848 |
873 |
891 |
909 |
Recovery in volumes, increase in containerisation, offset by diversion to Integrated FF&L |
% y-o-y |
|
-28.5% |
-13.3% |
3.0% |
2.0% |
2.0% |
Other Freight Forwarding Services |
571 |
283 |
134 |
135 |
136 |
139 |
|
% y-o-y |
|
-50.4% |
-52.7% |
0.5% |
1.0% |
2.0% |
Bonded Warehousing Services |
317 |
234 |
194 |
195 |
197 |
201 |
|
% y-o-y |
|
-26.2% |
-17.1% |
0.5% |
1.0% |
2.0% |
Other |
301 |
119 |
97 |
97 |
98 |
100 |
|
% y-o-y |
|
-60.5% |
-18.5% |
0.5% |
1.0% |
2.0% |
Total Adjusted Revenue |
25,328 |
20,538 |
20,311 |
21,849 |
23,664 |
25,211 |
Contractions in FY14 and FY15 due to political and macroeconomic factors will reverse in FY16 |
% y-o-y |
|
-18.9% |
-1.1% |
7.6% |
8.3% |
6.5% |
EBITDA (TRC Definition: PBT + int expense + D&A) |
10,074 |
7,816 |
6,526 |
7,599 |
8,771 |
9,533 |
Returning volumes will help margins recover. Empty run ratio improvement will benefit too |
% margin |
39.8% |
38.1% |
32.1% |
34.8% |
37.1% |
37.8% |
Source: TransContainer, Edison Investment Research
During FY14, TRC’s revenues dropped by almost 20%. Between FY13 and FY15, EBITDA margins contracted from 40% to 32% (based on their own definition of adjusted EBITDA margin: PBT + interest expense + D&A). While maintaining such high margins is admirable during a severe economic shock, it is clear TRC’s operating cash flow is cyclical.
Furthermore TRC has little visibility of future earnings. Smaller customers operate on a spot-basis and larger entities have terms that offer TRC six-month visibility. The one-month-ahead view to which management guides effectively means the company partly operates in a spot market. Aware of this uncertainty, TRC has adjusted its operations, capex plans and financial leverage to insulate the business in economic contractions.
Even at its trough in (company-adjusted) EBITDA margin of 32%, TRC was able to generate positive net income. Its net interest charge of RUB356m was covered over 10 times by EBIT. Its Kazakh associate KDTS contributed RUB612m of income.
We note that TRC’s 27 June AGM did not approve the FY15 DPS. The company guides to a 25% payout as a ‘benchmark’ rather than a firm dividend policy. We believe that shareholders will get a second chance to vote on the dividend payout on the EGM which has been scheduled for 7 September 2016. For the purposes of our model we have assumed a 25% payout.
Strong cash flow generation and 25% payout
Although depressed in FY14/FY15, TRC’s post-working capital operating cash flow in this period at no point declined beneath RUB5bn. While TRC must plough capex into its transport fleet – this year’s capex is expected to be RUB3,800m – it is important to note that the Russian rail network, RZD, is responsible for maintaining the tracks and other infrastructure. Therefore, TRC can scale back capex very easily and quickly (as it did in FY15). This has enabled the company to continue to pay out 25% of earnings to shareholders in recent years, despite the 20% drop in revenues. It is noteworthy that is has maintained its payout ratio and invested significant capex while being only marginally net cash negative for FY14 and FY15. We forecast TRC’s price to cash flow yield will be a healthy 6.1x this year.
FY16 capex is forecast to be RUB3.8bn. RUB1bn will be invested in terminals, RUB1.3bn is to be invested in containers, RUB0.4bn will be invested in new flatcars and RUB1bn will go on ‘other capex’. As an example of how flexible its capex programme is, TRC’s average flatcar age is 15 years. Flatcars have an expected useful life of 30 years so therefore a couple of years of delayed capex will not negatively affect capacity.
Exhibit 15: Debt maturity profile
|
Exhibit 16: Declining debt, increasing maturity
|

|

|
Source: Edison Investment Research, TransContainer data
|
Source: Edison Investment Research, TransContainer data
|
Exhibit 15: Debt maturity profile
|
|
Source: Edison Investment Research, TransContainer data
|
Exhibit 16: Declining debt, increasing maturity
|
|
Source: Edison Investment Research, TransContainer data
|
AT FY15, TRC was conservatively leveraged with a net debt to EBITDA (own definition) multiple of 0.86x. We anticipate this will fall in FY16 and thereafter. Currently, the company is guiding to long-term capex of between 20-30% of sales (Edison forecasts 20%), but capex will only run at this level provided there is volume growth. As explained in the cash flow section, the relatively low age of its flatcar fleet gives TRC flexibility to reduce its capex programme and increase its free cash flow if required. Debt to EV is only 10%, giving the company a further buffer against any future economic deterioration. Despite gradually increasing debt levels, TRC will not be financially stretched at any point. We forecast net debt to EBITDA (TRC definition) to decline from FY15’s multiple of 0.86x to 0.51x in FY20. Meanwhile interest cover will increase from 9.2x to 14.8x over the same period.
Therefore, TRC will have to consider whether it maintains its 25% payout ratio or looks for other ways to deploy capital. Also of note is that all TRC’s debt is ruble-denominated. Therefore, it has no balance sheet exposure to the significant devaluations the ruble has experienced in recent years.
Exhibit 17: Financial summary
|
|
RUBm |
2014 |
2015 |
2016e |
2017e |
2018e |
2019e |
2020e |
31-December |
|
|
IFRS |
IFRS |
IFRS |
IFRS |
IFRS |
IFRS |
IFRS |
PROFIT & LOSS |
|
|
|
|
|
|
|
|
|
Revenue |
|
|
20,538 |
20,311 |
21,849 |
23,664 |
25,211 |
26,890 |
28,710 |
EBITDA (company definition) |
|
|
7,816 |
6,526 |
7,599 |
8,771 |
9,533 |
10,294 |
11,125 |
EBITDA (Edison definition) |
|
|
6,544 |
5,744 |
6,778 |
7,826 |
8,492 |
9,149 |
9,861 |
Operating Profit (before amort. and except.) |
4,083 |
3,274 |
4,269 |
5,231 |
5,739 |
6,226 |
6,756 |
Intangible Amortisation |
|
|
0 |
0 |
0 |
0 |
0 |
0 |
0 |
Exceptionals |
|
|
0 |
0 |
0 |
0 |
0 |
0 |
0 |
Other |
|
|
0 |
0 |
0 |
0 |
0 |
0 |
0 |
Operating Profit |
|
|
4,083 |
3,274 |
4,269 |
5,231 |
5,739 |
6,226 |
6,756 |
Net Interest |
|
|
(497) |
(356) |
(360) |
(303) |
(282) |
(258) |
(229) |
Share of assocs/jvs gains/(losses) |
|
|
165 |
612 |
673 |
741 |
815 |
896 |
986 |
Forex gains/(losses) |
|
|
938 |
0 |
0 |
0 |
0 |
0 |
0 |
Other |
|
|
18 |
18 |
0 |
0 |
0 |
0 |
0 |
Profit Before Tax (norm) |
|
|
3,751 |
3,530 |
4,582 |
5,669 |
6,272 |
6,864 |
7,514 |
Profit Before Tax (FRS 3) |
|
|
4,707 |
3,548 |
4,582 |
5,669 |
6,272 |
6,864 |
7,514 |
Tax |
|
|
(1,049) |
(717) |
(962) |
(1,190) |
(1,317) |
(1,442) |
(1,578) |
Profit After Tax (norm) |
|
|
2,702 |
2,813 |
3,620 |
4,478 |
4,955 |
5,423 |
5,936 |
Profit After Tax (FRS 3) |
|
|
3,658 |
2,831 |
3,620 |
4,478 |
4,955 |
5,423 |
5,936 |
|
|
|
|
|
|
|
|
|
|
Average Number of Shares Outstanding (m) |
|
13.7 |
13.7 |
13.7 |
13.7 |
13.7 |
13.7 |
13.7 |
EPS - normalised (RUB) |
|
|
286.0 |
138.7 |
264.4 |
327.0 |
361.8 |
396.0 |
433.5 |
EPS - normalised and fully diluted (RUB) |
|
286.0 |
138.7 |
264.4 |
327.0 |
361.8 |
396.0 |
433.5 |
EPS - (IFRS) (RUB) |
|
|
267.1 |
206.7 |
264.4 |
327.0 |
361.8 |
396.0 |
433.5 |
Dividend per share (RUB) |
|
|
71.0 |
51.7 |
66.1 |
81.8 |
90.5 |
99.0 |
108.4 |
|
|
|
|
|
|
|
|
|
|
EBITDA Margin (%) |
|
|
31.9 |
28.3 |
31.0 |
33.1 |
33.7 |
34.0 |
34.3 |
Operating Margin (before GW and except.) (%) |
|
19.9 |
16.1 |
19.5 |
22.1 |
22.8 |
23.2 |
23.5 |
|
|
|
|
|
|
|
|
|
|
BALANCE SHEET |
|
|
|
|
|
|
|
|
|
Fixed Assets |
|
|
42,012 |
41,739 |
43,030 |
45,404 |
47,945 |
50,669 |
53,594 |
Intangible Assets |
|
|
210 |
246 |
246 |
246 |
246 |
246 |
246 |
Tangible Assets |
|
|
37,900 |
37,827 |
39,118 |
41,492 |
44,033 |
46,757 |
49,682 |
Investments |
|
|
3,343 |
3,023 |
3,023 |
3,023 |
3,023 |
3,023 |
3,023 |
Other |
|
|
559 |
643 |
643 |
643 |
643 |
643 |
643 |
Current Assets |
|
|
6,965 |
7,435 |
8,498 |
9,115 |
9,789 |
10,580 |
11,493 |
Stocks |
|
|
340 |
315 |
339 |
367 |
391 |
417 |
445 |
Debtors |
|
|
1,542 |
1,392 |
1,497 |
1,622 |
1,728 |
1,843 |
1,968 |
Cash |
|
|
1,904 |
2,110 |
2,925 |
3,225 |
3,568 |
3,982 |
4,491 |
Other |
|
|
3,179 |
3,618 |
3,737 |
3,902 |
4,102 |
4,337 |
4,590 |
Current Liabilities |
|
|
(5,581) |
(6,747) |
(6,862) |
(7,021) |
(7,215) |
(7,441) |
(7,685) |
Creditors |
|
|
(3,084) |
(3,405) |
(3,520) |
(3,679) |
(3,873) |
(4,099) |
(4,343) |
Short term borrowings |
|
|
(919) |
(1,893) |
(1,893) |
(1,893) |
(1,893) |
(1,893) |
(1,893) |
Other |
|
|
(1,578) |
(1,449) |
(1,449) |
(1,449) |
(1,449) |
(1,449) |
(1,449) |
Long Term Liabilities |
|
|
(8,151) |
(6,240) |
(6,240) |
(6,240) |
(6,240) |
(6,240) |
(6,240) |
Long term borrowings |
|
|
(5,458) |
(3,744) |
(3,744) |
(3,744) |
(3,744) |
(3,744) |
(3,744) |
Other long term liabilities |
|
|
(2,693) |
(2,496) |
(2,496) |
(2,496) |
(2,496) |
(2,496) |
(2,496) |
Net Assets |
|
|
62,709 |
62,161 |
64,630 |
67,780 |
71,189 |
74,930 |
79,013 |
|
|
|
|
|
|
|
|
|
|
CASH FLOW |
|
|
|
|
|
|
|
|
|
Operating Cash Flow |
|
|
7,617 |
5,437 |
6,644 |
7,668 |
8,355 |
8,999 |
9,699 |
Net Interest |
|
|
(557) |
(394) |
(360) |
(303) |
(282) |
(258) |
(229) |
Tax |
|
|
(964) |
(727) |
(962) |
(1,190) |
(1,317) |
(1,442) |
(1,578) |
Capex |
|
|
(4,136) |
(2,400) |
(3,800) |
(4,970) |
(5,294) |
(5,647) |
(6,029) |
Acquisitions/disposals |
|
|
(75) |
(12) |
0 |
0 |
0 |
0 |
0 |
Financing |
|
|
199 |
0 |
0 |
0 |
0 |
0 |
0 |
Dividends |
|
|
(1,117) |
(974) |
(708) |
(905) |
(1,120) |
(1,239) |
(1,356) |
Other |
|
|
199 |
0 |
0 |
0 |
0 |
0 |
0 |
Net Cash Flow |
|
|
967 |
930 |
815 |
300 |
343 |
415 |
508 |
Opening net debt/(cash) |
|
|
6,004 |
4,473 |
3,527 |
2,712 |
2,412 |
2,069 |
1,655 |
HP finance leases initiated |
|
|
0 |
0 |
0 |
0 |
0 |
0 |
0 |
Other |
|
|
564 |
16 |
0 |
0 |
0 |
0 |
0 |
Closing net debt/(cash) |
|
|
4,473 |
3,527 |
2,712 |
2,412 |
2,069 |
1,655 |
1,146 |
Source: Edison Investment Research, TransContainer data
Contact details |
Revenue by geography |
Oruzheyniy Pereulok 19 Moscow, Russian Federation 125047 www.trcont.ru/ +7 495 788 17 17 |
N/A |
Contact details |
Oruzheyniy Pereulok 19 Moscow, Russian Federation 125047 www.trcont.ru/ +7 495 788 17 17 |
Revenue by geography |
N/A |
Management team |
|
Chairman of the Board of Directors: Ivan Besedin |
Chief Executive: Petr Baskakov |
A graduate of the Moscow Institute of Railway Transport Engineers, Mr Besedin was Head of the Central Kaliningrad Railway from 2006 to 2011. From 2011 to 2014, he was Head of the Moscow Metro system. As well as being Chairman of the Board, Mr Besedin also has a role at TRC’s parent, JSC Russian Railways, where he is Head of the Department of Transport and Logistics business Block Management. |
CEO since 2006, Mr Baskakov has over 24 years of experience in Russian railways. He is a graduate of the Moscow Institute of Railway Transport Engineers with a degree in the management of railway transportation processes. Prior to joining TRC, Mr Baskakov worked at Podolsk Production and Railway Transportation Enterprise and, from 1993, he was head of Moskva-Tovarnaya-Kurskaya station, a Moscow rail-side cargo terminal. |
First Deputy CEO: Vladimir Drachev |
Deputy General Director, CFO: Anton Lopatin |
With 24 years in the Russian railway sector starting with qualifying at Krasnoyarsk Technical School for Rail Transport in 1970 and the Irkutsk Institute of Railway Engineers in 1982, majoring in railways operations, Mr Drachev brings relevant experience to TRC. He has held roles at East-Siberian and Krasnoyarsk Railroads and in 1997 became the deputy head of the Department of Management of the Ministry of Railways. In 2002, Mr Drachev was appointed as the head of the Department of Transportation Management of the Ministry of Transportation, and from 2005 until 2006 he served as the first deputy head of Sverdlovsk Railway. |
Anton Lopatin has been deputy CEO for economics and finance since 2008. He graduated from the State University of New York in 2000 with a degree in economics, and in 2008, he received an MBA degree from INSEAD Business School. Between 2000 and 2006, Mr Lopatin worked at Protek, a pharmaceutical company holding roles including CFO. |
Management team |
Chairman of the Board of Directors: Ivan Besedin |
A graduate of the Moscow Institute of Railway Transport Engineers, Mr Besedin was Head of the Central Kaliningrad Railway from 2006 to 2011. From 2011 to 2014, he was Head of the Moscow Metro system. As well as being Chairman of the Board, Mr Besedin also has a role at TRC’s parent, JSC Russian Railways, where he is Head of the Department of Transport and Logistics business Block Management. |
Chief Executive: Petr Baskakov |
CEO since 2006, Mr Baskakov has over 24 years of experience in Russian railways. He is a graduate of the Moscow Institute of Railway Transport Engineers with a degree in the management of railway transportation processes. Prior to joining TRC, Mr Baskakov worked at Podolsk Production and Railway Transportation Enterprise and, from 1993, he was head of Moskva-Tovarnaya-Kurskaya station, a Moscow rail-side cargo terminal. |
First Deputy CEO: Vladimir Drachev |
With 24 years in the Russian railway sector starting with qualifying at Krasnoyarsk Technical School for Rail Transport in 1970 and the Irkutsk Institute of Railway Engineers in 1982, majoring in railways operations, Mr Drachev brings relevant experience to TRC. He has held roles at East-Siberian and Krasnoyarsk Railroads and in 1997 became the deputy head of the Department of Management of the Ministry of Railways. In 2002, Mr Drachev was appointed as the head of the Department of Transportation Management of the Ministry of Transportation, and from 2005 until 2006 he served as the first deputy head of Sverdlovsk Railway. |
Deputy General Director, CFO: Anton Lopatin |
Anton Lopatin has been deputy CEO for economics and finance since 2008. He graduated from the State University of New York in 2000 with a degree in economics, and in 2008, he received an MBA degree from INSEAD Business School. Between 2000 and 2006, Mr Lopatin worked at Protek, a pharmaceutical company holding roles including CFO. |
Principal shareholders |
(%) |
UTLC |
50.0% |
FESCO |
24.12% |
TransFinGroup |
8.45% |
|
|
|
Companies named in this report |
Globaltrans (GLTR LSE), PKP Cargo SA (PKP WSE), VTG AG (VTG ASX), China Railway Tielong Container Logistics Co Ltd (0390 HKG), Daqin Railway Co Ltd (601006 SHA), Guangshen Railway Co Ltd (GSH NYSE), Canadian Pacific Railway Ltd (CP TSE), Kansas City Southern (KSU NYSE), Union Pacific Corp (UNP NYSE), Norfolk Southern Corp (NSC NYSE), Canadian National Railway Co (CNR TSE), Genesee & Wyoming Inc (GWR NYSE), CSX Corp (CSQ NASDAQ), Aurizon Holdings Ltd (AJZ ASX) |
|
Edison, the investment intelligence firm, is the future of investor interaction with corporates. Our team of over 100 analysts and investment professionals work with leading companies, fund managers and investment banks worldwide to support their capital markets activity. We provide services to more than 400 retained corporate and investor clients from our offices in London, New York, Frankfurt, Sydney and Wellington. Edison is authorised and regulated by the Financial Conduct Authority. Edison Investment Research (NZ) Limited (Edison NZ) is the New Zealand subsidiary of Edison. Edison NZ is registered on the New Zealand Financial Service Providers Register (FSP number 247505) and is registered to provide wholesale and/or generic financial adviser services only. Edison Investment Research Inc (Edison US) is the US subsidiary of Edison and is regulated by the Securities and Exchange Commission. Edison Investment Research Limited (Edison Aus) [46085869] is the Australian subsidiary of Edison and is not regulated by the Australian Securities and Investment Commission. Edison Germany is a branch entity of Edison Investment Research Limited [4794244]. www.edisongroup.com DISCLAIMER
Copyright 2016 Edison Investment Research Limited. All rights reserved. This report has been commissioned by TransContainer and prepared and issued by Edison for publication globally. All information used in the publication of this report has been compiled from publicly available sources that are believed to be reliable, however we do not guarantee the accuracy or completeness of this report. Opinions contained in this report represent those of the research department of Edison at the time of publication. The securities described in the Investment Research may not be eligible for sale in all jurisdictions or to certain categories of investors. This research is issued in Australia by Edison Aus and any access to it, is intended only for "wholesale clients" within the meaning of the Australian Corporations Act. The Investment Research is distributed in the United States by Edison US to major US institutional investors only. Edison US is registered as an investment adviser with the Securities and Exchange Commission. Edison US relies upon the "publishers' exclusion" from the definition of investment adviser under Section 202(a)(11) of the Investment Advisers Act of 1940 and corresponding state securities laws. As such, Edison does not offer or provide personalised advice. We publish information about companies in which we believe our readers may be interested and this information reflects our sincere opinions. The information that we provide or that is derived from our website is not intended to be, and should not be construed in any manner whatsoever as, personalised advice. Also, our website and the information provided by us should not be construed by any subscriber or prospective subscriber as Edison’s solicitation to effect, or attempt to effect, any transaction in a security. The research in this document is intended for New Zealand resident professional financial advisers or brokers (for use in their roles as financial advisers or brokers) and habitual investors who are “wholesale clients” for the purpose of the Financial Advisers Act 2008 (FAA) (as described in sections 5(c) (1)(a), (b) and (c) of the FAA). This is not a solicitation or inducement to buy, sell, subscribe, or underwrite any securities mentioned or in the topic of this document. This document is provided for information purposes only and should not be construed as an offer or solicitation for investment in any securities mentioned or in the topic of this document. A marketing communication under FCA Rules, this document has not been prepared in accordance with the legal requirements designed to promote the independence of investment research and is not subject to any prohibition on dealing ahead of the dissemination of investment research. Edison has a restrictive policy relating to personal dealing. Edison Group does not conduct any investment business and, accordingly, does not itself hold any positions in the securities mentioned in this report. However, the respective directors, officers, employees and contractors of Edison may have a position in any or related securities mentioned in this report. Edison or its affiliates may perform services or solicit business from any of the companies mentioned in this report. The value of securities mentioned in this report can fall as well as rise and are subject to large and sudden swings. In addition it may be difficult or not possible to buy, sell or obtain accurate information about the value of securities mentioned in this report. Past performance is not necessarily a guide to future performance. Forward-looking information or statements in this report contain information that is based on assumptions, forecasts of future results, estimates of amounts not yet determinable, and therefore involve known and unknown risks, uncertainties and other factors which may cause the actual results, performance or achievements of their subject matter to be materially different from current expectations. For the purpose of the FAA, the content of this report is of a general nature, is intended as a source of general information only and is not intended to constitute a recommendation or opinion in relation to acquiring or disposing (including refraining from acquiring or disposing) of securities. The distribution of this document is not a “personalised service” and, to the extent that it contains any financial advice, is intended only as a “class service” provided by Edison within the meaning of the FAA (ie without taking into account the particular financial situation or goals of any person). As such, it should not be relied upon in making an investment decision. To the maximum extent permitted by law, Edison, its affiliates and contractors, and their respective directors, officers and employees will not be liable for any loss or damage arising as a result of reliance being placed on any of the information contained in this report and do not guarantee the returns on investments in the products discussed in this publication. FTSE International Limited (“FTSE”) © FTSE 2016. “FTSE®” is a trade mark of the London Stock Exchange Group companies and is used by FTSE International Limited under license. All rights in the FTSE indices and/or FTSE ratings vest in FTSE and/or its licensors. Neither FTSE nor its licensors accept any liability for any errors or omissions in the FTSE indices and/or FTSE ratings or underlying data. No further distribution of FTSE Data is permitted without FTSE’s express written consent. |
Frankfurt +49 (0)69 78 8076 960 Schumannstrasse 34b 60325 Frankfurt Germany |
London +44 (0)20 3077 5700 280 High Holborn London, WC1V 7EE United Kingdom |
New York +1 646 653 7026 245 Park Avenue, 39th Floor 10167, New York US |
Sydney +61 (0)2 9258 1161 Level 25, Aurora Place 88 Phillip St, Sydney NSW 2000, Australia |
Wellington +64 (0)48 948 555 Level 15, 171 Featherston St Wellington 6011 New Zealand |
Frankfurt +49 (0)69 78 8076 960 Schumannstrasse 34b 60325 Frankfurt Germany |
London +44 (0)20 3077 5700 280 High Holborn London, WC1V 7EE United Kingdom |
New York +1 646 653 7026 245 Park Avenue, 39th Floor 10167, New York US |
Sydney +61 (0)2 9258 1161 Level 25, Aurora Place 88 Phillip St, Sydney NSW 2000, Australia |
Wellington +64 (0)48 948 555 Level 15, 171 Featherston St Wellington 6011 New Zealand |
|