Last close As at 05/08/2026
—
— 0.00 (0.00%)
Market capitalisation
—
Research: Energy & Resources
Deutsche Rohstoff (DRAG) has a track record of shareholder value creation through timely investments in the resources sector across a range of commodities and geographies. The company’s investment in Tekton Energy, for example, generated a 365% return on equity over three years. DRAG’s current focus is on the development of oil and gas opportunities onshore US. Management expects to make strong returns on investment, drilling unconventional acreage in the Williston Basin and the Wattenberg field, while also using the company’s balance sheet to acquire additional assets. Future returns will be susceptible to management’s ability to anticipate commodity price cycles, structure transactions and exploit acquired assets.
Written by
Deutsche Rohstoff |
Track record of value creation
Oil & gas |
Scale research report - Initiation
22 May 2017 |
Share price graph
Share details
Business description
Bull
Bear
Analyst
|
||||||||||||||||||||||||||||
Deutsche Rohstoff (DRAG) has a track record of shareholder value creation through timely investments in the resources sector across a range of commodities and geographies. The company’s investment in Tekton Energy, for example, generated a 365% return on equity over three years. DRAG’s current focus is on the development of oil and gas opportunities onshore US. Management expects to make strong returns on investment, drilling unconventional acreage in the Williston Basin and the Wattenberg field, while also using the company’s balance sheet to acquire additional assets. Future returns will be susceptible to management’s ability to anticipate commodity price cycles, structure transactions and exploit acquired assets.
Focus on the fragmented US onshore market
DRAG has successfully acquired, developed and monetised assets in the Williston Basin and Wattenberg field, both of which remain the focus of its current asset base. Well pad returns are relatively high in the current commodity price environment, and, with break-evens at c $35/bbl, highly leveraged to commodity prices.
Activity for 2017 and funding
DRAG expects to continue to monetise its US onshore assets through work programmes, much of which is to be funded through cash generation and debt. However, management may choose to monetise more capital-intensive assets. At a group level, DRAG is well capitalised with €24.6m of cash and €75.2m of debt at year end 2016 (reserve-based lending component priced at 3.74%). The company and management are well regarded and as such DRAG bonds trade 6% above par.
Valuation: Undervalued versus US peers
DRAG has conducted independent valuations of its oil and gas asset base, which includes companies Salt Creek Oil & Gas, Elster Oil & Gas, and Cub Creek Energy. The sum total CPR NPV10 for the company’s 1P oil and gas asset base is €144.7m. Assuming the company’s mining assets are valued at book value and adding in net debt and tax receivables, this would amount to a SOTP valuation of c €130.5m or €25.8/share, or €41.5/share including 2P reserves. We have compared DRAG to its US onshore peers within this note. DRAG’s US peer group is disparate both in terms of phase mix and financial leverage and therefore it is difficult to find reliable comparables. Nevertheless, DRAG trades at a discount on most metrics.
|
Consensus estimates
Source: DRAG, Bloomberg consensus. Note: Consensus does not reflect company guidance |
Edison Investment Research provides qualitative research coverage on companies in the Deutsche Börse Scale segment in accordance with section 36 subsection 3 of the General Terms and Conditions of Deutsche Börse AG for the Regulated Unofficial Market (Freiverkehr) on Frankfurter Wertpapierbörse (as of 1 March 2017). Two to three research reports will be produced per year. Research reports do not contain Edison analyst financial forecasts.
Company description: US onshore exploitation play
Deutsche Rohstoff’s (DRAG) business strategy involves the identification, development and monetisation of attractive resource projects in North America, Australia and Europe. The company’s current focus is on the development of oil and gas opportunities in the US. As it stands, its US unconventional resource base makes up the bulk of DRAG’s valuation and the company retains less significant positions in gold, copper, rare earth minerals, tungsten and tin through equity investments in six mining companies.
The exhibit below outlines DRAG’s equity investments and the resource focus of each of its holding companies.
|
Exhibit 1: DRAG company holdings |
|
|
Source: Edison Investment Research |
To date, DRAG has a track record of creating value for shareholders through successful development and monetisation of its equity holdings. Since IPO in May 2010, equity and debt raised has totalled €108.2m, and proceeds from the sale of four investments amount to $250m. The most material divestment was that of the Tekton Energy, which was sold for $230m in 2014, generating a return on equity of 365% over three years.
Management is focused on delivering capital growth and income for shareholders (FY16 dividend yield is 2.9%) and after recent equity divestments, DRAG maintains a strong balance sheet with €24.6m of cash (€35.6m including marketable securities) and €75.2m debt. Excess capital is likely to fund organic growth with existing holding companies, in-organic growth and returns to shareholders. Key historical investment returns are shown in the table below:
Exhibit 2: Historical investment returns
Company |
Founded/acquired |
Divested |
Equity invested, €m |
Debt, €m |
ROIC |
ROE |
Rhein Petroleum |
2007 |
2011/2012* |
4.9 |
0 |
198% |
198% |
Georgetown |
May-09 |
Sep-12 |
1.7 |
7.2 |
26% |
188% |
Tekton |
2011 |
Mar-14 |
20.5 |
29 |
151% |
365% |
Source: DRAG. Note: *Sold 70% stake
|
Exhibit 3: Revenues by segment FY16 |
Exhibit 4: Revenues by geography FY16 |
|
|
|
Source: DRAG, Edison Investment Research |
|
Exhibit 3: Revenues by segment FY16 |
|
|
Source: DRAG, Edison Investment Research |
|
Exhibit 4: Revenues by geography FY16 |
|
|
Source: DRAG, Edison Investment Research |
DRAG’s revenues by resource segment have shifted towards oil and gas in recent years with the company active in two prolific onshore shale plays: the Williston Basin (Bakken) and Wattenberg field (Niobrara/Codell).
The major assets of Tekton Energy, including all of the producing wells and wells drilled, together with the majority of areas in the Wattenberg field, were sold to the former cooperation partner, Extraction Oil & Gas, in May 2014 at a price of $200m plus a $30m asset carve out. The sale proceeds were used to repay $39m in debt with the remainder distributed to Tekton shareholders including Deutsche Rohstoff USA (a 100% subsidiary of Deutsche Rohstoff AG).
Invested capital in Tekton was $30m of equity capital, and returns on investment include a dividend payout of $129m, equating to a 365% return on equity in less than four years.
The remaining assets within Tekton formed new company Elster Oil & Gas (EOG), of which DRAG is a 93.04% shareholder. A key retained asset is the Magpie area, which is south of the Windsor assets sold to Extraction Oil & Gas. Elster has a 50% non-operated interest in Magpie – over 50 wells are planned for this area at net cost of $2m to $4m per well with all-in break-evens estimated at $35/bbl WTI.
Reserves and resources
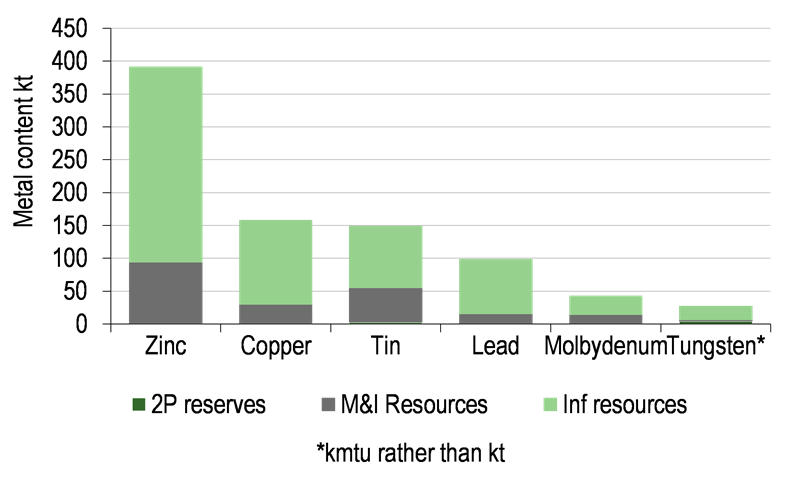
DRAG holds a multi-commodity reserve and resource base. Net proven and probable reserves are dominated by the company’s oil and gas position onshore US. Outside oil and gas DRAG has reserves and resources of zinc, copper, tin, lead, tungsten and molybdenum. From a value perspective the company’s oil and gas equity interests dominate.
|
Exhibit 5: DRAG net* oil and gas reserves |
Exhibit 6: DRAG net* mining reserves and resources |
|
|
|
Source: Edison Investment Research, DRAG data. Note: *DRAG net equity interest. |
|
Exhibit 5: DRAG net* oil and gas reserves |
|
|
Source: Edison Investment Research, DRAG data. Note: *DRAG net equity interest. |
|
Exhibit 6: DRAG net* mining reserves and resources |
|
|
Source: Edison Investment Research, DRAG data. Note: *DRAG net equity interest. |
Critical drivers and sensitivities
Key valuation drivers and sensitivities are described below:
■
Commodity prices: DRAG is exposed to fluctuations in realised price across a number of commodities. From a value perspective the most relevant commodity benchmark is WTI crude, and the regional discount at which DRAG is able to monetise its liquids output.
■
Funding of organic and inorganic growth: DRAG’s ability to fund organic growth of existing investments, including development of its net 2P reserve base as well as further opportunistic asset transactions and dividend, will be driven by liquidity constraints. Currently, DRAG has over $24.6m of cash and manageable leverage with debt of €75.2m.
■
Regulatory issues: DRAG owns assets across a wide variety of geographies and fiscal regimes. Risks and uncertainty exist with regard to potential changes in regulatory and fiscal terms across the company’s asset base.
■
Reserve estimates and recovery: Independent reserve and resource estimates exist for the company’s asset base as well as for the value of the company’s US oil and gas investments. NPV10 valuations are subject to assumptions around commodity price, well type curves, costs and drilling rates. NPV10 valuations are normally ‘best estimates’ of value and investors should recognise that there is inherent uncertainty in such valuations.
■
Transactional considerations: DRAG’s ability to create value for shareholders will to some extent depend on its ability to purchase and monetise assets at the optimum time in the commodity price cycle and the investment cycle. Management has a track record of value creation, but future returns are not guaranteed.
Strategy: Buy, build and monetise
DRAG’s multi-asset and resource strategy has been built around management’s ability to identify investment opportunities, and development of these opportunities to the point of exit.
Management is not constrained by target returns or holding periods, and has an opportunistic view to both acquisition and divestment timing. Historically, this has generated significant value for shareholders and management has been able to attract blue-chip shareholders, such as BASF, as a result. Another testament to DRAG’s capital discipline and investment strategy is the company’s bond (8% due July 2018), which has consistently traded above par (currently a 6% premium). Growth within holding companies is expected to be funded through the use of existing cash, cash flow and debt, as well as asset sales, as opposed to new DRAG equity, limiting shareholder dilution.
Expected returns from US onshore assets
Management believes that it has developed expertise in identifying small US onshore asset packages, as the market at this scale is not as efficient as that for larger acreage positions. Internally, the operating companies have mapped out well productivity, identifying play sweet-spots, providing strong insight ahead of negotiating for leases.
DRAG’s US onshore asset base extends across the Williston Basin (Bakken) and Wattenberg field (Niobrara) and management expected per-well investment returns to range from 20-40% IRR at spot oil prices. The company is highly leveraged to the oil price given its asset base, with NPV10 operational break-even at c $35-40/bbl according to management estimates.
|
Exhibit 7: Expected well economics post tax and royalties |
|
|
Source: Deutsche Rohstoff. Note: Williston assumptions: capex $7.8m, opex $15.5k, WTI differential $8/bbl, gas price $3/mmbtu, gas differential $1.85mmbtu. Wattenberg assumptions: capex $2.7m, opex $5k, gas price $3/mmbtu, zero gas differential. |
We note that DRAG’s estimates of per well returns, highlighted in Exhibit 7, are relatively conservative compared to those presented by peers active in the same plays/basins. For example, PDC Energy, a peer in the Wattenberg field, suggests that significantly higher returns are feasible through the use of modern completion techniques and longer laterals, even at relatively low oil prices. Publically available data suggests that returns in the 60-90% range can be generated by low gas oil ratio (GOR) wells using modern drilling and completion techniques even at $40/bbl WTI.
|
Exhibit 8: Well estimated ultimate recovery (EUR) progression and lateral length |
Exhibit 9: Per well IRR by GOR and lateral length at $40/bbl WTI and $2.50/mcf |
|
|
|
Source: PDC Energy, Edison Investment Research. Note: SRL = short range lateral, MRL = mid-range, XRL = extra long. |
|
|
Exhibit 8: Well estimated ultimate recovery (EUR) progression and lateral length |
|
|
|
|
Exhibit 9: Per well IRR by GOR and lateral length at $40/bbl WTI and $2.50/mcf |
|
|
|
|
Source: PDC Energy, Edison Investment Research. Note: SRL = short range lateral, MRL = mid-range, XRL = extra long. |
As shale activity levels ramp-up in the US onshore, driven by the recent oil price recovery, we see potential for an increase in service sector pricing (rig rates, pressure pumping and labour rates), which could have an impact on realisable margins. The impact of service cost inflation is hard to quantify, but should be an investment consideration.
Recent newsflow and upcoming catalysts
■
Cub Creek Energy (CCE) (80% ownership): Founded in 2014, Cub Creek Energy is the operator for the company’s shale asset in Colorado. 21 wells were drilled/completed in Q416 and January production was 7,700boe/d. 31 additional wells are planned for 2017 on the Hayley drilling site, and drilling operations have commenced with potential to deliver incremental production in Q317. The company also has an inventory of over 100 drilling locations, and is considering the use of longer lateral lengths in order to deliver higher per well returns.
■
Elster Oil and Gas (93% ownership): Founded in 2014, Elster is also focused on non-operated production from the Wattenberg field (Colorado). The company’s first wells started production in September 2015 and six new wells commenced in July 2016. The operator plans to drill an additional 50 wells in order to boost production. Wells are anticipated to cost up to $2.7m each. DRAG may consider divestment of this non-operated asset base as management prefers to operate its own assets. Further capital is likely to be required if DRAG is to participate at current interests in the upcoming 50-well programme.
■
Salt Creek Oil and Gas (90% ownership): Founded in 2015, Salt Creek is focused on non-operated acreage in the Williston Basin (North Dakota). The company’s asset base was purchased for a total consideration of $38.1m and consists of 60 producing wells and 95 infill drilling opportunities. Working interest across the well portfolio averages 8% and in August 2016 net production averaged 620boe/d. Salt Creek has been able to access the RBL debt market ($12.5m at 3.74%) enabling the company to fund infill drilling through debt and cash flow. Partners in the Williston Basin include Whiting, Hess and EOG Resources, and the group has received authority for expenditure (AFEs) on 12 well proposals to date in 2017.
Market overview
DRAG is exposed to the price of multiple commodities, with greatest leverage to oil and gas prices in the US and regional discounts to the WTI crude benchmark. Prices have been volatile, driven by commodity-specific supply/demand dynamics, but as can be seen in the exhibits below a number of commodities have seen price strength in recent months, driven by positive emerging market PMI data and GDP growth revisions.
|
Exhibit 10: WTI crude oil price |
Exhibit 11: Nymex gas price |
|
|
|
Source: World Bank Group. 2017. Commodity Markets Outlook, April. World Bank, Washington, DC. License: Creative Commons Attribution CC BY 3.0 IGO |
|
|
Exhibit 12: Gold price |
Exhibit 13: Zinc price |
|
|
|
Source: World Bank Group. 2017. Commodity Markets Outlook, April. World Bank, Washington, DC. License: Creative Commons Attribution CC BY 3.0 IGO |
|
|
Exhibit 14: Tin price |
Exhibit 15: Tungsten price |
|
|
|
Source: World Bank Group. 2017. Commodity Markets Outlook, April. World Bank, Washington, DC. License: Creative Commons Attribution CC BY 3.0 IGO |
Source: Bloomberg, Edison Investment Research |
|
Exhibit 10: WTI crude oil price |
|
|
|
|
Source: World Bank Group. 2017. Commodity Markets Outlook, April. World Bank, Washington, DC. License: Creative Commons Attribution CC BY 3.0 IGO |
|
|
Exhibit 12: Gold price |
|
|
|
|
Source: World Bank Group. 2017. Commodity Markets Outlook, April. World Bank, Washington, DC. License: Creative Commons Attribution CC BY 3.0 IGO |
|
|
Exhibit 14: Tin price |
|
|
|
|
Source: World Bank Group. 2017. Commodity Markets Outlook, April. World Bank, Washington, DC. License: Creative Commons Attribution CC BY 3.0 IGO |
|
|
Exhibit 11: Nymex gas price |
|
|
Exhibit 13: Zinc price |
|
|
Exhibit 15: Tungsten price |
|
|
Source: Bloomberg, Edison Investment Research |
Management, organisation and corporate governance
Supervisory board and management board
German listed companies typically have three corporate bodies – an annual general meeting of shareholders, a board of management (Vorstand) and a supervisory board (Aufsichtsrat). There is clear separation between management and supervisory functions in the two-tier board. The purpose of the supervisory board is to support the interests of shareholders, but also the interests of other parties including the company’s employees, and public interest. The supervisory board oversees the company’s board of management and appoints its members.
The supervisory board members are:
■
Martin Billhardt, chairman of the supervisory board, is operating partner of WP Management Solutions AG. He was CFO of PNE Wind AG from 2004 until 2008 and CEO from 2008 until 2015. Previously he acted as managing director of a large family office for more than 10 years and worked as a lawyer.
■
Professor Dr Gregor Borg has been professor for petrology and economic geology at the Martin-Luther-University Halle-Wittenberg since 1993. He is an internationally renowned commodity expert in the field of exploration, and an independent consultant for major mining firms, such as Anglo American.
■
Wolfgang Seybold is CEO of investment holding company AXINO Investment Ltd and AXINO Ltd, which has specialised in the identification and promotion of exploration and mining companies since 2001. He has over 25 years of investment experience in the resource sector.
Organisation
The management board members are:
■
CEO Thomas Gutschlag was co-founder of Deutsche Rohstoff AG in 2006. Since May 2007 Dr Gutschlag has been a member of the board. He is responsible for the management of the group and the supervision of DRAG’s subsidiaries and holdings. In addition, he is in control of communication and investor relations.
■
CFO Jan-Philipp Weitz joined Deutsche Rohstoff AG in 2010. He has been a member of the management board since January 2017. Within the group, he is responsible for accounting, controlling and corporate finance. Furthermore, he is in charge of project evaluation, initiation and supervision of subsidiaries.
Key operating company CEOs
Cub Creek Energy and Elster Oil & Gas CEO/President – Robert A Gardner
Robert Gardner has 23 years of oil and gas experience in reserves, operations and project management. He has extensive Rocky Mountain experience, having served as engineering manager for Ute Energy, LLC from 2010 to 2012, while being responsible for the drilling and completion of over 150 wells and reserve determination in excess of 400mmboe in the Uintah Basin, resulting in a successful divestment value of $790m at the end of 2012. Recently, Mr Gardner served as VP of engineering at Tekton Energy, LLC where had direct responsibility for drilling and completing 31 horizontal Codell and Niobrara wells leading to a successful $220m divestment of the company. During his career, Mr Gardner has worked at a variety of positions in well-known oil and gas companies.
Salt Creek Oil & Gas CEO/President – Timothy M Sulser
Tim Sulser founded Salt Creek Oil and Gas, LLC with Jerry Sommer and Earl Norris in 2015, after five years as an investment banker with Tudor, Pickering, Holt & Co (TPH), most recently heading its Denver office. While at TPH, Tim advised upstream clients on acquisitions, divestitures and energy capital markets. Prior to joining TPH he worked as a reservoir engineer for reserve engineering consultant Netherland, Sewell, and Associates in Houston, Texas. He started his career with Marathon Oil Company in Lafayette.
Corporate governance
As described above, German listed companies are required to maintain a dual board – a management board and a supervisory board – in order to ensure the management decisions are in the interest of both shareholders and employees.
Shareholders and free float
DRAG’s largest shareholders include management and BASF. With a free float of c 81.2%, trading remains liquid, with average daily volume of 21.7k shares.
Exhibit 16: Major shareholders
Holder name |
% shares outstanding |
Thomas Gutschlag |
9.9 |
BASF VG |
6.3 |
Deutsche Rohstoff AG – treasury shares |
2.5 |
Free float |
81.2 |
In the money options |
1.9 |
Holder name |
Thomas Gutschlag |
BASF VG |
Deutsche Rohstoff AG – treasury shares |
Free float |
In the money options |
% shares outstanding |
9.9 |
6.3 |
2.5 |
81.2 |
1.9 |
Source: Bloomberg, DRAG data
Financials
DRAG produces consolidated financial accounts in line with German GAAP. DRAG’s P&L is representative of the company’s business model with revenues falling substantially in 2015 after the sale of Tekton Energy. DRAG’s cash flow statement reflects this significant divestment with a substantial increase in shareholder equity and cash/cash equivalents. Investors should expect financial metrics to remain volatile as management continues to acquire and divest assets, but should instead focus on cash returns on investment. A table of historical returns on investment is provided earlier in this note (Exhibit 2).
Exhibit 17: Financial summary and consensus forecasts
German GAAP (€000s) |
2013 |
2014 |
2015 |
2016 |
2017e |
2018e |
Income statement |
||||||
Sales Revenue |
17,762 |
22,870 |
1,899 |
9,170 |
78,100 |
137,000 |
Growth % |
29% |
(92%) |
383% |
752% |
75% |
|
EBITDA |
1,906 |
113,768 |
4,906 |
6,374 |
64,750 |
117,500 |
EBITDA Margin % |
11% |
497% |
258% |
70% |
83% |
86% |
EBIT |
(5,432) |
88,726 |
2,419 |
(541) |
45,350 |
82,800 |
Net profit (after minority interests) |
(7,809) |
84,661 |
(557) |
102 |
41,200 |
77,650 |
Number of shares |
5,322 |
5,322 |
5,063 |
5,063 |
5,063 |
5,063 |
EPS (€/share) |
(1.47) |
15.91 |
(0.11) |
0.02 |
4.36 |
8.94 |
DPS (€/share) |
0.5 |
0.55 |
0.575 |
0.8 |
0.825 |
|
Balance sheet |
||||||
Cash and cash equivalents inc financial assets/investments |
50,461 |
103,325 |
83,032 |
28,090 |
||
Total assets |
134,696 |
134,696 |
128,054 |
193,472 |
||
Total debt |
71,485 |
63,518 |
57,962 |
75,243 |
||
Total liability |
90,241 |
67,821 |
62,185 |
109,146 |
||
Shareholders’ equity |
38,894 |
62,488 |
61,480 |
66,121 |
||
Cash flow statement |
||||||
Net cash from operating activities |
(1,768) |
(18,976) |
1,193 |
2,914 |
||
Net cash from investing activities |
(37,277) |
89588 |
(15,100) |
(38,791) |
(56,600) |
(110,000) |
Net cash from financing activities |
(47,469) |
(47,469) |
(14,066) |
(11,516) |
||
Net cash flow |
29,832 |
23,143 |
(27,972) |
(24,360) |
||
Bank balances |
39,815 |
74,089 |
48,445 |
24,634 |
||
Net debt (cash incl. investments) |
21,024 |
(39,807) |
(25,070) |
(47,153) |
Source: Deutsche Rohstoff data, Bloomberg
We note that Bloomberg consensus currently does not reflect company guidance of an increase in dividend to €0.6/share proposed by management and the supervisory board. In addition, management expects 2017 group sales of €55-65m and EBITDA of €40m. This forecast is made on the basis that existing producing wells continue to produce in line with management forecast production profiles, and a fraction of wells under development contribute to 2017 sales and an average oil price assumption of $50/bbl. Q117 figures show that the company generated revenues of €20.7m in the quarter and EBITDA of €17.2m.
|
Exhibit 18: Sales revenue and EBITDA forecasts |
|
|
Source: DRAG, Bloomberg consensus. Note: Consensus estimates do not reflect company guidance. |
Balance sheet and cash flow
DRAG’s cash flow statement should be viewed in light of the company’s major acquisitions and divestments. These are likely to be lumpy in nature. As it stands, DRAG has a robust balance sheet given its projected EBITDA profile, with €24.6m of cash and €75.2m of coporate debt. Investors should focus on the company’s free cash flow generation, and cash returns on investment, given the company’s business model.
Valuation
The market value of DRAG appears to be at a discount to the NPV10 (Ryder Scott CPR) of its net oil and gas investments plus book value of mining assets minus net debt. We believe asset value is an appropriate basis for valuation of DRAG over above traditional P&L metrics such as P/E or EV/EBITDA due to the nature of its investments. We would expect DRAG’s P&L to remain volatile due to asset acquisitions, divestments and asset impairments. Over a longer time horizon, investors may wish to consider return metrics such as ROACE, ROIC and ROE in order to formulate a view on management’s ability to create value through its ‘acquire, develop and divest strategy’.
Exhibit 19: DRAG assets and per share value
CPR net NPV10 - 1P |
CPR net NPV10 - 2P |
||||
Asset |
Value basis |
Value EURm |
Value per Euro/share |
Value EURm |
Value per Euro/share |
Oil and Gas assets |
See column heading |
144.7 |
28.6 |
224.1 |
44.3 |
Mining assets |
Book value FY16 |
20.0 |
4.0 |
20.0 |
4.0 |
Tax refund due |
Book value FY16 |
13.0 |
2.6 |
13.0 |
2.6 |
Cash at bank |
Book value FY16 |
28.1 |
5.5 |
28.1 |
5.5 |
Debt |
Book value FY16 |
-75.2 |
-14.9 |
-75.2 |
-14.9 |
Total equity valuation |
130.5 |
25.8 |
210.0 |
41.5 |
|
Market value |
108 |
21.3 |
108 |
21.3 |
|
Delta |
21% |
21% |
94% |
94% |
|
Source: Deutsche Rohstoff, Edison Investment Research
Peer valuation
With the bulk of DRAG’s value driven by US onshore shale assets we have analysed the company’s peer group base on metrics typically used to value US onshore E&P plays. Typical comparable valuation metrics include EV/acre, EV/flowing barrel and EV/reserves. We note that DRAG’s peer group contains a varied mix of companies in terms of market cap, play diversity, resource phase mix and financial leverage therefore ‘comparable’ companies shown in the table below should not be considered in isolation.
In the comparison table below we adjust DRAG’s EV for the book value of mining assets, tax receivable and net debt in order to be able to compare the company’s US onshore business with a number of pure plays. As mentioned above, the peer group is diverse; nevertheless, based on headline metrics, DRAG trades at discount to the group below on an EV/1P, EV/flowing barrel and EV/NPV10 (1P) basis. We also note that DRAG has significantly less financial leverage than a number of peers including Bonanza Creek and Bill Barret.
Exhibit 20: Peer group comparison
Company |
Ticker |
EV ($m) |
Production |
1P mmboe |
% liquids |
SEC NPV10 |
dev net acres |
EV/1P |
EV/ |
EV/dev acre |
EV/ |
2017e EV/ |
Prod’n CAGR (2016-18) |
2017e Net debt/ EBITDA |
Bonanza creek |
BCEI |
673 |
21.7 |
101.3 |
75% |
328 |
71,236 |
6.6 |
31,028 |
9,452 |
2.1 |
9.3 |
3% |
-0.8 |
Bill Barret |
BBG |
736 |
17.0 |
83.7 |
77% |
328 |
40,359 |
8.8 |
43,318 |
18,246 |
2.2 |
4.87 |
13% |
4.1 |
PDC energy |
PDC |
4250 |
60.5 |
273 |
60% |
1097 |
112,155 |
15.6 |
70,246 |
37,893 |
3.9 |
7.14 |
24% |
1.5 |
SRC Energy |
SRCI |
1497 |
11.7 |
66.2 |
57% |
391 |
31,100 |
22.6 |
128,276 |
48,135 |
3.8 |
9.1 |
44% |
0.8 |
Extraction |
XOG |
2699 |
29.9 |
158.7 |
64% |
836 |
38,900 |
17.0 |
90,295 |
69,383 |
3.2 |
8.2 |
42% |
1.3 |
Peer Average |
14 |
72,633 |
36,622 |
3 |
8 |
25% |
1 |
|||||||
Deutsche Rohstoff |
DRAG |
126 |
4.6 |
15.1 |
160.6 |
1,650 |
8.4 |
27,380.4 |
76,333 |
0.8 |
0.8 |
|||
Discount / Premium sector |
-41% |
-62% |
108% |
-74% |
-46% |
|||||||||
Source: Edison Investment Research, Bloomberg consensus. Note: *Includes book value of mining and tax refund due.
DRAG’s US onshore Williston and Wattenberg peers (excluding the large/mid-cap E&Ps) are a diverse group with varying levels of reserves, acreage, production and financial leverage. We have looked at DRAG versus its immediate peer group on several valuation metrics and have looked for relationships between financial and operational metrics.
DRAG trades at a discount to the peer group on a number of metrics including enterprise value per flowing barrel (EV/bbld). We have included EV/NPV10 as a valuation metric to compare the company’s enterprise value to the SEC standardised measure of discounted cash flows. It is worth noting that DRAG’s audited assessment NPV10 for Salt Creek, Elster and Cub Creek utilise marginally different price decks to those prescribed by the SEC, so some caution is required when using this metric as a comparative.
|
Exhibit 21: Valuation on basis of production and developed acres |
Exhibit 22: EV/flowing barrel vs EV/NPV10* |
|
|
|
Source: Bloomberg, Edison Investment Research |
Source: Bloomberg, Edison Investment Research. Note: *SEC standardised measure for US comps and last audited figures (NPV10) for DRAG |
|
Exhibit 21: Valuation on basis of production and developed acres |
|
|
Source: Bloomberg, Edison Investment Research |
|
Exhibit 22: EV/flowing barrel vs EV/NPV10* |
|
|
Source: Bloomberg, Edison Investment Research. Note: *SEC standardised measure for US comps and last audited figures (NPV10) for DRAG |
On consensus estimates, DRAG appears to trade at a discount to the peer group when considering the relationship between financial leverage and EV/1P reserves and a slight premium on a EV/developed acre basis. In our view, the company appears to be relatively undervalued and modestly leveraged compared to peers.
|
Exhibit 23: Net debt/EBITDA vs EV/developed acre |
Exhibit 24: Net debt/EBITDA vs EV/1P |
|
|
|
Source: Bloomberg, Edison Investment Research |
|
Exhibit 23: Net debt/EBITDA vs EV/developed acre |
|
|
Source: Bloomberg, Edison Investment Research |
|
Exhibit 24: Net debt/EBITDA vs EV/1P |
|
|
Source: Bloomberg, Edison Investment Research |
DRAG also appears to trade at a discount when considering 2017 EBITDA consensus forecasts and production growth. DRAG trades at on a relatively low EV/EBITDA multiple given its financial leverage.
|
Exhibit 25: 2017 EV/EBITDA vs net debt/EBITDA |
Exhibit 26: EV/EBITDA vs production growth |
|
|
|
Source: Bloomberg, Edison Investment Research. Note: *EBITDA based on DRAG management forecasts for 2017 |
Source: Bloomberg, Edison Investment Research |
|
Exhibit 25: 2017 EV/EBITDA vs net debt/EBITDA |
|
|
Source: Bloomberg, Edison Investment Research. Note: *EBITDA based on DRAG management forecasts for 2017 |
|
Exhibit 26: EV/EBITDA vs production growth |
|
|
Source: Bloomberg, Edison Investment Research |
Appendix – reserve definitions
Definitions of proved reserves (1P) and probable reserves (proved + probable equates to 2P) are provided below using Society of Petroleum Engineers (SPE) definitions.
Proved reserves: proved reserves are those quantities of petroleum, which by analysis of geoscience and engineering data, can be estimated with reasonable certainty to be commercially recoverable, from a given date forward, from known reservoirs and under defined economic conditions, operating methods and government regulations. If deterministic methods are used, the term ‘reasonable certainty’ is intended to express a high degree of confidence that the quantities will be recovered. If probabilistic methods are used, there should be at least a 90% probability that the quantities actually recovered will equal to or exceed the estimate.
Probable reserves: probable reserves are those additional reserves, which analysis of geoscience and engineering data indicate are less likely to be recovered than proved reserves but more certain to be recovered than possible reserves. It is equally likely that actual remaining quantities recovered will be greater than or less than the sum of the estimated proved plus probable reserves (2P). In this context, when probabilistic methods are used, there should be at least a 50% probability that the actual quantities recovered will equal to or exceed the 2P estimate.
Frankfurt +49 (0)69 78 8076 960 Schumannstrasse 34b 60325 Frankfurt Germany |
London +44 (0)20 3077 5700 280 High Holborn London, WC1V 7EE United Kingdom |
New York +1 646 653 7026 245 Park Avenue, 39th Floor 10167, New York US |
Sydney +61 (0)2 8249 8342 Level 12, Office 1205 95 Pitt Street, Sydney NSW 2000, Australia |
|
Research: TMT
Nanoco has announced via RNS Reach a collaboration and joint development agreement with Kyulux to co-develop next generation display technologies. The aim of the collaboration is to combine Nanoco’s cadmium free quantum dots with Kyulux’s next generation OLED technology. The goal is to create supercharged hybrid OLED/Quantum dot devices able to emit greater amounts of light, which are required for the future generation of QLED/OLED televisions.