Tonix Pharmaceuticals
Written by
Tonix Pharmaceuticals |
Additional data support mechanism of action |
Development update |
Pharma & biotech |
24 November 2015 |
Share price performance
Business description
Next events
Analysts
Tonix Pharmaceuticals is a research client of Edison Investment Research Limited |
|||||||||||||||||||||||||||||||||||||||||||||||||||
Data from the Phase IIb BESTFIT trial reported at the American College of Rheumatology (ACR) conference support the idea that improvements in sleep quality are correlated with improvements in pain. As Tonmya (TNX-102 SL) benefits sleep quality, these data are reassuring and we continue to be confident in the success of the Phase III AFFIRM trial. Data from the AFFIRM trial are expected in Q316.
Year end |
Revenue ($m) |
PBT* |
EPS* |
DPS |
P/E |
Yield |
12/14 |
0.0 |
(27.6) |
(2.77) |
0.0 |
N/A |
N/A |
12/15e |
0.0 |
(50.5) |
(2.90) |
0.0 |
N/A |
N/A |
12/16e |
0.0 |
(45.6) |
(2.35) |
0.0 |
N/A |
N/A |
12/17e |
2.4 |
(50.7) |
(2.52) |
0.0 |
N/A |
N/A |
Note: *PBT and EPS are normalised, excluding intangible amortisation, exceptional items and share-based payments.
ACR data suggest correlation between sleep and pain
Data from the BESTFIT trial in fibromyalgia presented at ACR on 10 November demonstrated that improvements in sleep quality were associated with higher responder rates in pain and fibromyalgia. Of the patients who were in the top sleep score improvement tertile, 78% of those in the Tonmya arm were pain responders, compared to just 4% in the bottom sleep score improvement tertile.
2016 will be an eventful year
With readouts from three clinical trials expected in 2016, next year will be critical. First will be data from a Phase II study for TNX-201 (R-isomer of isometheptene) in Q116 for episodic tension-type headache (ETTH), which may offer an effective and non-addictive option. Next will be data from a Phase II trial for TNX-102 SL in Q216 for post-traumatic stress disorder (PTSD), where current medications have spotty efficacy. Finally, the Phase III for Tonmya in fibromyalgia should read out in Q316.
ETTH data may open the door to partnership talks
ETTH is a highly prevalent problem with an estimated 38% of the US population suffering episodic tension-type headaches, making it a potentially attractive market for large pharma. If the TNX-201 Phase II data are positive, we would expect partnership discussions to begin in earnest in H116 and currently model a signed collaboration in 2017.
Valuation: $18.48 per basic share
We have increased our valuation from $347m or $18.44 per basic share to $348m or $18.48 per basic share, mainly due to the slightly higher than expected cash balance at the end of Q315. We expect the company to require further funding of around $80m until profitability, although any capital raise is not likely to occur until some, if not all, of the expected top-line data from the three ongoing trials are released, potentially minimizing dilution if the data are positive.
Alleviating pain and improving sleep
Fibromyalgia is a diffuse, chronic pain disorder where the areas of pain often fluctuate and there are a variety of comorbidities/symptoms, with sleep-related disorders (fatigue, stiffness, non-restorative sleep and difficulty falling asleep) being some of the most intense (see Exhibit 1). It is a relatively common problem from which approximately 2% of Americans suffer (3.4% of women and 0.5% of men)1 with prevalence highest amongst those between the ages of 55 and 64.
D.A. Marcus, A. Deodhar, Fibromyalgia, DOI 10.1007/978-1-4419-1609-9_2.
Exhibit 1: Most intense symptoms of fibromyalgia patients
Symptom |
Mean ± SD |
Morning stiffness |
7.2 ± 2.5 |
Fatigue |
7.1 ± 2.1 |
Non-restorative sleep |
6.8 ± 2.7 |
Pain |
6.4 ± 2.0 |
Forgetfulness |
5.9 ± 2.7 |
Concentration |
5.9 ± 2.6 |
Difficulty falling asleep |
5.6 ± 3.3 |
Muscle spasms |
4.8 ± 3.2 |
Anxiety |
4.5 ± 3.1 |
Depression |
4.4 ± 3.1 |
Symptom |
Morning stiffness |
Fatigue |
Non-restorative sleep |
Pain |
Forgetfulness |
Concentration |
Difficulty falling asleep |
Muscle spasms |
Anxiety |
Depression |
Mean ± SD |
7.2 ± 2.5 |
7.1 ± 2.1 |
6.8 ± 2.7 |
6.4 ± 2.0 |
5.9 ± 2.7 |
5.9 ± 2.6 |
5.6 ± 3.3 |
4.8 ± 3.2 |
4.5 ± 3.1 |
4.4 ± 3.1 |
Source: National Fibromyalgia Association. Note: Symptom score based on 0-10 scale with 0 signifying no symptom and 10 signifying extreme symptom.
Tonix believes that Tonmya, a muscle relaxant that would be taken once daily at bedtime, can improve the sleep quality of patients and hence improve many of the core symptoms of fibromyalgia.
Data from the Phase IIb BESTFIT trial of Tonmya vs placebo in fibrymyalgia patients presented at the recent ACR conference reinforced the thesis that improvements in sleep score are correlated with improvement in pain scores. 41% of the patients on Tonmya were considered to be sleep responders (defined as those in the top tertile of sleep score improvement from baseline) compared to 21% of those in the placebo arm. This is important because those who achieved a top tertile improvement in sleep score had a 78% chance of being a pain responder (regardless of treatment arm), while response rates were in low single digits for those in the bottom tertile of sleep improvement (see Exhibit 2).
|
Exhibit 2: Sleep score improvement and pain response |
|
|
Source: ACR 2015 |
In fact, if you look at all of the sleep outcome-related secondary endpoints, they had a high correlation with fibromyalgia and pain outcomes, with most correlation coefficients between 0.5 and 0.7 (see Exhibit 3). This is important given that Tonmya was able to hit all sleep secondary endpoints with high statistical significance.
|
Exhibit 3: Correlation between sleep and fibromyalgia/pain endpoints in the BESTFIT trial |
|
|
Source: ACR 2015 |
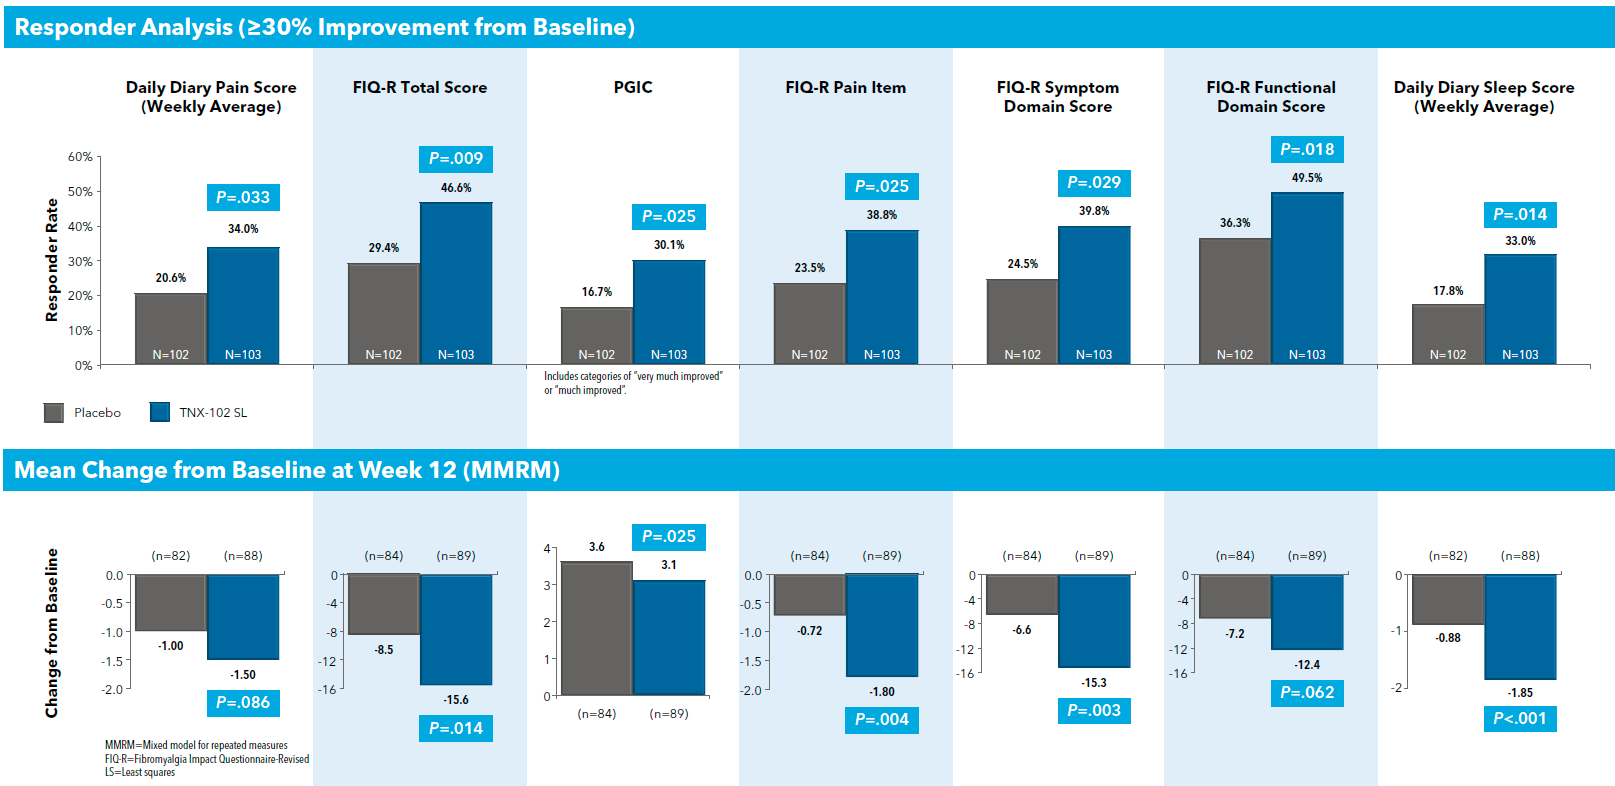
In May 2015, the company launched the 500-patient Phase III AFFIRM study of Tonmya in fibromyalgia. We remain confident in the outcome of this trial despite the fact that the 205-patient Phase IIb BESTFIT trial missed the primary endpoint of mean change from baseline in the daily diary pain score during week 12. This is due to the fact that it showed a statistically significant improvement in a number of secondary endpoints using both mean change and responder analyses (see Exhibit 4), including the endpoint that has been selected as the primary endpoint for the AFFIRM trial, 30% responder rate on daily diary pain score. We expect data from the AFFIRM trial to be released in Q316. Also, the company has said that it expects to start a second Phase III trial in fibromyalgia patients in Q216, although it may be able to receive approval with just one trial, depending on data.
|
Exhibit 4: Mean change and responder analysis across multiple BESTFIT trial endpoints |
|
|
Source: ACR 2015 |
2016: An eventful year
2016 will be a make-or-break year for Tonix, as besides the AFFIRM data, we will see data from two additional trials. First will be data from a Phase II for TNX-201, the R-isomer of isometheptene (the racemic version had been on the market in various forms for decades as a headache treatment), in Q116 for ETTH, which may offer an effective and non-addictive option for ETTH sufferers. Next will be data from a Phase II for TNX-102 SL in Q216 for PTSD, where current medications have spotty efficacy, especially in military-related PTSD, a subpopulation on which Tonix’s Phase II focuses. Finally, the Phase III for Tonmya, which has a high chance of success based on both prior data and clinical trial design improvements, will read out in Q316.
Exhibit 5: Tonix clinical trials
Drug |
Indication |
Dosage |
Number of patients |
Number of sites |
Treatment duration |
Primary endpoint |
Key inclusion criteria |
Expected timing |
TNX-201 |
ETTH |
140mg |
200 |
9 |
Take 140mg of drug on occurrence of headache (one dose per patient) |
Proportion of subjects pain free at two hours and from two to 24 hours post dose. |
History of two to 14 tension-type headaches per month for the last three months. |
Q116 |
TNX-102 SL |
PTSD |
2.8mg/ |
220 |
24 |
Once daily for 12 weeks |
DSM-5 symptom severity score among patients taking the 2.8mg dose. |
Patients with traumas resulting in PTSD during military service, as a military contractor, in the Department of Homeland Security or law enforcement. |
Q216 |
Tonmya |
Fibromyalgia |
2.8mg |
500 |
35 |
Once daily for 12 weeks |
Proportion of subjects with a ≥30% improvement from baseline to week 12 in average pain severity score. |
Fibromyalgia diagnosis and clinically stable with stable anti-depressant therapy. |
Q316 |
Source: ClinicalTrials.gov, Tonix
TNX-201 for ETTH
As TNX-201 will be the first of the company’s clinical trials to provide data, we provide a review of the history, the clinical trial and the market opportunity. ETTH is a highly prevalent problem, with an estimated 38% of the US population suffering episodic tension-type headaches, with approximately 25% of those suffering frequent tension-type headaches,2 making it a potentially attractive market for large pharma. The only FDA-approved treatments include the barbiturate butalbital, with opioids and triptans used off-label, all of which can lead to addiction, tolerance and medication overuse headaches. Overall, an estimated 3.5m prescriptions are written annually for butalbital containing medications for ETTH and another 6.5m prescriptions for opioids and triptans.
Russell et al, European Journal of Epidemiology. 2006;21(2):153-60.
TNX-201 is the R-isomer of isometheptene mucate, a headache medicine that had been on the market in various forms for decades, but without official FDA approval since 1962 due to its grandfathered drug status. The FDA began an initiative in 2006 to pull unapproved drugs off the market, and as of 2011 there are no products containing isometheptene mucate commercially available outside compounding pharmacies.
Tonix initiated a Phase II trial of 200 patients comparing 140mg of TNX-201 to placebo in June, with top-line results expected in Q116. Given the size of this indication and the expense of running a Phase III clinical trial program for ETTH, we expect the company will license this product once positive Phase II results are available, especially as large pharma should be interested in a medication that serves such a large market. Our model assumes that a collaboration will be signed in 2017 with $40m upfront (the average upfront received for headache products, according to BioCentury), another $140m in milestones and a 15% royalty rate. Sales peak at $1bn, representing 25% of the butalbital + opioid + triptan market in 2033 (c 3m prescriptions). Given its apparent safety and non-habit forming qualities, this estimate appears reasonable.
Note that we do not currently model any indications outside ETTH for TNX-201, but potential exists to use it in other pain-related indications. However, that would require a positive trial in ETTH and a large pharmaceutical partner to develop.
Valuation
We have increased our valuation from $347m or $18.44 per basic share to $348m or $18.48 per basic share, mainly due to the slightly higher than expected cash balance at the end of Q315. As we view the ETTH and PTSD programs as high risk and assign 20% and 30% probabilities of success to them, respectively, positive trial results would lead us to increase the value of the company, possibly by a large percentage.
Exhibit 6: Tonix valuation model
Product |
Main indication |
Status |
Probability |
Launch year |
Peak sales ($m) |
Patent protection |
Royalty |
rNPV |
TNX-102 SL |
Fibromyalgia |
Phase III |
70% |
2019 |
$343 |
2034 |
25.0% |
$130 |
TNX-102 SL |
PTSD |
Phase II |
30% |
2020 |
$803 |
2034 |
25.0% |
$102 |
TNX-201 |
ETTH |
Phase II |
20% |
2020 |
$1,006 |
2033 |
15.0% |
$62 |
Total |
|
|
|
|
|
|
|
$293 |
Cash and cash equivalents (Q315) ($m) |
$55.0 |
|||||||
Total firm value ($m) |
$348 |
|||||||
Total basic shares (m) |
18.83 |
|||||||
Value per basic share ($) |
$18.48 |
|||||||
Stock options (9/2015, m) |
1.7 |
|||||||
Weighted average exercise price ($) |
$10.54 |
|||||||
Cash on exercise ($m) |
$18.2 |
|||||||
Total firm value ($m) |
$366 |
|||||||
Total number of shares |
20.6 |
|||||||
Diluted value per share ($) |
$17.82 |
|||||||
Source: Edison Investment Research, company reports
Financials
Tonix reported $55m in cash and cash equivalents at the end of Q315. The company spent $10.3m on R&D and $3.0m on SG&A in Q315. We project that R&D spending will accelerate for the rest of this year and into early next year as clinical trials progress. We have kept our estimates for future revenue and spending substantially the same. We expect the company will require another $80m until profitability in 2020 (we currently expect additional financing in 2016, 2017 and 2018, which we model as long-term debt), although any capital raise is unlikely to occur until after some, if not all, of the expected top-line data from the three ongoing trials are released, potentially minimizing dilution if the data are positive. For context, the company sold 2.67m shares of common stock at a price of $7.50 per share for gross proceeds of $20.1m in July. We have assumed that Tonix will partner fibromyalgia and PTSD after approval, to maximize the deal terms and ETTH after Phase II.
Exhibit 7: Financial summary
$'000s |
2012 |
2013 |
2014 |
2015e |
2016e |
2017e |
||
Year end 31 December |
IFRS |
IFRS |
IFRS |
IFRS |
IFRS |
IFRS |
||
PROFIT & LOSS |
||||||||
Revenue |
|
|
0 |
0 |
0 |
0 |
0 |
2,360 |
Cost of Sales |
0 |
0 |
0 |
0 |
0 |
0 |
||
Gross Profit |
0 |
0 |
0 |
0 |
0 |
2,360 |
||
EBITDA |
|
|
(6,662) |
(10,888) |
(27,656) |
(50,624) |
(45,772) |
(47,736) |
Operating Profit (before GW and except.) |
(6,662) |
(10,888) |
(27,656) |
(50,624) |
(45,772) |
(47,736) |
||
Intangible Amortisation |
0 |
0 |
0 |
0 |
(9) |
(8) |
||
Other |
0 |
0 |
0 |
0 |
0 |
0 |
||
Exceptionals |
0 |
0 |
0 |
0 |
0 |
0 |
||
Operating Profit |
(6,662) |
(10,888) |
(27,656) |
(50,624) |
(45,781) |
(47,744) |
||
Net Interest |
(1,611) |
4 |
40 |
150 |
201 |
(3,004) |
||
Other |
(1,177) |
0 |
0 |
0 |
0 |
0 |
||
Profit Before Tax (norm) |
|
|
(9,450) |
(10,884) |
(27,616) |
(50,474) |
(45,571) |
(50,740) |
Profit Before Tax (FRS 3) |
|
|
(9,450) |
(10,884) |
(27,616) |
(50,474) |
(45,580) |
(50,748) |
Tax |
0 |
0 |
0 |
0 |
0 |
0 |
||
Deferred tax |
0 |
0 |
(0) |
(0) |
(0) |
(0) |
||
Profit After Tax (norm) |
(9,450) |
(10,884) |
(27,616) |
(50,474) |
(45,571) |
(50,740) |
||
Profit After Tax (FRS 3) |
(9,450) |
(10,884) |
(27,616) |
(50,474) |
(45,580) |
(50,748) |
||
Average Number of Shares Outstanding (m) |
1.7 |
3.2 |
10.0 |
17.4 |
19.4 |
20.1 |
||
EPS - normalised ($) |
|
|
(5.58) |
(3.37) |
(2.77) |
(2.90) |
(2.35) |
(2.52) |
EPS - FRS 3 ($) |
|
|
(5.58) |
(3.37) |
(2.77) |
(2.90) |
(2.36) |
(2.52) |
Dividend per share ($) |
0.0 |
0.0 |
0.0 |
0.0 |
0.0 |
0.0 |
||
BALANCE SHEET |
||||||||
Fixed Assets |
|
|
47 |
45 |
373 |
518 |
457 |
409 |
Intangible Assets |
0 |
0 |
0 |
120 |
111 |
103 |
||
Tangible Assets |
47 |
45 |
328 |
342 |
290 |
251 |
||
Other |
0 |
0 |
45 |
56 |
56 |
56 |
||
Current Assets |
|
|
1,785 |
8,202 |
38,184 |
40,152 |
39,118 |
50,341 |
Stocks |
0 |
0 |
0 |
0 |
0 |
0 |
||
Debtors |
0 |
0 |
0 |
0 |
0 |
420 |
||
Cash |
1,785 |
8,202 |
38,184 |
40,152 |
39,118 |
49,921 |
||
Other |
0 |
0 |
0 |
0 |
0 |
0 |
||
Current Liabilities |
|
|
(825) |
(765) |
(1,487) |
(2,422) |
(2,422) |
(2,422) |
Creditors |
(825) |
(765) |
(1,487) |
(2,422) |
(2,422) |
(2,422) |
||
Short term borrowings |
0 |
0 |
0 |
0 |
0 |
0 |
||
Long Term Liabilities |
|
|
(20) |
(13) |
(68) |
(77) |
(40,077) |
(97,717) |
Long term borrowings |
0 |
0 |
0 |
0 |
(40,000) |
(60,000) |
||
Other long term liabilities |
(20) |
(13) |
(68) |
(77) |
(77) |
(37,717) |
||
Net Assets |
|
|
987 |
7,469 |
37,002 |
38,171 |
(2,924) |
(49,389) |
CASH FLOW |
||||||||
Operating Cash Flow |
|
|
(5,713) |
(8,517) |
(22,840) |
(45,476) |
(41,205) |
(6,162) |
Net Interest |
0 |
0 |
0 |
0 |
201 |
(3,004) |
||
Tax |
0 |
0 |
0 |
0 |
0 |
0 |
||
Capex |
(36) |
(15) |
(319) |
(223) |
(30) |
(30) |
||
Acquisitions/disposals |
0 |
0 |
0 |
0 |
0 |
0 |
||
Financing |
6,933 |
10,042 |
47,836 |
47,685 |
0 |
0 |
||
Dividends |
0 |
0 |
0 |
0 |
0 |
0 |
||
Other |
0 |
0 |
0 |
(11) |
0 |
0 |
||
Net Cash Flow |
1,184 |
1,510 |
24,677 |
1,975 |
(41,034) |
(9,197) |
||
Opening net debt/(cash) |
|
|
(41) |
(1,785) |
(8,202) |
(38,184) |
(40,152) |
882 |
HP finance leases initiated |
0 |
0 |
0 |
0 |
0 |
0 |
||
Exchange rate movements |
0 |
(1) |
(3) |
(7) |
0 |
0 |
||
Other |
560 |
4908 |
5308 |
0 |
0 |
0 |
||
Closing net debt/(cash) |
|
|
(1,785) |
(8,202) |
(38,184) |
(40,152) |
882 |
10,079 |
Source: Edison Investment Research, company reports
|