Jupiter US Smaller Companies (JUS) aims to generate long-term capital growth from a focused portfolio of mid- and small-cap US equities. Since 2001, the trust has been managed by Robert Siddles. Following the announcement of adjustments to JUS’s investment process – running a more concentrated portfolio, a greater focus on selling underperforming holdings, while holding on to successful positions for longer – the trust has enjoyed an improvement in investment performance. It has delivered above market results in periods of both positive and negative stock market returns, illustrating its commitment to capital preservation. The board has also reduced JUS’s management fees, removed the performance fee and introduced the trust’s first gearing facility.
Jupiter US Smaller Companies |
Tightened process driving outperformance |
Investment trusts |
17 May 2018 |
Share price/discount performance
Three-year performance vs index
Gearing
Analysts
|
|||||||||||||||||||||||||||||||||||||||||||||||||||||||||||||||||||||||||||||||||
Jupiter US Smaller Companies (JUS) aims to generate long-term capital growth from a focused portfolio of mid- and small-cap US equities. Since 2001, the trust has been managed by Robert Siddles. Following the announcement of adjustments to JUS’s investment process – running a more concentrated portfolio, a greater focus on selling underperforming holdings, while holding on to successful positions for longer – the trust has enjoyed an improvement in investment performance. It has delivered above market results in periods of both positive and negative stock market returns, illustrating its commitment to capital preservation. The board has also reduced JUS’s management fees, removed the performance fee and introduced the trust’s first gearing facility.
12 months ending |
Share price |
NAV |
US small-cap |
FTSE All-Share |
S&P 500 |
30/04/14 |
(2.8) |
12.3 |
9.6 |
10.5 |
11.0 |
30/04/15 |
3.7 |
9.7 |
19.0 |
7.5 |
24.1 |
30/04/16 |
1.2 |
(0.5) |
(2.8) |
(5.7) |
6.2 |
30/04/17 |
29.2 |
25.3 |
40.2 |
20.1 |
33.5 |
30/04/18 |
5.2 |
7.7 |
3.4 |
8.2 |
6.4 |
Source: Thomson Datastream. Note: All % on a total return basis in GBP.
Investment strategy: Disciplined, bottom-up selection
The manager employs a disciplined, bottom-up approach to stock selection, aiming to identify companies that are trading at a significant discount to their perceived intrinsic value. There is a three-step investment process involving quantitative and qualitative screening and in-depth fundamental analysis, including the construction of a detailed financial model. Gearing of up to 20% of total assets is now permitted; at end-April 2018, the trust had a net cash position of 1.5%.
Market outlook: Time to be more valuation-aware
US equities have performed strongly since early 2016, partly as a result of robust corporate profit growth, but also due to a broad upward revaluation of stocks. On a forward P/E multiple basis, US all-cap equities are trading towards the top end of the range over the last 10 years and at a 15% premium versus the average over this period. With higher company valuations and increased stock market volatility compared to very low levels in 2017, investors may wish to place emphasis on a fund with a disciplined approach to investing in deeply undervalued companies.
Valuation: Scope for discount to narrow
JUS’s current 8.0% share price discount to cum-income NAV is narrower than the averages of the last one and three years of 9.0% and 10.3% respectively, but wider than the 7.2% and 6.7% averages of the last five and 10 years. The board actively repurchases shares, aiming to ensure that the discount does not exceed 8% (in normal market conditions). There is scope for the discount to narrow if the manager continues to build on his improved recent investment performance.
Jupiter US Smaller Companies is a research client of Edison Investment Research Limited
Exhibit 1: Trust at a glance
Investment objective and fund background |
Recent developments |
||||||||||||||||||||||||||||||||||||||||||||||||||||||||||||||||||||||
Jupiter US Smaller Companies’ objective is to achieve long-term capital growth by investing in a diversified portfolio primarily of quoted US smaller and mid-sized companies. It uses a 2,000-stock US small and mid-cap index (capital returns, sterling adjusted) as its benchmark. |
■ 9 May 2018: Special resolution passed at general meeting to renew JUS’s share buyback authority. ■ 7 March 2018: Half-year report for the period ended 31 December 2017. NAV +7.4% and share price +7.5% versus +4.2% capital return for benchmark. ■ 10 October 2017: Annual results for the year ended 30 June 2017. NAV +22.2% and share price +30.1% versus +27.5% capital return for the benchmark (all in sterling terms). Fee reduction and new gearing facility announced. |
||||||||||||||||||||||||||||||||||||||||||||||||||||||||||||||||||||||
Forthcoming |
Capital structure |
Fund details |
|||||||||||||||||||||||||||||||||||||||||||||||||||||||||||||||||||||
AGM |
November 2018 |
Ongoing charges |
1.04% (31 December 2017) |
Group |
Jupiter Unit Trust Managers |
||||||||||||||||||||||||||||||||||||||||||||||||||||||||||||||||||
Annual results |
October 2018 |
Net cash |
1.5% |
Manager |
Robert Siddles |
||||||||||||||||||||||||||||||||||||||||||||||||||||||||||||||||||
Year end |
30 June |
Annual mgmt fee |
Tiered (see page 7) |
Address |
The Zig Zag Building, 70 Victoria Street, London SW1E 6SQ |
||||||||||||||||||||||||||||||||||||||||||||||||||||||||||||||||||
Dividend paid |
N/A |
Performance fee |
No |
||||||||||||||||||||||||||||||||||||||||||||||||||||||||||||||||||||
Launch date |
10 March 1993 |
Trust life |
Indefinite, subject to vote |
Phone |
+44 (0)20 3817 1000 |
||||||||||||||||||||||||||||||||||||||||||||||||||||||||||||||||||
Continuation vote |
Three-yearly, next 2020 |
Loan facilities |
$25m with Scotiabank |
Website |
|||||||||||||||||||||||||||||||||||||||||||||||||||||||||||||||||||
Portfolio exposure by sector (as at 30 April 2018) |
Share buyback policy and history (financial years) |
||||||||||||||||||||||||||||||||||||||||||||||||||||||||||||||||||||||
Weightings are adjusted for net cash (1.5% at end-April). |
JUS has the authority to allot up to 10% and buy back up to 14.99% of shares annually, to manage a premium or a discount. Buybacks are employed with the aim of maintaining the discount at a maximum of c 8%. |
||||||||||||||||||||||||||||||||||||||||||||||||||||||||||||||||||||||
|
|
||||||||||||||||||||||||||||||||||||||||||||||||||||||||||||||||||||||
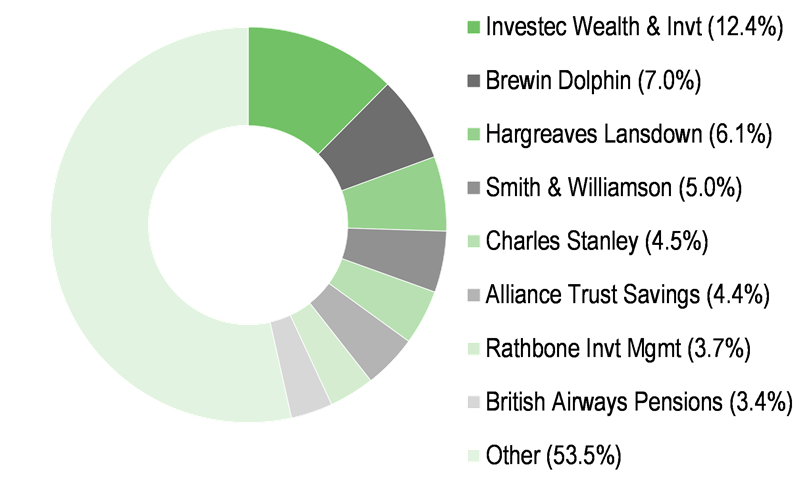
Shareholder base (as at 10 May 2018) |
Portfolio exposure by theme (as at 31 December 2017) |
||||||||||||||||||||||||||||||||||||||||||||||||||||||||||||||||||||||
|
|
||||||||||||||||||||||||||||||||||||||||||||||||||||||||||||||||||||||
Top 10 holdings (as at 30 April 2018) |
|||||||||||||||||||||||||||||||||||||||||||||||||||||||||||||||||||||||
|
|||||||||||||||||||||||||||||||||||||||||||||||||||||||||||||||||||||||
Source: Jupiter US Smaller Companies, Edison Investment Research, Bloomberg, Morningstar. Note: *N/A where not in April 2017 top 10.
Market outlook: More selectivity required
As shown in Exhibit 2 (left-hand side), both large and small-cap US equities have performed strongly since early 2016, meaningfully outperforming UK equities over the period in sterling terms. US equities, as measured by the US Datastream index, consistently trade at a premium to world equities. In absolute terms, the forward P/E multiple of the US market shares is 17.1x, which is towards the high end of the 10-year historical range, and 15% above the average over the last 10 years. While remaining lower than historical averages, US stock market volatility (as measured by the VIX index) is higher than the very subdued levels experienced in 2017. Against this investment backdrop, investors seeking exposure to US equities may wish to consider a fund focusing on deeply undervalued companies, which has a disciplined approach to stock selection.
|
Exhibit 2: Market performance and valuation |
|
Performance of US and UK indices (last five years, £) |
Valuation of US equities (using US Datastream index, as at 16 May 2018) |
|
|
|
Source: Thomson Datastream, Edison Investment Research |
|
Fund profile: Risk-aware approach to investment
JUS was launched in March 1993 as the F&C US Smaller Companies Trust. In 2014, manager Robert Siddles moved from F&C Asset Management to Jupiter Asset Management, taking the trust with him. He aims to generate long-term capital growth from a relatively concentrated portfolio of c 40-50 US small- and mid-cap equities, primarily in the $100m to $10bn market cap range. Siddles invests in two main types of value stocks – companies that can grow and compound over the long term, and recovery and turnaround situations, which are held with a shorter-term, two- to three-year view. He also aims to preserve capital during periods of stock market weakness. In 2017, the trust announced enhancements to its investment process, which includes running a more concentrated portfolio, and a reduced cost structure (pages 4 and 7). JUS does not pay dividends. Since end-September 2017 it has had the ability to employ gearing up to a maximum of 20% of total assets.
The fund manager: Robert Siddles
The manager’s view: Signs of a return to a value-led market
Siddles notes that JUS’s improved performance over the last six months has been partly due to stock selection, but was also helped by the trust’s lack of exposure to utilities and REITs, which have underperformed due to the sell-off in US government bonds. The manager also suggests that the outperformance of growth stocks may be coming to an end; growth stocks have performed more strongly than value stocks for most of the last decade. Evidence includes increased regulatory scrutiny for market-leading technology companies such as Facebook, and the launch of increasing numbers of growth funds – more funds are launched when they are easiest to sell, which tends to be late in a stock market trend. Recently, the manager attended an investment bank institutional conference in the US, where c 300 companies were presenting. He noticed a preponderance of growth fund managers, many of whom are too young to have experienced a bear stock market, or anything other than growth stock rather than value stock leadership. Siddles considers this interesting, as looking back over the very long term, reasonably priced companies have outperformed growth stocks. Data from Jupiter show that between 1927 and 2014, US value stock returns have compounded at an annual rate of 12.8%, compared to 10.3% for US growth stocks. The manager notes that within the US bellwether S&P 500 index, technology stocks – which are generally highly valued – are more than 20% of the total index. This level often marks a peak, as was seen with financials in 2007, consumer staples in the early 1990s and energy stocks in the early 1980s.
Asset allocation
Investment process: Disciplined, three-stage approach
Siddles employs a rigorous three-stage, bottom-up stock selection process, aiming to generate long-term capital growth, while limiting downside risk. The initial stage is a quantitative screen of c 3,000 stocks with market caps between $100m and $10bn, to identify companies that have suffered either short- or long-term share price weakness. The second stage is a qualitative risk assessment, aiming to identify and avoid value traps (companies that outwardly look attractively priced, but are unlikely to appreciate in value). In terms of style, there are certain sectors that the manager favours, including distribution companies and custodians of capital, while there are others he avoids, such as biotech and fashion. Siddles also considers industry cycles, including past bubbles, global capital flows and sector-specific problems. A potential investment must also pass all five elements of a ‘good company test’ to be considered for inclusion in JUS’s portfolio: a strong franchise; free cash flow generation; a high level of insider ownership; potential pricing flexibility; and a cheap valuation (at least 50% upside potential). Very few companies are able to pass all five levels of the test and progress to the third stage of the investment process, which is in-depth fundamental analysis, including the construction of a detailed financial model.
Portfolio holdings broadly fit into two categories: compounders, which can grow consistently and be held for a very long time; and recovery stocks, which are likely to be held for shorter periods. The manager frequently travels to the US to meet companies, many of which have little sell-side broker research coverage. The manager has followed through with enhancements to the investment process (announced in the FY17 results), aiming to improve the impact of good stock selection. He has increased the concentration in his highest-conviction positions, and been more ruthless in selling poorly performing companies, while letting his winning positions run for longer. Siddles believes that this is the correct strategy for an environment with lower than average stock market volatility. Stocks may be sold for fundamental reasons, including if there is a deterioration in its underlying business, if a company makes a large, non-core acquisition, or there is heavy insider selling; if a company’s valuation is no longer compelling, or its market cap becomes too large; or if a position becomes greater than 10% or a sector exceeds 15% of the total portfolio. The number of holdings has been reduced to 43, from 58 at end-FY17. Since the changes were implemented, investment performance has improved, and the trust has outperformed the benchmark in months of both positive and negative stock market returns.
Current portfolio positioning
At end-April 2018, JUS’s top 10 positions made up 34.8% of the portfolio. This was a marked increase in concentration compared to 22.5% at end-April 2017; just three positions were common to both periods. In terms of sector allocation (Exhibit 3), over the last 12 months to end-April, the largest increase was in financials (+6.6pp), while the largest decrease was in healthcare (-7.1pp) – sales included hospital chain Acadia Healthcare, home healthcare services company Almost Family and healthcare technology company HMS Holdings. Rising interest rates are positive for financial stocks as they generally contribute to higher profit margins. Over the last 12 months, new positions in this sector include top 10 holding Pacific Premier Bancorp, a commercial bank focused on small- and middle-market companies in Southern California and the Central California coast area. The company has a history of growing both organically and via acquisition. Since 2010, its assets have grown from $0.8bn to $8.0bn, which equates to an annual compound growth rate of c 40%. In addition to traditional commercial and real estate lending, the bank operates in niche businesses, such as lending to franchisees in the quick-service restaurant industry.
Exhibit 3: Portfolio sector exposure (% unless stated)
Portfolio end-April 2018 |
Portfolio end-April 2017 |
Change (pp) |
|
Financial services |
25.0 |
18.4 |
6.6 |
Producer durables |
19.1 |
14.2 |
4.9 |
Consumer discretionary |
15.6 |
20.6 |
(5.0) |
Healthcare |
9.5 |
16.6 |
(7.1) |
Technology |
9.5 |
11.5 |
(2.0) |
Materials & processing |
8.0 |
3.0 |
5.0 |
Energy |
6.2 |
5.1 |
1.1 |
Consumer staples |
3.8 |
5.9 |
(2.1) |
Utilities |
1.6 |
2.1 |
(0.5) |
Cash & (gearing) |
1.5 |
2.5 |
(1.0) |
100.0 |
100.0 |
Source: Jupiter US Smaller Companies, Edison Investment Research. Note: Numbers subject to rounding.
Another relatively new addition to the portfolio is GMS, a leading distributor of interior building products such as wallboard and suspended ceiling systems. While housing-related stocks have been out of favour due to rising interest rates, Siddles believes that the housing market has still not fully recovered from the great recession, and homebuilding remains below the natural replacement rate. The building products market (wallboard in particular) has seen a lot of consolidation in the last 10 years, so pricing is less volatile, because there are fewer competitors. GMS has recently announced the acquisition of WSB Titan, which is Canada's largest gypsum speciality dealer. The deal is expected to be earnings accretive, helped by meaningful cost synergies.
Within the consumer discretionary sector, Siddles has initiated a position in Gray Television. It has a high insider ownership and is attractively valued, with a prospective 15% free cash flow yield. Gray operates in smaller markets, where its TV stations are all rated number one or two. It focuses on local programming, which insulates the company from the pressures faced by national networks that are losing market share to online advertising. Gray currently operates in 57 markets and has been purchasing smaller stations; its increased scale means that the company is able to negotiate better retransmission fees (the money that TV stations receive from cable and satellite providers for the right to carry their signals).
Performance: Benefits from enhanced process
JUS’s relative returns are shown in Exhibit 5. The trust has outperformed its US small-cap equity benchmark over the last one and 10 years, while lagging over three and five years. Adjustments to the investment process – reducing the number of holdings to concentrate on the manager’s highest-conviction ideas, selling underperforming companies more quickly, and letting winning positions run for longer – appear to be bearing fruit, as JUS has outperformed its US small-cap equity benchmark by a meaningful amount over the last six months, in both NAV and share price terms (6.6% and 5.9% respectively). Over this period the top contributor to performance was JUS’s largest holding, deep discount retailer Ollie’s Bargain Outlet. The company is benefiting from Amazon’s disruption of the retail sector, which is leading to more available stock for Ollie’s, allowing it to deliver strong same-store sales growth. Other positive contributors include Amplify Snack Brands, which struggled following its acquisition of UK snack company Tyrrells, but subsequently received a takeover bid from US confectionery firm The Hershey Company; and leading regional carrier Old Dominion Freight Line, which is benefiting from market share gains following decades of investment in its operations. Positions that have performed less well over the last six months include Acadia Healthcare (now sold), which is experiencing execution issues following its acquisition of the UK mental healthcare chain, the Priory Group; and Lionsgate Entertainment, which has been subject to profit taking following announcements that it would be producing fewer films (the manager believes this is short term in nature), and increasing capex in its cable business.
|
Exhibit 4: Investment trust performance to 30 April 2018 in sterling |
|||||||||
Price, NAV and benchmark total return performance, one-year rebased |
Price, NAV and benchmark total return performance (%) |
||||||||
|
|
||||||||
|
Source: Thomson Datastream, Edison Investment Research. Note: Three-, five- and 10-year performance figures annualised. |
|||||||||
|
Exhibit 5: Share price and NAV total return performance, relative to indices (%) |
|||||||||
|
One month |
Three months |
Six months |
One year |
Three years |
Five years |
10 years |
||
Price relative to US small-cap equities |
(1.0) |
0.1 |
5.9 |
1.8 |
(2.4) |
(24.5) |
11.6 |
||
NAV relative to US small-cap equities |
0.2 |
2.1 |
6.6 |
4.1 |
(4.9) |
(10.2) |
12.8 |
||
Price relative to FTSE All-Share |
(4.5) |
0.1 |
2.5 |
(2.7) |
12.3 |
(4.7) |
81.0 |
||
NAV relative to FTSE All-Share |
(3.3) |
2.1 |
3.3 |
(0.5) |
9.4 |
13.5 |
82.9 |
||
Price relative to S&P 500 |
(0.6) |
4.0 |
4.6 |
(1.1) |
(8.7) |
(33.2) |
1.3 |
||
NAV relative to S&P 500 |
0.7 |
6.0 |
5.4 |
1.2 |
(11.1) |
(20.5) |
2.4 |
||
|
Source: Thomson Datastream, Edison Investment Research. Note: Data to end-April 2018. Geometric calculation. |
|||||||||
|
Exhibit 6: NAV performance relative to US small-cap equities over 10 years, in sterling |
|||||||||
|
|||||||||
|
Source: Thomson Datastream, Edison Investment Research |
|||||||||
Discount: Active discount control mechanism
JUS’s current 8.0% share price discount to cum-income NAV compares to the range of discounts over the last 12 months of 4.7% to 13.3%. It is narrower than the averages of the last one and three years (9.0% and 10.3% respectively), but wider than the 7.2% average discount over the last five years, and 6.7% over the last 10 years. The board employs a discount control mechanism, regularly repurchasing shares, ensuring the discount remains below 8% in normal market conditions (Exhibit 1). So far in FY18, 4.9m shares have been repurchased at a cost of £41.4m (25.1% of shares outstanding at end-FY17). The trust has recently received shareholder approval to renew its authority to repurchase up to 14.99% of its shares before the November 2018 AGM. There is potential for JUS’s discount to narrow, if the manager continues to build on the trust’s recent improved investment performance.
|
Exhibit 7: Share price discount to NAV (including income) over three years (%) |
|
|
Source: Thomson Datastream, Edison Investment Research |
Capital structure and fees
JUS is a conventional investment trust, with one class of share; there are currently 15.0m ordinary shares in issue. Due to the trust’s active discount management programme, the number of shares outstanding has declined by 25.1% so far in FY18. JUS was historically ungeared, but effective from end-September 2017, the trust now has a $25m flexible loan agreement with Scotiabank. At end-April 2018, JUS had a net cash position of 1.5%.
The trust’s FY17 annual results also included details of a revised fee structure. Jupiter Unit Trust Managers now receives a management fee of 0.75% of net assets up to £150m, 0.65% between £150m and £250m, and 0.55% above £250m (previously a flat fee of 0.80%). A performance fee is no longer payable (last paid in FY14). In H118, JUS’s ongoing charges were 1.04%, modestly higher than 1.01% in FY17.
Dividend policy and record
Reflecting its focus on capital growth rather than income, JUS does not pay a dividend. Also, US smaller companies are not a high yielding asset class. In FY17, the trust’s £1.3m revenue income was more than offset by management fees and other expenses.
Peer group comparison
JUS is a member of the AIC North American Smaller Companies sector, which contains just three trusts, one of which invests in both UK and US smaller companies (both listed and unquoted). While JUS has a value bias, JPMorgan US Smaller Companies has a growth bias. To enable a broader comparison, Exhibit 8 also shows the sterling share classes of open-ended US smaller companies funds, including the Jupiter US Small and Midcap Companies Fund, also managed by Siddles. Within the closed-end funds, JUS is above average over one year while lagging over three, five and 10 years (a period characterised by the outperformance of growth rather than value stocks). The trust has outperformed the one-year average of the open-ended funds, while lagging over the other periods shown, although it has outperformed its sister fund over both one and three years. JUS has the lowest ongoing charge of the three closed-end peers, and no performance fee is payable. The trust does not pay a dividend.
Exhibit 8: Selected peer group as at 14 May 2018 (all in sterling)*
% unless stated |
Market |
NAV TR |
NAV TR |
NAV TR |
NAV TR |
Ongoing |
Perf. |
Discount |
Net |
Dividend |
Jupiter US Smaller Companies |
143.2 |
14.7 |
41.9 |
68.8 |
259.2 |
1.0 |
No |
(8.0) |
98 |
0.0 |
JPMorgan US Smaller Companies |
172.1 |
9.2 |
66.1 |
118.0 |
320.4 |
1.3 |
No |
0.1 |
106 |
0.8 |
North Atlantic Smaller Cos |
388.8 |
11.4 |
47.0 |
103.6 |
210.0 |
1.1 |
Yes |
(24.6) |
100 |
0.0 |
Peer group average |
234.7 |
11.8 |
51.7 |
96.8 |
263.2 |
1.2 |
(10.9) |
101 |
0.3 |
|
JUS rank in sector |
3 |
1 |
3 |
3 |
2 |
3 |
2 |
3 |
2 |
|
Open-ended funds |
||||||||||
Allianz US Small Cap Equity |
3.2 |
6.0 |
27.7 |
|
|
2.1 |
No |
0.0 |
||
Artemis US Smaller Companies |
299.9 |
18.4 |
72.6 |
|
|
0.9 |
No |
0.0 |
||
F&C US Smaller Comp Fd |
67.8 |
7.1 |
49.0 |
86.7 |
284.0 |
0.8 |
No |
0.1 |
||
GS US Sm Cp CORE Eq |
249.6 |
13.4 |
56.9 |
104.2 |
285.9 |
0.9 |
No |
0.3 |
||
Hermes US Smid Equity |
775.1 |
5.2 |
47.9 |
93.9 |
|
0.9 |
No |
0.0 |
||
JPM US Smaller Companies |
164.0 |
28.6 |
77.6 |
132.0 |
308.0 |
0.9 |
No |
0.0 |
||
Jupiter US Small and Midcap Cos |
13.6 |
10.8 |
35.3 |
|
|
1.1 |
No |
0.0 |
||
Legg Mason IF Royce US Smlr Cos |
208.4 |
8.0 |
41.4 |
69.8 |
157.6 |
1.0 |
No |
0.3 |
||
Legg Mason RY US SmCp Opp |
915.1 |
10.8 |
54.9 |
83.7 |
246.7 |
2.0 |
No |
0.0 |
||
Neuberger Berman US Sm Cap |
284.3 |
7.8 |
52.2 |
82.5 |
|
1.9 |
No |
0.0 |
||
Schroder US Smaller Comp |
790.4 |
6.8 |
52.5 |
101.7 |
234.7 |
0.9 |
No |
0.1 |
||
T. Rowe Price US Smlr Cos Eq |
1,009.2 |
11.5 |
56.5 |
111.6 |
347.5 |
1.1 |
No |
0.0 |
||
Threadneedle Amer Smlr Cos |
1,513.3 |
5.8 |
43.9 |
100.6 |
311.1 |
0.9 |
No |
0.2 |
||
Peer group average |
484.2 |
10.8 |
51.4 |
96.7 |
271.9 |
1.2 |
0.2 |
Source: Morningstar, Edison Investment Research. Note: *Performance data to 11 May 2018. TR=total return. Net gearing is total assets less cash and equivalents as a percentage of net assets (100 = ungeared).
The board
There are five directors on JUS’s board; all are non-executive and independent of the manager. Chairman Gordon Grender has been a director since the trust’s inception in 1993, and assumed his current role in October 1998. Since June 2007, the senior independent director is Norman Bachop, who joined the board in February 1999. The other three directors and their dates of appointment are Peter Barton (February 1998), Clive Parritt (January 2007) and Lisa Booth (September 2015). The directors have experience in investment management, investment banking, law and accountancy.
|
|
Research: TMT
The 50% increase in net profit in FY17 was delivered to budget and forecasts. We maintain our forecast for a further 45% increase in EBITDA in FY18, underpinned by existing relationships and returning brands. As Mondo scales up, new opportunities are presenting themselves: a potential minority investment in a new theme park in China provides evidence of the group’s widening ambitions as its licensing business grows. The weakness in the share price this year leaves the company at a 40-50% discount to slower growing peers.