Last close As at 06/08/2026
GBP1.18
— 0.00 (0.00%)
Market capitalisation
—
Research: Investment Companies
The Diverse Income Trust
Written by
The Diverse Income Trust |
Small caps best insulated from macro headwinds |
Investment trusts |
15 February 2017 |
Share price/discount performance
Three-year performance vs index
Gearing
Analysts
|
||||||||||||||||||||||||||||||||||||||||||||||||||||||||||||||||||||||||||||||||
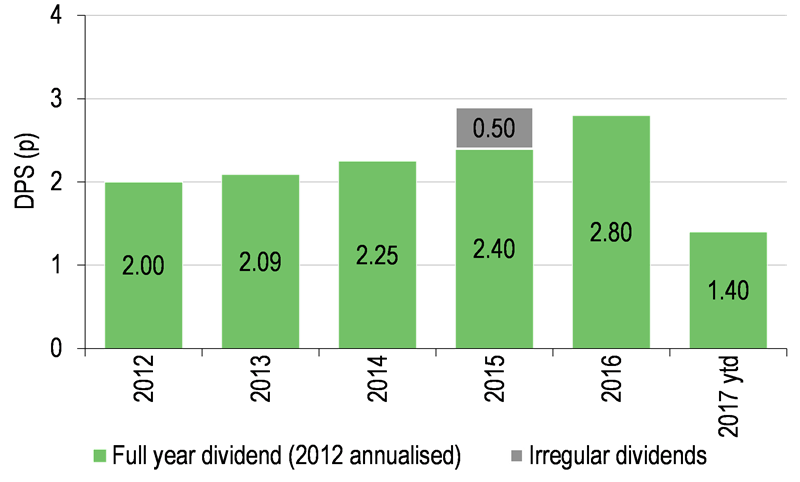
The Diverse Income Trust (DIVI) invests in UK stocks from across the market cap spectrum that have strong prospects for sustainable dividend growth. This all-cap income generating strategy was developed by Gervais Williams and Martin Turner of Miton Asset Management. The c 145 stock portfolio provides a broad spread of investments and has a strong bias towards dividend-growing smaller companies. In terms of NAV total return, the trust has generated +125% over five years, ranking it second in its 23-strong peer group (the Association of Investment Companies’ UK Equity Income sector). Since launch, DIVI’s annual dividend has grown from 2.0p in FY12 to 2.8p in FY16 and it has built a substantial revenue reserve.
12 months ending |
Share price |
NAV |
FTSE All- |
FTSE 350 High Yield (%) |
FTSE Small Cap Index (%) |
31/01/13 |
39.2 |
28.9 |
16.3 |
16.4 |
33.6 |
31/01/14 |
38.0 |
43.3 |
10.1 |
9.7 |
40.3 |
31/01/15 |
(2.7) |
1.5 |
7.1 |
6.1 |
(5.1) |
31/01/16 |
21.3 |
14.3 |
(4.6) |
(9.1) |
5.8 |
31/01/17 |
2.3 |
5.1 |
20.1 |
25.8 |
20.8 |
Source: Thomson Datastream. Note: All % on a total return basis in pounds sterling.
Investment strategy: To unearth hidden value
DIVI’s managers hold a diverse portfolio of stocks that exhibit strong potential for sustainable dividend growth. The aim is to purchase such stocks when overlooked by the rest of the market. Currently these opportunities are seen to be most prevalent among small companies, not simply due to there being many more companies from which to choose (c 1,250), but also because of the lack of sell-side analyst coverage, which makes the market less efficient and presents opportunities for those with the expertise to do their own research. Whereas most UK equity funds invest primarily in the UK’s largest 350 companies by market cap, DIVI’s investments include a significant allocation to small caps and AIM stocks.
Market outlook: Positive for nimble small caps
While remaining positive regarding the availability of new investment opportunities, DIVI’s managers note the high valuations and low dividend cover on certain widely owned larger cap stocks. This makes them less attractive should bond yields continue to rise and world growth falter. In their view, nimble smaller companies currently offer better value and are better placed to defend profit margins and grow sales volumes, than their more mature, but less agile, large-cap brethren.
Valuation: Low discount volatility anticipated
DIVI’s share price has consistently traded close to NAV since launch and there is reason to anticipate continuing low discounts ahead; the potential for further share issuance should prevent excess demand, while DIVI’s redemption facility should help prevent oversupply. The current premium to cum-income NAV is 1.2%, compared with an average premium of 1.8% since launch in April 2011.
Exhibit 1: Trust at a glance
Investment objective and fund background |
Recent developments |
|||||||||||||||||||||||||||||||||||||||||||||||||||||||||||||||||||
The Diverse Income Trust’s objective is to provide an attractive and growing level of dividends, coupled with some capital growth over the longer term. It invests in a diversified portfolio primarily of quoted or traded UK companies, with a bias to small- and mid-cap stocks. It may also invest in FTSE 100 companies where the manager believes this will increase shareholder value. As a stock-specific portfolio, there is no benchmark, but DIVI targets income growth higher than other income funds. |
■ 1 February 2017: Half-yearly report for the six months ended 30 November 2016. NAV TR +1.5% compared with +7.6% for FTSE All-Share. ■ 1 February 2017: Second quarterly interim dividend of 0.7p per share declared for the year ending 31 May 2017. ■ 12 August 2016: Annual results for the year ended 31 May 2016. NAV TR +4.6% compared with -6.3% for FTSE All Share Index. Dividends up 12.0% on FY15. |
|||||||||||||||||||||||||||||||||||||||||||||||||||||||||||||||||||
Forthcoming |
Capital structure |
Fund details |
||||||||||||||||||||||||||||||||||||||||||||||||||||||||||||||||||
AGM |
October 2017 |
Ongoing charges |
1.18% |
Group |
Miton Group |
|||||||||||||||||||||||||||||||||||||||||||||||||||||||||||||||
Final results |
August 2017 |
Gearing |
0% |
Manager |
Gervais Williams, Martin Turner |
|||||||||||||||||||||||||||||||||||||||||||||||||||||||||||||||
Year end |
31 May |
Annual mgmt fee |
1.0% of market cap (0.8% above £300m) |
Address |
6th floor, Paternoster House, |
|||||||||||||||||||||||||||||||||||||||||||||||||||||||||||||||
Dividend paid |
Quarterly |
Performance fee |
None |
|||||||||||||||||||||||||||||||||||||||||||||||||||||||||||||||||
Launch date |
28 April 2011 |
Trust life |
Indefinite |
Phone |
+44 (0) 20 3714 1501 |
|||||||||||||||||||||||||||||||||||||||||||||||||||||||||||||||
Continuation vote |
No |
Loan facilities |
See page 7 |
Website |
||||||||||||||||||||||||||||||||||||||||||||||||||||||||||||||||
Dividend policy and history (financial years) |
Share buyback policy and history (financial years) |
|||||||||||||||||||||||||||||||||||||||||||||||||||||||||||||||||||
Quarterly dividends are paid in February, May, August and November. DIVI distributes substantially all of its income, net of costs, annually. |
Renewed annually, DIVI has authority to purchase up to 14.99% and allot up to 10% of issued share capital. Subject to directors’ discretion, DIVI offers investors an annual facility to redeem all or part of their shareholding at NAV minus costs |
|||||||||||||||||||||||||||||||||||||||||||||||||||||||||||||||||||
|
|
|||||||||||||||||||||||||||||||||||||||||||||||||||||||||||||||||||
Shareholder base (as at 18 January 2017) |
Portfolio exposure by market segment (as at 30 November 2016) |
|||||||||||||||||||||||||||||||||||||||||||||||||||||||||||||||||||
|
|
|||||||||||||||||||||||||||||||||||||||||||||||||||||||||||||||||||
Top 10 holdings (as at 31 December 2016) |
||||||||||||||||||||||||||||||||||||||||||||||||||||||||||||||||||||
|
||||||||||||||||||||||||||||||||||||||||||||||||||||||||||||||||||||
Source: The Diverse Income Trust, Edison Investment Research, Bloomberg, Morningstar. Note: *These holdings were in the top 20 but were not listed in the top 10 at 31 December 2015. **N/A where not in top 20 at 31 December 2015.
Market outlook: Large caps lose bond yield support
After over two decades of declining bond yields, a major change occurred in 2016 as bond yields finally troughed, signifying to many the end to ever-cheaper borrowing rates. It is arguably this support from falling bond yields, and market participants’ hunger for income, that has pushed large-cap equity valuations to the top end of their historical range, and encouraged dividend payout ratios to rise. Even if bond yields do not rise sharply or quickly from here, the widely accepted notion that they have stopped falling could be enough to eat away at valuations as the global hunt for yield becomes less intense.
Countries, corporates and consumers continue to be burdened by high levels of debt. Meanwhile, deflationary pressure from technology advancement and deregulated markets continues to erode margins. In the medium term, a new US president with radical fiscal, spending and trade protection plans has arguably cast a further cloud of uncertainty over the earnings growth outlook for large corporates. So far, however, President Trump’s policy plans have been well received by equity markets, as investors focus on lower tax and higher spending, rather than on protectionism and geopolitical risk.
Amid such macroeconomic uncertainty, the DIVI managers’ enthusiasm for smaller companies has rarely been stronger. While 2016 saw income-generating smaller company share prices lag those of larger companies, DIVI’s managers have observed no such relative setback at the operational level, with smaller, dividend-paying stocks seeing continuing dividend growth. The all-cap strategy offers the managers a large and fertile hunting ground in which to find well-managed, under-researched businesses trading on what they view as compelling valuations. Those who share the view that the best long-term income growth opportunities currently reside in smaller companies, and who agree with the logic of having income diversification across the market cap spectrum, as well as by sector and number of holdings, might consider looking more closely at an actively managed all-cap income growth fund such as this.
Fund profile: Different by design
DIVI was launched in April 2011 to satisfy growing investor demand for reliable income and capital growth in a low-growth world. It was felt that such needs would be best met by a fund that was permitted to invest in UK companies across the market capitalisation spectrum, maximising the prospect of generating an attractive and increasing level of income from a stable and growing capital base. The fund is managed by Gervais Williams and Martin Turner at Miton Asset Management. Both have significant small- and large-cap expertise and have had a close working relationship since 2004. In order to achieve broad diversification and take advantage of the widest opportunity set, the majority of DIVI’s portfolio comprises stocks outside the FTSE 350 Index, including AIM-, FTSE Small-Cap- and ISDX-listed stocks. So while most UK funds select from a relatively small group of 350 widely researched stocks, DIVI fishes in an under-researched, c 1,600-stock pool.
The managers also run an equivalent open-ended investment company (OEIC), Miton UK Multi Cap Income. Demand has been strong for the multi-cap income strategy, with the OEIC reaching £760m of assets under management and DIVI having grown from £50m at launch to c £350m currently, through a combination of strong absolute returns, share issuance and a merger with the Miton Income Opportunities investment trust in 2013.
The fund managers: Gervais Williams & Martin Turner
The managers’ view: Clouds gather on the horizon
“Productivity growth has peaked while bond yields have bottomed”, observed Gervais Williams in January 2017. In his and Martin Turner’s view, both these factors have negative ramifications for financial markets. Equity markets in particular have two new headwinds to contend with: slowing productivity growth adversely affects future returns on equity, while rising bond yields are seen as negative for valuations.
The managers believe the gradual fall in bond yields and deposit rates seen globally over the last 25 years has encouraged savers and pension funds to move up the risk spectrum. In this declining interest rate environment, in order to assuage their thirst for income, savers had little choice but to buy higher yielding bonds and equities. Real income growth became harder to achieve as widespread government asset purchase schemes known as quantitative easing further drove down bond yields, punishing savers and making equity dividend yields look even more attractive in relative terms. And so it went on; the more bond yields fell, the more support they lent to equity valuations. The flipside of this has concerned Williams and Turner since 2013: what happens, they asked, when bond yields rise again? In the last quarter of 2016 government bond yields rose sharply as it became apparent that the path of future US interest rate rises had steepened, while higher yielding UK equities with bond-like characteristics retreated. But there is further downside risk.
Eight years on from the global financial crisis, Williams reports that the forward P/E multiple on the FTSE All-Share Index has moved from 9x to 17x (Bloomberg), much of the re-rating reflecting falling bond yields. Dividend payout ratios have risen, and productivity gains for the UK’s major listed companies are expected to slow. Efficiencies have been achieved but pricing power has been eroded in many sectors. Should we now be entering a prolonged period of rising bond yields and higher deposit rates, then arguably savers and pension fund managers will revert back down the risk spectrum, selling equities in favour of cash deposits. In short, the next few years could presage a tough time for equity markets during which they face the prevailing headwind of rising bond yields. Whatever the case, the managers believe that nimble smaller companies can better defend margins than large corporates operating in mature markets, and that DIVI’s all-cap strategy affords them greater scope to navigate choppier waters ahead.
Asset allocation
Investment process: Keen to kick tyres and get their hands dirty
DIVI selects investments from a broad universe of c 1,600 companies across the whole UK stock market. The managers do not rely on in-house analysts or external research teams to do their analytical modelling for them. Not only do the managers meet a large number of companies each month, they also do their own analysis as part of their due diligence process before making an investment. They may then compare their findings with the models of external analysts, before deciding on whether to invest. In this way there is full accountability in stock selection; Williams and Turner know how a company’s ‘engine’ works and view “getting their hands dirty” as an essential part of assessing future upside potential. For DIVI they are broadly seeking stocks – regardless of size – that already pay attractive dividends and whose management teams have a viable strategy to grow profits, be it by improving productivity through rationalisation, introducing a new range, building a better plant, or selling off part of the business.
The managers view companies with good and growing turnover, sustained or improving margins and little or no debt as those with the best risk/reward prospects. Any deterioration in these measures will result in the reassessment of holdings and could lead to stocks being sold. In the current stiff pricing environment, DIVI’s managers are paying extra attention to managements’ ability to defend their company’s profit margin. In particular, they are keen to hear managements’ strategy for improving customer service, as this is one of the few remaining ways in which companies can beat the competition. Williams notes that the decreasing research coverage of smaller companies (many small stocks are now only covered by their house broker) means there are more chances for a fund manager to spot under-appreciated opportunities. Unlike some of the peer group, which emphasise low portfolio turnover and a long-term investment approach, DIVI has a commercial approach – everything in the portfolio is for sale and, if the price is right, it will be sold.
Current portfolio positioning
As the name might suggest, Diverse Income Trust seeks to limit stock-specific risk, through selecting a large number (c 145) of relatively small holdings. This means that although DIVI’s portfolio contains a number of multinational giants such as BAT, Aviva and Royal Dutch Shell, the size of each holding is typically around 1% of NAV, well below their weighting in the FTSE All-Share Index. Given this stance, it is unlikely that the trust will ever have a high weighting in the oil and gas sector, which is dominated by a few very large companies. DIVI’s 40 largest holdings represent around 50% of NAV, and the largest equity holding, Burford Capital, represented just 2.4% of net assets at 31 December 2016. Reflecting perceived attractive income growth opportunities among smaller companies and concern that UK large-caps are most vulnerable to a global market setback, nearly two-thirds of the portfolio is invested in AIM, FTSE Small-Cap and FTSE Fledgling stocks.
The significant depreciation of sterling since mid-2016 has encouraged opportunistic foreign buyers to target UK companies, and this is expected to continue through 2017. While this ought to be positive for share prices in the short term, DIVI’s managers are concerned that UK smaller company managements are prone to sell out too cheaply, and seek to remedy this through dialogue.
Exhibit 2: Portfolio sector exposure vs FTSE All-Share Index (% unless stated)
Portfolio end-November 2016 |
Portfolio end-November 2015 |
Change |
Index |
Active weight |
Trust weight/ index weight (x) |
|
Financials |
27.6 |
28.2 |
-0.6 |
25.8 |
1.8 |
1.1 |
Industrials |
19.2 |
20.0 |
-0.8 |
10.9 |
8.3 |
1.8 |
Consumer services |
19.0 |
20.6 |
-1.6 |
11.6 |
7.4 |
1.6 |
Consumer goods |
8.6 |
6.9 |
1.7 |
14.5 |
-5.9 |
0.6 |
Technology |
6.4 |
5.3 |
1.1 |
0.9 |
5.5 |
7.4 |
Basic materials |
6.1 |
5.5 |
0.6 |
7.1 |
-1.0 |
0.9 |
Telecommunications |
3.5 |
4.7 |
-1.2 |
4.1 |
-0.6 |
0.9 |
Oil & gas |
2.9 |
2.0 |
0.9 |
12.5 |
-9.6 |
0.2 |
Healthcare |
1.5 |
1.6 |
-0.1 |
9.1 |
-7.6 |
0.2 |
Utilities |
0.8 |
0.8 |
0.0 |
3.6 |
-2.8 |
0.2 |
Cash/fixed interest and other |
4.4 |
4.4 |
0.0 |
0.0 |
4.4 |
N/A |
100.0 |
100.0 |
100.0 |
Source: The Diverse Income Trust, Edison Investment Research
In sector terms, the portfolio is most heavily exposed to financials, industrials and consumer services. The lowest weightings are in the utilities, healthcare and oil & gas sectors. The managers note that, counterintuitively, global corporate capital expenditure (capex) by the healthcare sector is lower than that of the industrials sector. They also note that not all capex is productive, citing the energy sector, where returns on capex have been adversely impacted by the fall in the oil price. They conclude that often the best capex returns are made in specialist niches, or by those where modest investment can generate a quick payback. Successful portfolio examples include Stobart and IG Design Group. Both managements had plans to improve productivity with defined payback periods and both are now delivering ahead of expectations.
Sector weightings have not changed much over the year. The sell-off in tobacco stocks in Q416, when bond yields reversed, prompted the purchase of BAT, while the unexpected outcome of the Brexit referendum prompted the timely sale of the holding in EasyJet.
The FTSE 100 put option
As a form of protection against a sharp fall in mainstream equity markets, DIVI owns a FTSE 100 Index put option. If the index falls below 6,000 (down by around 15% from current levels), before expiry of the option in March 2018, then the option will be “in the money”. The cost of the option is c 0.06% of NAV per month and it is tradeable in the market, its value sensitive to changes in the level of the index and the remaining time left until expiry.
Performance: Solid long-term income and capital return
As already highlighted, smaller companies’ underperformance relative to large companies in 2016 in share price terms was not mirrored, in DIVI’s managers’ view, at the operational level, with smaller dividend-paying stocks seeing decent profit growth. Thus, while share prices may vacillate over the short term for all manner of reasons, often proving unwarranted, what is of most importance to Williams and Turner is how the portfolio companies are performing at the operational level. They argue that it is primarily underlying profit and dividend growth that will grow the value of the company, with short-term movements in share prices being outside managements’ control. Although DIVI’s short-term relative performance has been weaker over one year (Exhibit 3), it has improved over the last six months and remains comfortably ahead of the mainstream indices over five years. As with all actively managed funds, returns will not be in a straight line and given DIVI’s all-cap approach, its NAV is not expected to correlate with any particular index.
|
Exhibit 3: Investment trust performance to 31 January 2017 |
|
Price, NAV and benchmark total return performance, one-year rebased |
Price, NAV and benchmark total return performance (%) |
|
|
|
Source: Thomson Datastream, Edison Investment Research. Note: Three- and five-year and since inception (SI, 28 April 2011) performance figures annualised. |
|
Exhibit 4: Share price and NAV total return performance, relative to indices (%)
|
One month |
Three months |
Six months |
One year |
Three years |
Five years |
SI |
Price relative to FTSE All-Share |
0.1 |
0.9 |
(4.3) |
(14.8) |
(1.5) |
47.6 |
44.7 |
NAV relative to FTSE All-Share |
0.6 |
(1.4) |
(1.4) |
(12.5) |
(0.5) |
43.5 |
48.5 |
Price relative to FTSE 350 High Yield |
0.5 |
0.9 |
(6.0) |
(18.7) |
(0.5) |
49.5 |
41.3 |
NAV relative to FTSE 350 High Yield |
1.0 |
(1.4) |
(3.2) |
(16.4) |
0.5 |
45.3 |
45.0 |
Price relative to FTSE Small-Cap Index |
(1.5) |
(3.6) |
(7.8) |
(15.3) |
(0.4) |
2.0 |
7.4 |
NAV relative to FTSE Small-Cap Index |
(1.0) |
(5.8) |
(5.1) |
(13.0) |
0.6 |
(0.8) |
10.2 |
Source: Thomson Datastream, Edison Investment Research. Note: Data to end-January 2017. Geometric calculation.
|
Exhibit 5: NAV total return performance relative to FTSE All-Share index over three years |
|
|
Source: Thomson Datastream, Edison Investment Research |
Capital structure and fees
DIVI is a conventional investment trust with 383.5m ordinary shares in issue. Miton Trust Managers is paid an annual management fee of 1.0% up to £300m market capitalisation, reducing to 0.8% above this. Fees and financing costs are charged 75% to capital and 25% to income. For the half-year ended 30 November DIVI’s ongoing charges were 1.18%. The trust has an overdraft facility and is permitted to gear up to 15% of NAV. At 31 December 2016 the trust was ungeared.
Dividend policy and record
Dividends are paid quarterly in February, May, August and November. The total dividend for FY16 was 2.8p per share, a rise of 12% on the previous year. So far in FY17 two fully covered dividends of 0.7p have been declared and the managers are positive regarding portfolio dividend cover and the earnings outlook for the rest of the year. DIVI’s revenue reserve is now greater than the approximate cash cost of paying one year’s total dividend. This means that should there ever be a year in which there is a shortfall in dividend income received, the dividend paid out to shareholders can nonetheless be maintained or increased by drawing on this reserve.
Peer group comparison
Exhibit 7 shows the 12 largest funds in the AIC UK Equity Income peer group of 23. DIVI ranks first of the funds shown below for NAV total return over five years. Over the last 12 months, NAV total return performance, while positive, has not been as strong, reflecting its high weighting (c 37%) in dividend-paying AIM stocks, which saw share prices lag large caps in 2016. Ongoing charges are above the average, but unlike some peers, DIVI does not levy a performance fee. While DIVI has a gearing facility, it is intended for use after a significant market setback. It therefore remains undrawn, which contrasts with the weighted peer group average net gearing of 9%.
Exhibit 7: Selected peer group as at 14 February 2017
% unless stated |
Market |
NAV TR |
NAV TR |
NAV TR |
Sharpe |
Sharpe |
(Discount)/ |
Ongoing |
Perf. |
Net |
Dividend |
Diverse Income Trust |
362.4 |
9.2 |
22.1 |
118.8 |
(0.5) |
(0.3) |
2.9 |
1.2 |
No |
100 |
3.1 |
City of London |
1,369.0 |
22.9 |
24.4 |
71.2 |
0.2 |
(0.2) |
(0.1) |
0.4 |
No |
107 |
4.0 |
Dunedin Income Growth |
373.5 |
30.8 |
17.1 |
54.1 |
0.5 |
(0.3) |
(9.6) |
0.6 |
No |
113 |
4.6 |
Edinburgh Investment |
1,379.5 |
17.8 |
35.1 |
82.2 |
(0.1) |
(0.0) |
(5.0) |
0.6 |
No |
115 |
3.5 |
F&C Capital & Income |
285.9 |
31.8 |
27.0 |
64.8 |
0.5 |
(0.1) |
(0.2) |
0.7 |
No |
106 |
3.6 |
Finsbury Growth & Income |
998.2 |
26.2 |
39.6 |
117.9 |
0.4 |
0.1 |
0.8 |
0.7 |
No |
103 |
2.0 |
JPMorgan Claverhouse |
351.1 |
30.8 |
23.8 |
76.0 |
0.4 |
(0.2) |
(9.6) |
0.8 |
No |
113 |
3.6 |
Lowland |
398.0 |
37.0 |
20.7 |
92.5 |
0.7 |
(0.2) |
(4.9) |
0.6 |
Yes |
110 |
3.1 |
Merchants Trust |
513.2 |
31.2 |
13.7 |
58.2 |
0.5 |
(0.3) |
(6.7) |
0.6 |
No |
119 |
5.1 |
Murray Income Trust |
501.7 |
29.0 |
19.8 |
57.4 |
0.5 |
(0.3) |
(8.2) |
0.8 |
No |
106 |
4.3 |
Perpetual Income & Growth |
892.2 |
12.7 |
18.8 |
83.5 |
(0.3) |
(0.3) |
(8.0) |
0.7 |
Yes |
117 |
3.5 |
Temple Bar |
864.1 |
34.5 |
21.4 |
75.9 |
0.6 |
(0.2) |
(2.7) |
0.5 |
No |
101 |
3.1 |
Weighted average |
24.0 |
25.4 |
80.1 |
0.2 |
(0.2) |
(4.0) |
0.7 |
109 |
3.6 |
||
Rank (out of 23 funds) |
10 |
22 |
12 |
2 |
22 |
20 |
2 |
5 |
18 |
21 |
Source: Morningstar, Edison Investment Research. Note: TR=total return. Sharpe ratio is a measure of risk-adjusted return. The ratios shown are calculated by Morningstar for the past 12- and 36-month periods by dividing a fund’s annualised excess returns over the risk-free rate by its annualised standard deviation. Net gearing is total assets less cash and equivalents as a percentage of net assets.
The board
DIVI has five directors. Chairman Michael Wrobel, Senior Independent Director Jane Tufnell, Paul Craig and Lucinda Riches have all served on the board since the trust’s launch in April 2011. The most recent appointment is Calum Thomson, who joined the board at the start of this year and replaces Tom Bartlam as chairman of the audit committee. The directors have backgrounds in fund management, investment banking and corporate finance.
|
|