Last close As at 05/08/2026
EUR21.35
▲ 0.05 (0.23%)
Market capitalisation
EUR376m
Research: Investment Companies
Deutsche Beteiligungs (DBAG) posted a NAV total return (TR) of 35.3% in FY21 (to end-September 2021). This return is in line with public and private equity (PE) markets and followed a weaker FY18–19 amid an industrial slowdown in Germany. Performance was driven by the revaluation of existing holdings (mostly broadband/telecom and IT/software) on the back of both earnings growth and multiples expansion. Additional uplift came from selected disposals/refinancings. Management proposed a dividend of €1.60 per share from FY20 earnings, which implies a solid 4.1% yield.
Deutsche Beteiligungs |
Targeting a 10%+ AUM and NAV CAGR to FY24 |
Investment companies |
17 December 2021 |
Analysts
|
||||||||||||||||||||||||||||||||||||||||||||||||||||||||||||||||||||||||||||||||||||||||||||||||||||||||
Deutsche Beteiligungs (DBAG) posted a NAV total return (TR) of 35.3% in FY21 (to end-September 2021). This return is in line with public and private equity (PE) markets and followed a weaker FY18–19 amid an industrial slowdown in Germany. Performance was driven by the revaluation of existing holdings (mostly broadband/telecom and IT/software) on the back of both earnings growth and multiples expansion. Additional uplift came from selected disposals/refinancings. Management proposed a dividend of €1.60 per share from FY20 earnings, which implies a solid 4.1% yield.
|
NAV development of DBAG’s PE investments segment |
|
|
Source: DBAG |
Why invest in Deutsche Beteiligungs now?
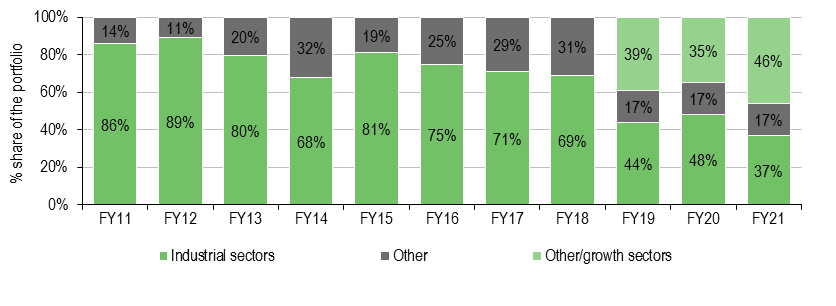
DBAG is a well-established player in the German PE mid-market. It has been increasing its exposure to new ‘growth’ sectors, which currently make up 46% of its portfolio and have proved resilient in the COVID-19 crisis, such as broadband/telecom businesses (30%), which are a play on the secular trend of network roll-out in Germany. At the same time, DBAG’s industrial portfolio (currently valued slightly below acquisition cost on average) may appeal to investors seeking exposure to cyclical value companies, even if their earnings recovery has been partially curbed by supply bottlenecks and cost inflation recently.
The analyst’s view
While DBAG completed investments of just €58.4m in FY21 (versus an average c €87m pa in FY18 to FY20), it continues to target a much higher annual volume in the coming years (€114m pa versus €120m pa guided previously), partly fuelled by the c €100m capital raise earlier this year. Consequently, DBAG has further expanded its investment team (including setting up an office in Italy), with the associated costs being the key driver of the guided significant decline in fund services earnings to €11–12m in FY22 versus €18m in FY21. Earnings should rebound following the launch of a new buyout fund (DBAG’s FY24 ambition is €17–19m). We estimate that even at FY22 earnings, DBAG’s current market capitalisation implies a 9.0x P/E valuation multiple for the fund services segment (assuming a discount to NAV for DBAG’s PE investment portfolio in line with its current peer average). This represents a c 56% discount to the listed PE managers.
Market outlook: Competing for quality assets
Robust transaction activity in PE markets in 9M21
After a strong H121, PE deal making continued to set a record-high pace in Q321, exceeding the highest-ever full-year deal counts and values in the first nine months of 2021 (9M21), both in Europe (€549bn in 9M21 versus €424bn in 2020 and €421bn on average between 2015 and 2019) and the United States (US$788bn, US$698bn and US$636bn respectively), according to Pitchbook Data (Exhibit 1). That said, Pitchbook Data expects deal activity to slow in Europe in Q421 as sponsors near the completion of the deal-making catch-up that followed the 2020 slowdown as dealmakers remain wary of 1) raw material cost inflation amid supply chain bottlenecks, but also an increasing risk of higher long-term inflation; 2) uncertainty related to the pandemic; and 3) the prospects of tightening fiscal and monetary policy.
|
Exhibit 1: PE transactions closed in Europe |
Exhibit 2: Fund-raising – PE funds closed in Europe |
|
|
|
Source: Pitchbook Data |
|
Exhibit 1: PE transactions closed in Europe |
|
|
Source: Pitchbook Data |
|
Exhibit 2: Fund-raising – PE funds closed in Europe |
|
|
Source: Pitchbook Data |
High competition for quality assets reflected in valuation metrics
Meanwhile, the PE market has accumulated significant amounts of capital available for investment, which Preqin Pro estimated at c €344bn for European PE firms as at end-September 2021, compared with c €332bn a year earlier. Having said that, this has been coupled with an overall increase in annual investment volumes across the market in recent years. In 9M21, European PE firms raised a healthy c €88bn despite a relatively low fund count in 2021 so far (104 in 9M21 vs 178 in 2020 and 210 on average between 2015 and 2019), according to Pitchbook Data (Exhibit 2). It expects total capital raised by the European PE market to reach a healthy c €100bn in 2021 (vs c €98m in 2020 and an average c €104m pa between 2015 and 2019), driven by funding rounds of ‘megafunds’ as institutional investors continue to display a preference towards well-established, larger general partners (GPs).
Large amounts of cash available for deployment have driven competition for high-quality assets, reflected in buyout transaction metrics. The average EV/EBITDA multiple for PE-backed deals in Europe was 11.8x over the last 12 months (LTM) to end-Q221 (last available data from corporate finance advisory firm Clearwater International), up from 11.0x in 2020, with the highest valuation metrics in the healthcare (14.1x), TMT (12.7x), financial services (12.7x) and business services (12.3x) sectors. It is worth noting though that buyout multiples across PE transactions in Europe in Q221 were the highest for mega deals with a value of €0.5–1bn and €1bn+, while DBAG is active in the mid-market segment. Noteworthy, in the current low interest rate environment, PE transactions are on average even more leveraged than before, which further slows down capital allocation.
We favour PE managers with sector expertise and a proven ‘buy-and-build’ track record
We believe that amid the strong competition for quality assets in the PE market, investors should favour sourcing PE specialists that are able to invest in their core sectors/investment themes, often acquiring businesses they have tracked for many years and thus know well. The main value creation strategy among PE managers remains ‘buy-and-build’ through bolt-on acquisitions (which comprised 71% of all PE deals in the United States in Q121). As bolt-ons are usually executed at lower multiples than platform investments, this approach lets managers blend down the initial (higher) acquisition multiple. Consequently, PE managers with a proven ‘buy and build’ track record should be favoured in the current environment. Moreover, there is a good supply of quality assets available from family-owned companies. These assets are well-positioned to grow in the long term but, due to the pandemic, their owners would prefer to sell them at current favourable prices rather than actively work on restoring the businesses to a pre-COVID-19 state. We believe that DBAG fits into the above profile well given the high proportion of holdings acquired from owners and their family members.
High PE transaction activity in the small and medium-sized deal segments in Germany
The aggregate value of PE transactions in Germany over the LTM to end-June 2021 was €22.2bn (Exhibit 3), driven by record high deal activity, mostly in the small- and medium-sized deal segments, according to Ernst & Young (EY). We note that the H121 figure was boosted by the €3.8bn acquisition of Birkenstock, while 2020 volumes include the Thyssenkrupp Elevator and Deutsche Glasfaser transactions, whose total volume reached c €20bn. H121 saw 156 PE deals, with the largest share of transactions in the IT and industrial sectors (46 and 17 respectively). The total value of exits stood at c €9.3bn in H121 compared with €16.2bn in 2020, including €3.5m from secondary sales, €2.5bn from strategic purchases and €3.3bn from the IPOs of seven PE portfolio companies (vs two in 2020 and one in 2019). Clearwater International estimates that an average EV/EBITDA multiple for PE deals in the DACH region (ie Germany, Austria and Switzerland) reached 11.4x LTM to end-Q221, only slightly up from 11.1x in 2020.
|
Exhibit 3: PE transactions closed in Germany |
|
|
Source: EY German Private Equity Deal Survey 2021 H121 |
Asset allocation
Investment strategy: ‘Mittelstand’ companies with potential
DBAG operates an integrated business model with two complementary business lines, PE investments and fund investment services, built around DBAG-managed PE funds (DBAG funds), through which DBAG invests alongside third-party investors. Investing through the DBAG-managed funds creates a substantially larger capital base, and hence a broader range of investment opportunities, for DBAG’s own balance sheet investments. The strategy also provides some assurance to third-party investors in the funds that the manager’s interests are aligned with their own.
DBAG invests in well established companies with proven business models rather than early-stage businesses or companies requiring restructuring. The companies are often characterised by leading market positions, entrepreneurial management and capacity for innovation, with the prospect of a long-term future for their products.
After the pandemic crisis, DBAG expects more investment opportunities to arise in equity minority positions in companies seeking reliable long-term financing. Until recently, DBAG was executing these investments through DBAG Expansion Capital Fund (ECF), but will now invest exclusively through its own balance sheet. DBAG does not intend to invest in distressed assets as they remain outside of its core strategy.
As well as participating in competitive sale processes, DBAG’s extensive network enables it to originate proprietary deal flow. DBAG’s investment process consists of three phases:
■
Investing – identification and assessment of transaction opportunities. In FY21, more than 300 investment opportunities were screened.
■
Developing – supporting a portfolio company’s development process. DBAG typically supports portfolio companies as a financial investor in a focused partnership role for four to seven years.
■
Realising – realising value appreciation through a well-timed and well-structured divestment. Investments are usually exited through a trade sale of portfolio companies to an industrial partner with which companies can continue their development but may also involve the sale to a new financial investor or listing as a public company. DBAG has a proven track record of successfully realising investments with an average exit multiple of 2.7x for MBOs and 2.9x for growth financings (see Exhibits 4 and 5).
DBAG’s buy-and-build strategy and expertise is illustrated by its investment in ProXES, which it exited in July 2017 at a money multiple of 5.4x. DBAG created the company in 2013 alongside DBAG Fund V by merging four smaller mechanical engineering companies. During the holding period the company performed further three follow-on investments, greatly increasing its scale.
Exhibit 4: DBAG’s MBO transactions realised between 1997 and FY21
Company |
Investment |
Divestment |
Holding period (years) |
Exit |
Exit |
blikk Holding GmbH |
May-19 |
Aug-21 |
2.3 |
Secondary buyout |
2.2x |
Infiana Group GmbH |
Dec-14 |
Sep-19 |
4.8 |
Secondary buyout |
2.2x |
Unser Heimatbäcker GmbH |
May-14 |
Jan-19 |
4.6 |
Write-off |
0.0x |
CleanPart Group GmbH |
Apr-15 |
Oct-18 |
3.5 |
Trade sale |
2.4x |
Formel D GmbH |
May-13 |
Jul-17 |
4.2 |
Secondary buyout |
4.9x |
ProXES GmbH |
May-13 |
Jul-17 |
4.2 |
Secondary buyout |
5.4x |
ZGS-Bildungs GmbH |
Oct-13 |
Jul-17 |
3.8 |
Secondary buyout |
3.9x |
Romaco GmbH |
Apr-11 |
Jun-17 |
6.2 |
Trade sale |
2.4x |
FDG S.A. |
Jun-10 |
Apr-17 |
6.8 |
Secondary buyout |
2.4x |
Broetje |
Mar-12 |
Oct-16 |
4.6 |
Trade sale |
4.1x |
Clyde Bergemann Power Group |
May-05 |
Apr-16 |
10.9 |
Trade sale |
0.3x |
Spheros GmbH |
Dec-11 |
Mar-16 |
4.3 |
Trade sale |
2.5x |
Homag Group AG |
Feb-07 |
Oct-14 |
7.7 |
IPO / Trade sale |
2.8x |
Coveright Surfaces GmbH |
Jun-03 |
Jan-13 |
9.6 |
Trade sale |
1.2x |
ICTS Europe B.V. |
Mar-08 |
Dec-12 |
4.8 |
Write off |
0.0x |
Preh GmbH |
Oct-03 |
Dec-12 |
9.2 |
Trade sale |
3.1x |
Coperion GmbH |
Jul-07 |
Nov-12 |
5.3 |
Trade sale |
4.2x |
Heim & Haus GmbH |
Sep-06 |
May-11 |
4.7 |
Buy back |
1.9x |
MCE AG |
Apr-07 |
Oct-09 |
2.5 |
Trade sale |
4.1x |
Lewa GmbH |
Sep-05 |
Aug-09 |
3.9 |
Trade sale |
7.3x |
AkSys GmbH |
Nov-01 |
Oct-08 |
6.9 |
Trade sale |
0.1x |
DS Technologie GmbH |
Jul-98 |
Oct-07 |
9.3 |
Trade sale |
1.3x |
HT Engineering GmbH |
Jun-02 |
Jun-06 |
4.0 |
Trade sale |
6.2x |
Zapf GmbH |
Nov-99 |
Apr-06 |
6.4 |
Trade sale |
0.1x |
Otto Sauer Achsenfabrik |
Apr-04 |
Mar-06 |
1.9 |
Secondary buyout |
4.1x |
Babcock Borsig Service |
Nov-03 |
Apr-05 |
1.4 |
Trade sale |
5.8x |
Andritz AG |
Dec-99 |
Aug-04 |
4.4 |
IPO |
2.0x |
Edscha AG |
Oct-00 |
Dec-02 |
2.2 |
Secondary buyout |
1.8x |
Libro AG |
Feb-97 |
Jul-01 |
3.4 |
Trade sale |
1.6x |
Sebaldus GmbH |
Aug-97 |
Nov-00 |
3.3 |
Trade sale |
3.5x |
Euvita KG |
Jul-97 |
Aug-00 |
3.1 |
Trade sale |
0.9x |
GAH AG |
Jul-98 |
Jul-00 |
2.0 |
Trade sale |
3.7x |
Schoeller & Hoesch KG |
May-97 |
Dec-98 |
1.6 |
Trade sale |
2.6x |
Average |
4.8 |
2.7x |
Source: DBAG. Note: Does not include the announced but not closed as at 30 September 2021 disposal of Telio.
Exhibit 5: DBAG’s growth financings realised between 1996 and Q321
Company |
Investment date |
Divestment date |
Holding period |
Exit route |
Exit multiple |
DNS:Net Internet Service |
Sep-13 |
Jun-21 |
7.8 |
Secondary buyout |
5.8 |
Rheinhold & Mahla |
Sep-16 |
Mar-21 |
4.5 |
Trade sale |
0.7 |
Inexio |
May-13 |
Nov-19 |
6.5 |
Secondary buyout |
7.6 |
Novopress |
Jun-15 |
Jul-19 |
4.1 |
Repayment |
15.7 |
PSS |
Dec-12 |
Jan-19 |
6.1 |
Trade sale |
0.5 |
Homag |
Jan-97 |
Oct-14 |
17.8 |
Trade sale |
3.4 |
Bauer |
Sep-96 |
Jul-06 |
9.8 |
IPO |
4.0 |
Schlott |
Jan-00 |
Mar-05 |
5.2 |
Secondary placement |
1.6 |
Hoermann |
May-97 |
Oct-04 |
7.4 |
Repayment |
2.5 |
Sauer |
May-97 |
Apr-04 |
6.9 |
Repayment |
1.9 |
HKL Baumachinen |
Feb-95 |
Feb-04 |
9.0 |
Repayment |
2.4 |
Rheinhold&Mahla |
Dec-99 |
Sep-02 |
2.8 |
Trade sale |
1.5 |
Hawe |
Jan-97 |
Jun-02 |
5.4 |
Trade sale |
2.6 |
AVK/SEG |
Sep-96 |
Oct-01 |
5.1 |
Trade sale |
1.5 |
Frosch Touristik |
Feb-96 |
Dec-00 |
4.8 |
Trade sale |
1.4 |
Palfinger |
Nov-96 |
Jun-99 |
2.6 |
IPO |
2.1 |
Average |
6.7 |
2.9 |
Source: DBAG. Note: *attributable to equity investment. Total exit multiple, including debt financing, amounted to 3.2x
DBAG’s approach to ESG
DBAG has implemented sustainability aspects into its corporate governance and investment process, highlighting that this improves the alignment of shareholders’ and fund investors’ targets with DBAG’s objectives. At the same time, management highlights it must make a balanced assessment in its investment decisions between what is valued by society and what is economically advisable. To monitor and manage the environmental, social and governance (ESG) performance at DBAG and portfolio companies, it started to collect a set of general and business model specific ESG key performance indicators (KPIs) in FY21. The former address key sustainability topics identified by management, including greenhouse gas emissions, safety at work, employee satisfaction, gender parity and compliance breaches. ESG data from 24 of 32 portfolio companies was available at end-FY21 and management plans to set target values for its ESG KPIs during the current fiscal year. DBAG documented the importance of ESG aspects in its business by signing the United Nations Principles for Responsible Investment (UN PRI) in September 2021 (it will issue its first UN PRI report in spring 2023).
Current portfolio positioning
As at end-September 2021, DBAG’s portfolio consisted of 32 companies with a total gross value of €569.9m (up 33% y-o-y). The portfolio is divided into three categories – core sectors, growth sectors and other. 37% of DBAG’s portfolio value was allocated to industries of its core expertise, that is industrials sectors (industrial components, mechanical and plant engineering, industrial services and automotive suppliers). The exposure to new growth sectors (broadband/telecommunications, IT services/software, healthcare) is steadily increasing and reached 46% of the portfolio at end-FY21. This stems from both new investments and value appreciation, as they represent 23% of the portfolio based on acquisition cost.
|
Exhibit 6: DBAG’s portfolio exposure FY11–FY21 |
|
|
Source: DBAG |
Exhibit 7: DBAG’s investment portfolio at end-September 2021
Company |
Headquarters |
Core business |
2020 |
Employ-ees |
First inv’t |
Type of inv’t |
Co-inv’t fund |
DBAG inv’t cost |
DBAG gross portfolio value |
Heytex Bramsche GmbH |
Bramsche, Germany |
Manufacturer of textile print media and technical textiles |
€87m |
348 |
Dec-12 |
MBO |
DBAG Fund V |
€6.5m |
>5 years |
Telio Group* |
Hamburg, Germany |
Developer, installer and operator of communications and media systems in prisons |
€83m |
213 |
Apr-16 |
MBO |
DBAG Fund VI |
€14.3m |
€92.2m |
Silbitz Group GmbH |
Thuringia, Germany |
Iron foundries producing castings for wind energy systems, drive engineering and engine construction |
€122m |
891 |
Aug-15 |
MBO |
DBAG Fund VI |
€4.8m |
|
Pfaudler International Sàrl |
Schwetzingen, Germany |
Manufacturer of glass-lined reactors and components for the chemical and pharmaceutical industries |
US$216m |
976 |
Dec-14 |
MBO |
DBAG Fund VI |
€1.2m |
|
Oechsler AG |
Ansbach, Germany |
Developer, manufacturer of injection-moulded precision components principally for automotive suppliers |
€378m |
3,032 |
Mar-15 |
Exp. capital |
DBAG ECF |
€11.2m |
|
mageba AG |
Bülach, Switzerland |
Provider of structural bearings, expansion joints and other services for the infrastructure and buildings sectors |
CHF97m |
963 |
Feb-16 |
Exp. capital |
DBAG ECF |
€6.7m |
|
Gienanth GmbH |
Eisenberg, Germany |
Iron foundry producing castings for automotive suppliers, diesel and gas engine blocks |
€162m |
1,229 |
Mar-15 |
MBO |
DBAG Fund VI |
€4.2m |
|
JCK KG |
Quakenbrück, Germany |
Textile retail business, mainly for discounters |
€761m |
1,644 |
Jun-92 |
Exp. capital |
DBAG ECF |
€8.8m |
|
von Poll Immobilien GmbH |
Frankfurt, Germany |
Real estate agency |
€128m |
137 |
Jul-18 |
MBO |
DBAG ECF I |
€11.7m |
2–5 years |
blikk radiology group |
Unna, Germany |
Regional provider of diagnostic and therapeutic radiology outpatient and inpatient care services |
€95m |
707 |
May-19 |
MBO |
DBAG Fund VII |
€16.3m |
€361.2m |
BTV Multimedia GmbH |
Hannover, Germany |
Manufacturer and full-service provider of cable and fibre-optic networks |
€76m |
184 |
Aug-18 |
MBO |
DBAG ECF II |
€8.9m |
|
cloudflight GmbH |
Munich, Germany |
Advisory services, software development and cloud operations |
€37m |
311 |
Jun-19 |
MBO |
DBAG Fund VII |
€10.3m |
|
Solvares (previously: FLS) |
Heikendorf, Germany |
Provider and developer of real-time route optimisation software |
€11m |
82 |
Oct-18 |
MBO |
DBAG ECF II |
€14.3m |
|
Polytech Health & Aesthetics GmbH |
Dieburg, Germany |
Development and production of silicone implants used in reconstructive and aesthetic plastic surgery |
€46m |
285 |
Oct-16 |
MBO |
DBAG Fund VI |
€14.6m |
|
Frimo Group |
Lotte, Germany |
Developer and manufacturer of tooling and production plants for plastic components used in automotive applications |
€160m |
1,124 |
Nov-16 |
MBO |
DBAG Fund VI |
€19.5m |
|
Dieter Braun |
Bayreuth, Germany |
Supplier of cable assembly and lighting solutions to the automotive industry |
€68m |
1,569 |
Jan-17 |
MBO |
DBAG Fund VI |
€6.3m |
|
More than Meals Europe Sàrl |
Luxembourg |
Manufacturer of chilled meat products, prepared meals and snacks for private-label brands of large grocery chains |
€541m |
3,600 |
Apr-17 |
MBO |
DBAG Fund VII |
€16.5m |
|
Vitronet Projekte GmbH |
Essen, Germany |
Fibre-optic network services provider to the telecoms industry |
€268m |
788 |
Jun-17 |
MBO |
DBAG ECF |
€14.7m |
|
SERO Schröder Elektronik Rohrbach GmbH |
Rohrbach, Germany |
Development partner and manufacturing service provider for electronic components, with focus on the automotive sector |
€70m |
235 |
Nov-18 |
MBO |
DBAG Fund VII |
€14.8m |
|
duagon AG |
Dietikon, Switzerland |
Provider of network components for data communication in railway vehicles |
CHF122m |
627 |
Jul-17 |
MBO |
DBAG Fund VII |
€24.6m |
|
Kraft & Bauer Holding GmbH |
Holzgerlingen, Germany |
Supplier of automated fire extinguishing systems for machine tools |
€19m |
85 |
Nov-18 |
MBO |
DBAG Fund VII |
€14.1m |
|
Netzkontor Nord GmbH |
Flensburg, Germany |
Regional provider of services for fibre-optic networks management |
€46m |
516 |
Jan-18 |
MBO |
DBAG ECF I |
€5.0m |
|
Sjølund A/S |
Sjølund, Denmark |
Manufacturer of complex bent aluminium and steel components. |
DKK244m |
174 |
Jan-18 |
MBO |
DBAG ECF I |
€4.5m |
|
Karl Eugen Fischer GmbH |
Burgkunstadt, Germany |
Leading manufacturer and developer of cutting systems for the tyre industry |
€41m |
420 |
Jun-18 |
MBO |
DBAG Fund VII |
€22.6m |
|
PM Flex |
Bergamo, Italy |
Production and marketing of cable protection conduits for electrical cables |
€104m |
120 |
Sep-20 |
MBO |
DBAG Fund VII |
€11.2m |
1–2 years |
Hausheld |
Mönchengladbach, Germany |
Development of smart metering solutions for electricity networks |
€2m |
26 |
Sep-20 |
Exp. capital |
- |
€8.5m |
€69.0m |
Fire (formerly Multimon) |
Kirchheim, Germany |
Design, construction, and maintenance of fire extinguishing systems in buildings. |
€132m |
884 |
Sep-20 |
MBO |
DBAG Fund VIII |
€8.0m |
|
Deutsche Giga Access |
Essen, Germany |
Regional provider of fast internet and telephony services |
€4m |
43 |
Sep-20 |
MBO |
DBAG Fund VIII |
€7.1m |
|
Cartonplast |
Dietzenbach, Germany |
Pool system for the rental of reusable plastic layer pads |
€81m |
813 |
Nov-19 |
MBO |
DBAG Fund VII |
€25.3m |
|
Company |
Headquarters |
Core business |
2020 |
Employ-ees |
First inv’t |
Type of inv’t |
Co-inv’t fund |
DBAG inv’t cost |
DBAG gross portfolio value |
R+S |
Fulda, Germany |
Design, construction, and maintenance of electric, heating, ventilation and energy structures in buildings |
€357m |
2,479 |
May-21 |
MBO |
- |
€16.0m |
<1 year |
Operasan (spun-off from formerly held Blikk) |
Büren, Germany |
Nephrology and dialysis treatments in cooperation with physicians |
€8m |
87 |
Jan-21 |
MBO |
DBAG Fund VII |
€3.2m |
€42.1m |
Congatec |
Deggendorf, Germany |
Computer-on-modules provider – the hardware deployed as a part of larger systems on site (on factory robots, ultrasonic devices etc to reduce latency) |
€128m |
271 |
Oct-20 |
MBO |
DBAG Fund VIII |
€22.9m |
|
Buyout funds |
|
|
|
|
|
|
|
|
>5 years |
DBG Eastern Europe II |
Jersey, Chan. Islands |
One investment remaining in portfolio |
N/A |
N/A |
Jan-03 |
Buyout fund |
N/A |
€0.1m |
€5.4m |
Post-reporting date acquisitions |
|
|
|
|
|
|
|||
Dantherm |
Skive, Denmark |
Heating, ventilation, and air conditioning products |
€147m |
600 |
Nov-21 |
MBO |
DBAG Fund VIII |
€22.4m |
N/A |
Itelyum |
Pieve Fissiraga/Lodi, Italy |
Recycling of complex industrial waste |
€353m |
800 |
Oct-21 |
Exp. capital |
DBAG Fund VIII |
€16.7m |
|
freiheit.com |
Hamburg, Germany |
Developer of extensive software platforms for digital business models |
€30m** |
N/A |
Dec-21 |
MBO |
DBAG Fund VIII |
€19.0m |
|
Source: DBAG. Note: *Disposal after the reporting date. **Revenues projected for FY21.
DBAG was a net seller in FY21
In FY21, DBAG was a net seller, performing €78.4m disposals and €58.4m acquisitions. This includes only transactions closed during the period (also some which were announced/agreed in late FY20) and excludes transactions agreed but not closed yet. Two minority investments by DBAG ECF were sold during the period: DNS:Net (broadband/telecommunications) at a 3.2x exit multiple and Rheinhold&Mahla (industrial services) below its investment cost at 0.7x (but with an uplift to the last carrying value) – see Exhibits 4 and 5. We highlight, that the DNS:Net exit multiple is calculated based on the total invested capital, which includes lower-yielding debt financing provided to the company – the equity investment alone delivered an attractive 5.8x money multiple. DBAG also performed two partial exits: Pfaudler and blikk. The Pfaudler transaction was a disposal of c 80% of the company’s international business through the placement of shares of its Indian subsidiary, through which DBAG realised proceeds at 1.3x its initial investment. The other transaction was the disposal of the radiology part of the blikk healthcare group at a 2.2x exit multiple (a quite healthy multiple given the short holding period), with the nephrology subsidiary operasan remaining in DBAG’s portfolio. In addition, DBAG received €10.5m from netzkontor in a loan repayment, as the company completed its refinancing with a term loan and additional acquisition facility. After the reporting date, DBAG Fund VI also divested Telio at an 1.8x exit multiple after close to six years in the portfolio (see our previous note for details). The disposal was performed at close to the carrying value and resulted in a minor €0.3m gain already accounted for in the FY21 results.
New investments included in particular the acquisition of congatec (described in our earlier note) and R+S. A minor investment was also made into operasan in the process of the aforementioned carveout. DBAG’s management highlighted during the FY21 results conference that it continues to see investment opportunities and is pursuing a significantly higher annual investment volume versus previous years. Meanwhile, the mid-term investment target was slightly reduced to €114m from €120m previously, though this stems solely from DBAG’s bottom-up approach to setting the expected volume. While it is worth noting that the FY21 investment volume was significantly below DBAG’s annual target (which may suggest a more selective approach in the current ‘hot’ PE market), we need to stress that the target was announced during the fiscal year following completion of the c €100m equity issue. In recent months DBAG has accelerated significantly with new investments, as the transactions closed/announced after the reporting date already sum up to €58m as at mid-December 2021. We also note that DBAG is still in the process of ramping up its new office in Italy which should contribute to deal flow in the coming years. Finally, the exact timing of investments in the PE industry is often difficult to predict/manage.
|
Exhibit 8: DBAG’s available investment opportunities by quarter |
|
|
Source: DBAG |
The recent capital raise and net seller position in FY21 left DBAG with ample capital available for investments. As at end-September 2021 it had €112.8m in financial resources at hand (cash and liquid securities) and two open credit lines (€106.7m in total) which are currently undrawn. The credit lines are used temporarily to bridge a gap between new investments and realisations or to provide liquidity to the existing portfolio if needed. The €220m total available resources compare to €273.4m of co-investment commitments that DBAG had towards its funds at end-September 2021. The latter are mostly to the DBAG Fund VIII, which started its investment period in late FY20 and is likely to deploy its capital gradually over the course of the next few years. After accounting for investments (Itelyum, Dantherm, freiheit.com) and disposals (Telio) agreed or executed after the reporting date, we estimate the resources at hand should decrease to at least c €72.7m (excluding open credit line), which represents c 10% of DBAG’s last reported NAV.
Performance: In line with public and private equities
DBAG’s net profit in FY21 amounted to €185.1m compared to a net loss of €16.8m in FY20. €167.7m profit came from the PE investments segment (FY20: €25.2m loss) on the back of strong portfolio revaluations stemming from both strong operating results and market multiples expansion. The fund services segment almost doubled its profit y-o-y, delivering €18.0m with an 42% y-o-y increase in collected fees to €43.4m on the back of the first full year of fee collection from DBAG Fund VIII. Net operating expenses increased by 23% y-o-y to €33.8m, predominantly due to a 26% y-o-y increase in personnel costs to €23.1m as a result of DBAG’s increase in headcount (including the opening of a new office in Italy). This has been part of its efforts to significantly expand its investment activity (as discussed in our previous note).
Exhibit 9: Income statement by segment (€m)
FY21 |
FY20 |
y-o-y |
|
Net income from investment activity |
178.4 |
(16.9) |
N/A |
Other income/expenses |
(10.7) |
(8.4) |
27% |
PE investments pre-tax profit |
167.7 |
(25.2) |
N/A |
Fund services income |
43.4 |
30.6 |
42% |
Other income/expenses |
(25.4) |
(21.1) |
20% |
Fund services profit pre-tax |
18.0 |
9.5 |
90% |
Consolidated net profit |
185.1 |
(16.8) |
N/A |
Source: DBAG
Solid results from both segments led to a 35.3% increase in NAV per share (defined as the value of its equity) in FY21 (of which 8.6% was in Q421). The return was broadly in line with the German small-cap equities index SDAX (32.2%) and slightly ahead of LPX Europe NAV (29.6%, see Exhibit 10).
|
Exhibit 10: DBAG performance to 30 September 2021 |
|
Price, NAV and benchmark total return performance, one-year rebased |
Price, NAV and benchmark total return performance (%) |
|
|
|
Source: Refinitiv, Edison Investment Research. Note: Three, five and 10-year performance figures annualised. |
|
The €176.2m positive change in the value of the carried portfolio in FY21 (including €161m from a fair value increase and €14.8m from received dividends) was the main driver of DBAG’s NAV increase (we calculate it added c 42pp to DBAG’s NAV TR out of the final 35.3%). DBAG values the majority of its investments based on the market multiples of listed peers and the increase in valuations across listed equity markets was one of the important performance drivers for the company in FY21 (adding €85.6m to portfolio value). While the positive earnings development of DBAG’s holdings increased the value of its portfolio by €148m, we note that this was in part assisted by leveraged add-on acquisitions with the overall change in debt across DBAG’s portfolio having a €74m negative effect.
A further c 10pp (€41.6m) positive impact came from completed and agreed disposal gains, most notably the full exits from DNS:Net and Rheinhold & Mahla, the partial disposal of Pfaudler and blikk, and the refinancing at netzkantor. Fund services fees also contributed 10pp to the NAV total return, compared to 2pp in FY20. As at end-FY21 DBAG’s NAV amounted to €698.8m and was up from €423.5m at end-FY20. This also reflects €12m in dividends paid during the year (corresponding to a dividend per share of €0.80 from the profits of the pandemic-distorted year vervus €1.50 paid out of FY19 earnings) and raised c €100m of new equity to fund its investment portfolio expansion.
|
Exhibit 11: DBAG NAV development in FY21 |
|
Source: DBAG, Edison Investment Research |
Exhibit 12: Net gains and losses on portfolio measurement and derecognition (€m)
FY21 |
FY20 |
|
Changes in the fair value of unlisted investments |
161.0 |
(24.3) |
Change in earnings |
148.0 |
(58.3) |
Change in debt |
(73.7) |
(32.5) |
Change in multiples |
85.6 |
66.8 |
Change in exchange rates |
(0.2) |
(1.3) |
Change, other |
1.4 |
1.2 |
Net result of disposal |
41.3 |
1.6 |
Other |
0.4 |
(0.2) |
Total |
202.7 |
(22.8) |
Source: DBAG
The portfolio is currently valued at 1.4x acquisition cost on average (FY20: 1.1x). The increase was driven by the nine companies in new growth sectors (currently at 2.8x versus 1.6x a year earlier), which continue their operational expansion as well as benefit from the expansion in market multiples as one of the most sought-after sectors. The 19 companies with links to the manufacturing industry continue to be valued at around 0.9x cost (flat y-o-y). While DBAG highlighted that earnings growth within this sector contributed positively to the portfolio’s value, it was offset by lower market multiples which likely reflects the industry headwinds from cost inflation and supply bottlenecks.
FY22 guidance and FY24 ambition released
Normalisation of PE investment profit in FY22 after a strong FY21
DBAG’s management raised its FY21 net income guidance three times during the year (in March, July and October) from the initial €40–45m at the time of the FY20 results (30 November 2020) to €175–195m (already released post the balance sheet date). This was mainly driven by the positive revisions of net income expectations in the PE investments segment on the back of improved earnings prospects across the portfolio (with selected individual investments standing out eg due to the positive impact from earlier bolt-on acquisitions). Moreover, DBAG posted an unexpected €26m positive effect from the blikk disposal. Management now guides to net income in the PE investment segment in FY22 at €60–75m, as it remains wary of the risks associated with the pandemic (including the Omicron variant), as well as persisting supply bottlenecks and producer cost inflation which DBAG expects will ease only gradually throughout the current fiscal year. Consequently, it cautiously does not assume any significant revaluation of its industrial portfolio (despite it being currently valued slightly below cost, see above). At the same time, management anticipates continued high exit activity and in turn guides to cash flow in the PE investments division at €50–65m in FY22. DBAG released a new mid-term ambition indicating net income and cash flow in PE investments at €85–100m and €5–10m in FY24 respectively.
Fund services earnings down visibly in FY22 amid team expansion
DBAG also raised its earnings guidance for the fund services segment in July and October 2021 from the initial €15–16m to €19–20m, though it slightly missed the revised guidance with FY21 earnings at €18.0m. According to management, this was because the guidance was released before the company completed the allocation of costs for the newly opened office in Italy (some of which reduced the fund services profit). Fund services income of €42.1m was in line with the €42–44m guidance (published in November 2020 and reiterated in March 2021). For FY22, DBAG guides to fund services income of €41–44m (ie broadly in line with FY21) and AUM of €2,475–2,605m (implying an up to 5.3% increase versus FY21). However, management expects significantly lower earnings at €11–12m, which is primarily a function of additional costs associated with the continued expansion of the investment team to support the higher targeted investment volumes. DBAG’s FY24 ambition assumes earnings rebounding to €17–19m (based on fee income of €50–54m) upon the successful launch of a new buyout fund, with DBAG’s total assets under management expected to be €3.3–3.4bn by then.
Consequently, DBAG guides to net income at the group level of €60–75m in FY22, assuming some normalisation from the particularly strong FY21, though it still expects earnings to be visibly above the historical 10-year average. Its FY24 group earnings ambition stands at €90–105m.
Exhibit 13: DBAG’s FY22 forecast and updated ambition FY24
|
FY21 actual |
FY22 forecast |
Ambition 2023/24 (€m) |
Implied CAGR 2021–24 |
NAV |
678.5 |
680–755 |
815–905 |
10–14%* |
PE investments profit |
178.4 |
60–75 |
85–100 |
- |
PE investments cash flow |
28.2 |
50–65 |
5–10 |
- |
AUM |
2,473.2 |
2,475–2,605 |
3,270–3,445 |
- |
Fee income |
43.4 |
41–44 |
50–54 |
5–8% |
Fund services profit |
18.0 |
11–12 |
17–19 |
(2)–2% |
Net income |
185.1 |
60–75 |
90–105 |
- |
Source: Company data. Note: *Adjusted for dividend payments and capital increase.
Peer group comparison
In Exhibit 14 we present DBAG’s peers focused on PE investments. We underline that only 3i and Eurazeo combine both DBAG’s business models of managing its own portfolio and external capital, which explains the premium to NAV in the case of 3i. DBAG’s NAV return is only slightly below the peer group average over one year, whereas over the medium term (three- and five-year returns) its returns are visibly behind peer average. We understand that this stems from lower returns directly before the COVID-19 outbreak (affected by the slowdown in the German manufacturing sector). While peers trade at a 5.8% discount on average, we note that this is calculated based on a wide range – from a 23% premium for 3i to a 26% discount for Eurazeo. DBAG’s dividend yield falls slightly behind the average, but we note that only DBAG, Eurazeo and GIMV pay their dividend once a year and their LTM yield is still fully affected by the lower payout associated with the COVID-19 uncertainty. DBAG’s dividend yield based on the recently declared dividend is 4.1%.
Exhibit 14: Listed PE investment companies peer group at 16 December 2021*
% unless stated |
Region |
Market cap £m |
NAV TR 1y |
NAV TR 3y |
NAV TR 5y |
NAV TR 10y |
Price TR 1y |
Price TR 3y |
Price TR 5y |
Price TR 10y |
Premium/ |
Dividend yield |
Deutsche Beteiligungs |
Europe |
622 |
28.2 |
39.1 |
88.6 |
221.5 |
22.2 |
16.9 |
51.4 |
288.4 |
4.8 |
2.1 |
3i |
Global |
13,805 |
33.2 |
69.4 |
159.4 |
502.2 |
32.8 |
51.8 |
133.9 |
898.1 |
23.0 |
2.7 |
Eurazeo |
Global |
4,935 |
34.4 |
32.3 |
83.4 |
131.0 |
55.6 |
19.9 |
76.3 |
155.0 |
(26.0) |
2.0 |
GIMV |
Global |
1,212 |
13.3 |
8.2 |
31.1 |
98.1 |
12.7 |
16.7 |
19.7 |
65.1 |
3.7 |
4.7 |
HgCapital Trust Ord |
UK |
1,901 |
40.4 |
113.0 |
193.0 |
369.4 |
40.6 |
109.1 |
205.3 |
411.1 |
1.3 |
1.2 |
ICG Enterprise Trust |
UK |
877 |
37.5 |
57.2 |
111.3 |
213.3 |
53.0 |
45.8 |
111.8 |
304.2 |
(16.5) |
2.0 |
Oakley Capital Investments |
Europe |
719 |
25.6 |
77.0 |
117.4 |
159.7 |
43.9 |
95.0 |
188.5 |
185.5 |
(9.6) |
1.1 |
Princess Private Equity |
Global |
811 |
19.6 |
50.4 |
93.1 |
193.1 |
37.3 |
52.7 |
101.4 |
317.6 |
(11.9) |
4.5 |
Standard Life Private Equity |
Europe |
836 |
28.5 |
61.8 |
125.9 |
203.4 |
60.6 |
62.0 |
126.1 |
399.3 |
(10.3) |
2.5 |
Average |
3,137 |
29.1 |
58.7 |
114.3 |
233.8 |
42.1 |
56.6 |
120.4 |
342.0 |
(5.8) |
2.6 |
|
Rank |
9 |
6 |
7 |
7 |
3 |
8 |
8 |
8 |
6 |
2 |
5 |
Source: Morningstar, Edison Investment Research. Note: *12-month NAV performance in sterling terms based on end-September 2021 ex-par NAV, or latest earlier available ex-par NAV (end-July for ICG Enterprise Trust and end-June for Eurazeo and Oakley Capital Investments).
Dividends
DBAG distributes dividends once a year, with a stable or rising dividend per share (DPS) policy. The dividends increased steadily over the last few years before the pandemic. Given the strong FY21 earnings, management will recommend to the AGM (expected to be held in late February) a €1.60 per share payout, which is 100% higher y-o-y and marks a return to the pre-COVID-19 DPS growth path (FY19: €1.50 per share). Going forward, DBAG plans to distribute no less than €1.60 per share in the midterm.
|
Exhibit 15: Dividend history since FY15 |
|
|
Source: Bloomberg, Edison Investment Research Note: *Management guidance. |
Valuation: Premium narrower than usual
DBAG’s NAV (defined as equity value) is almost entirely attributable to its PE investments portfolio, and the valuation of the fund services segment represents only a small fraction of NAV. Meanwhile, the latter generates considerable fee income from managing third-party assets of c €1.8bn (end-September 2021). We believe that the market recognises the hidden valuation reserve of the fund services segment, as DBAG traditionally trades at a premium to its NAV. Over the last five years the premium stood at 18.6% on average, whereas recently it declined to 4.8% (see Exhibit 16).
|
Exhibit 16: Discount over three years |
Exhibit 17: Buybacks and issuance |
|
|
|
Source: DBAG, Refinitiv, Edison Investment Research |
Source: DBAG, Edison Investment Research |
|
Exhibit 16: Discount over three years |
|
|
Source: DBAG, Refinitiv, Edison Investment Research |
|
Exhibit 17: Buybacks and issuance |
|
|
Source: DBAG, Edison Investment Research |
Assuming that the market assigns a discount to the reported carrying value of DBAG’s PE investments in line with the current median discount to NAV of DBAG’s direct peers at 10% (see Exhibit 14). the fund services segment is valued at €102.9m or a 9.0x earnings multiple. Here, we exclude 3i and Eurazeo, which like DBAG manage third-party assets.
Meanwhile, the listed asset managers with exposure to alternative unlisted assets tend to trade at significantly higher multiples. We compare DBAG’s asset management business to a group of six managers (Blackstone, EQT, Partners Group, Intermediate Capital, Tikehau Capital, Cohen & Steers) which differ from DBAG to a varying degree (see our previous note for detailed descriptions). These managers currently trade at an FY22e P/E multiple of 20.3x on average, which based on the above-mentioned 9.0x multiple for DBAG implies a 56% discount. Assuming no discount to DBAG’s PE investments, we arrive at a 2.9x multiple, implying an 86% discount to the listed asset manager peer group. Taking the opposite approach, the implied value of DBAG’s fund services segment based on average asset management multiple stands at €233.5m, which leaves a value of €499.0m assigned to its PE investments – a 29% discount to its last reported NAV, which is visibly wider than DBAG’s peer group average. This suggests that DBAG’s market valuation remains undemanding.
We also note that that DBAG’s FY24 ambition is for much higher fund services earnings at €17–19m versus the FY22 guidance of €11–12m, which should be supported by the launch of a new buyout fund. On the other hand, we would also like to highlight that the earnings margin within this segment has been quite volatile in the past, affected by a number of factors such as 1) changes to the level of variable compensation to DBAG’s investment team; 2) set up costs of new funds; and 3) investment staff expansions (as illustrated by the much lower earnings management expects in FY22 versus FY21).
Exhibit 18: Analysis of DBAG’s market value by segment
Approach |
PE investments |
PE investments |
Discount applied to PE investments value (%) |
0 |
(10) |
Implied value of PE investments segment (€m) |
698.8 |
629.5 |
Implied value of fund services segment (€m) |
33.7 |
102.9 |
Implied FY21e earnings multiple of fund services segment** (x) |
2.9 |
9.0 |
Source: DBAG, Edison Investment Research. Note: *Peer group median excluding 3i and Eurazeo. **Based on the mid-point of management guidance.
Fund profile: PE investor and manager
Deutsche Beteiligungs is a Germany based and listed PE investment and fund management company founded in 1965. It invests in mid-sized companies in German-speaking countries (DACH region) and selected other European regions (eg Northern Italy), focusing on growth-driven profitable businesses valued at €50–250m. DBAG also initiates and manages closed-end PE funds (generating stable recurring fee income) with current third-party capital under management of €1.8bn. It carries out MBO transactions alongside its DBAG Funds to acquire a majority equity stake for €40–220m, with the usual holding period of up to five years. DBAG also makes long-term investments funded exclusively from its own balance sheet where the company normally targets a ticket size of €15–35m with a holding period of seven years and longer. Here, DBAG focuses either on providing growth financing to family-owned businesses in exchange for a minority stake or on acquiring majority stakes in companies with performance-driven equity requirements (for instance due to COVID-19), including corporate spin-offs. DBAG also manages the DBAG ECF, focused on growth financing, which has completed its investment period and DBAG does not intend to launch similar funds in the future. The company has been a ‘partner of choice’ for a number of German private businesses, in particular those owned by founders and their family members, as illustrated by the share of businesses sold by this group in DBAG’s total MBO volume in 2011–20 at 58% compared to 35% for the broader German mid-market MBOs segment.
DBAG is managed internally and has an investment team consisting of 28 employees including 10 senior members (called ‘deal captains’) who have been with DBAG for 11 years on average. The alignment of the team’s interest with DBAG and fund investors is supported by co-investments made alongside the DBAG funds by senior members (currently 19 individuals) at c 1–2% of capital raised (the volume of these co-investments stood at €18.7m at end-September 2021). They are entitled to a share in profit (carried interest) at 20% of proceeds from sales over the investors’ preferred return of 8% pa. Members of the investment team also receive a variable remuneration based on the success of DBAG’s long-term investments. The investment team is supported by an extensive external network (‘Executive Circle’) of 99 experienced industrial partners and senior advisors.
DBAG is a self-managed entity and therefore it does not incur any expenses related to external fees and charges. While the operating expenses translate into c 3.3% of the AUM (FY19–FY21 average), they are fully covered by the fee income collected from the managed funds (fees include management, transaction, and incentive fees). As a result the net expense ratio is actually a profit, and amounted to 0.3% of AUM on average in FY19–FY21.
Capital structure
As at end-September 2021 DBAG’s share capital consists of 18.8m ordinary shares of no-par value. During FY21 DBAG issued 3.8m new shares in an 100m equity raise. DBAG shares are predominantly owned by family offices (38%) and individual shareholders (34%).
|
Exhibit 19: Major shareholders |
Exhibit 20: Shareholders by type |
|
|
|
Source: Refinitiv, as at 7 December 2020. |
Source: DBAG, as at 30 September 2021 |
|
Exhibit 19: Major shareholders |
|
|
Source: Refinitiv, as at 7 December 2020. |
|
Exhibit 20: Shareholders by type |
|
|
Source: DBAG, as at 30 September 2021 |
|
|
Research: Investment Companies
Fidelity Emerging Markets (FEML, formerly Genesis Emerging Markets, GSS) was transferred to Fidelity in October 2021, following board recommendation and a favourable shareholder vote. FEML mirrors the FAST fund (£346m at 30 November, see chart below), which has achieved a strong track record over the past 10 years, consistently outperforming the MSCI Emerging Markets Index under lead fund manager Nick Price. Like FAST, FEML can take both long and short positions (subject to strict limits). It is differentiated by the ability to buy less liquid stocks, due to its closed-ended structure. Relative to long-only strategies, FEML can build a higher gross long exposure, which the Fidelity team believes offers greater scope for outperformance.