Last close As at 05/08/2026
GBP3.17
▲ 1.50 (0.48%)
Market capitalisation
GBP2,914m
Research: Investment Companies
Templeton Emerging Markets Investment Trust (TEMIT) has the benefit of two highly experienced managers, Singapore-based Chetan Sehgal and Andrew Ness, who is based in Edinburgh. They can draw on the significant resources of a team of more than 80 investment professionals working in 14 countries around the globe. The managers successfully navigated choppy waters during 2020, a period characterised by bouts of significant stock market volatility due to the global pandemic. TEMIT’s NAV has outperformed the MSCI Emerging Markets Index over the last one, three five and 10 years. Sehgal and Ness are constructive on the outlook for emerging market equities based on improving company fundamentals and relatively attractive valuations.
Templeton Emerging Markets IT |
Successfully navigating choppy waters |
Investment trusts |
28 January 2021 |
Share price/discount performance
Three-year performance vs index
Gearing
Analysts
|
|||||||||||||||||||||||||||||||||||||||||||||||||||||||||||||||||||||||||||||||||||||||||||||
Templeton Emerging Markets Investment Trust (TEMIT) has the benefit of two highly experienced managers, Singapore-based Chetan Sehgal and Andrew Ness, who is based in Edinburgh. They can draw on the significant resources of a team of more than 80 investment professionals working in 14 countries around the globe. The managers successfully navigated choppy waters during 2020, a period characterised by bouts of significant stock market volatility due to the global pandemic. TEMIT’s NAV has outperformed the MSCI Emerging Markets Index over the last one, three five and 10 years. Sehgal and Ness are constructive on the outlook for emerging market equities based on improving company fundamentals and relatively attractive valuations.
|
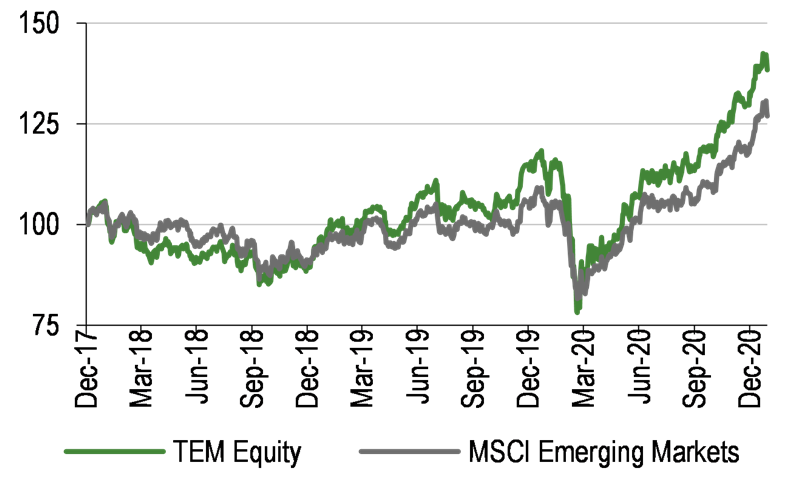
Modest above-index NAV performance during volatile 2020 |
|
|
Source: Refinitiv, Edison Investment Research |
The market opportunity
Emerging markets offer the prospect of above-average economic growth, helped by a range of supports including urbanisation, infrastructure spending, a rising middle class and climate change initiatives. The MSCI Emerging Markets Index is also attractively valued compared with the MSCI World Index. This combination of growth and value may appeal to global investors looking to diversify their exposure.
Why consider investing in TEMIT?
■
Diversified portfolio of high-conviction emerging market equities.
■
Two very experienced managers at the helm, supported by a well-resourced team with local presences in emerging markets.
■
NAV ahead of the benchmark over the last one, three, five and 10 years, along with strong performance versus peers.
■
High level of revenue reserves.
Current discount in line with historical averages
TEMIT is currently trading at an 11.1% discount to cum-income NAV, which is in line with the 10.6% to 12.1% range of average discounts over the last one, three, five and 10 years. The trust pays semi-annual dividends and is well positioned given its significant revenue reserves. Based on its current share price, TEMIT offers a dividend yield of 1.9%, not including a 10.0p per share special dividend in FY21 following a favourable tax ruling.
Exhibit 1: Trust at a glance
Investment objective and fund background |
Recent developments |
|||||||||||||||||||||||||||||||||||||||||||||||||||||||||||||||||||
Launched in June 1989, Templeton Emerging Markets Investment Trust (TEMIT) was one of the first emerging markets funds in the UK. The trust seeks long-term capital appreciation through investment in companies operating in emerging markets, or listed on the stock markets of such countries. This may include companies that have a significant amount of their revenues in emerging markets, but are listed on stock exchanges in developed countries. Performance is benchmarked against the MSCI Emerging Markets Index. |
■ 25 November 2020: Six-month results to 30 September 2020. NAV TR +31.2% versus benchmark TR +24.4%. Share price TR +28.4%. ■ 25 November 2020: Announcement of unchanged 5.0p per share interim dividend and 10.0p per share special dividend (+284.6% year-on-year). ■ 23 September 2020: Appointment of independent director Medha Samant effective 1 October 2020. ■ 9 July 2020: Retirement of non-independent director Gregory Johnson. |
|||||||||||||||||||||||||||||||||||||||||||||||||||||||||||||||||||
Forthcoming |
Capital structure |
Fund details |
||||||||||||||||||||||||||||||||||||||||||||||||||||||||||||||||||
AGM |
July 2021 |
Ongoing charges |
0.99% (H121) |
Group |
Templeton Asset Management |
|||||||||||||||||||||||||||||||||||||||||||||||||||||||||||||||
Final results |
June 2021 |
Net gearing |
0.0% |
Managers |
Chetan Sehgal and Andrew Ness |
|||||||||||||||||||||||||||||||||||||||||||||||||||||||||||||||
Year end |
31 March |
Annual mgmt fee |
Tiered (see pages 8 and 9) |
Address |
5 Morrison Street, Edinburgh, |
|||||||||||||||||||||||||||||||||||||||||||||||||||||||||||||||
Dividend paid |
July and January |
Performance fee |
None |
|||||||||||||||||||||||||||||||||||||||||||||||||||||||||||||||||
Launch date |
12 June 1989 |
Trust life |
Indefinite (subject to vote) |
Phone |
+44 (0)871 384 2505 |
|||||||||||||||||||||||||||||||||||||||||||||||||||||||||||||||
Continuation vote |
Five yearly (next in 2024) |
Loan facilities |
£220m |
Website |
||||||||||||||||||||||||||||||||||||||||||||||||||||||||||||||||
Dividend policy and history (financial years) |
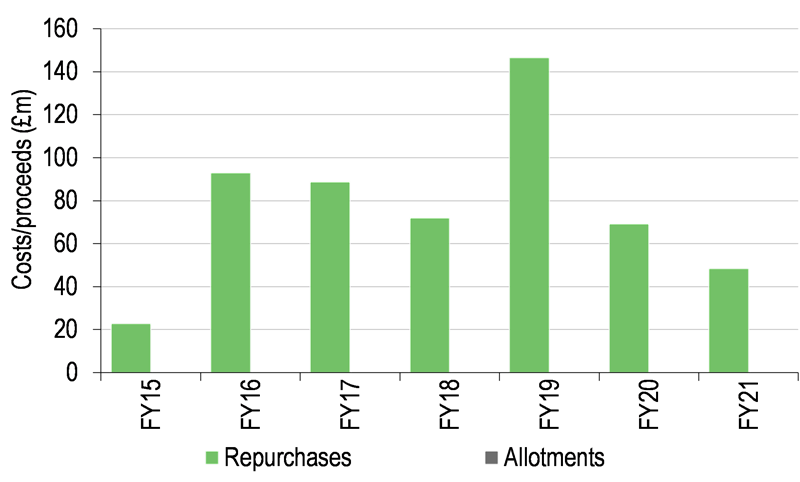
Share buyback policy and history (financial years) |
|||||||||||||||||||||||||||||||||||||||||||||||||||||||||||||||||||
The FY18 dividend was boosted by a change in fee allocations. Dividends were historically paid annually in July, but since FY19 are paid twice a year in July and January. Note: *FY21 final dividend not yet declared. |
Subject to annual renewal, TEMIT is authorised to repurchase up to 14.99% and allot up to 5% of its issued ordinary shares. |
|||||||||||||||||||||||||||||||||||||||||||||||||||||||||||||||||||
|
|
|||||||||||||||||||||||||||||||||||||||||||||||||||||||||||||||||||
Shareholder base (as at 31 December 2020) |
Portfolio exposure by geography (as at 31 December 2020) |
|||||||||||||||||||||||||||||||||||||||||||||||||||||||||||||||||||
|
|
|||||||||||||||||||||||||||||||||||||||||||||||||||||||||||||||||||
Top 10 holdings (as at 31 December 2020) |
||||||||||||||||||||||||||||||||||||||||||||||||||||||||||||||||||||
|
||||||||||||||||||||||||||||||||||||||||||||||||||||||||||||||||||||
Source: TEMIT, Edison Investment Research, Morningstar. Note: *N/A where not in end-December 2019 top 10.
Market outlook: Above-average growth potential
As shown in Exhibit 2 (LHS), emerging markets shares have broadly kept pace with the MSCI World Index (both in sterling terms) and have significantly outperformed the broad UK market over the last five years. There continues to be a variety of reasons why investors should remain optimistic about the growth potential in emerging markets. The urbanisation trend continues as rural populations migrate to cities, seeking higher incomes and standards of living, which requires significant investment in infrastructure projects. A growing middle class is driving overall consumption and demand for consumer durable goods and services, including education and healthcare. The need to address climate change is becoming an increasingly pressing global issue, leading to important areas of development such as renewable energy, battery storage and electric vehicles. Meanwhile, higher political tensions are leading to the unwinding of decades of supply chain integration and affecting trade flows, which is leading to significant shifts in transport and logistics value chains, and associated infrastructure. COVID-19 has accelerated the trend towards digitalisation, and there are many opportunities for emerging market companies to take advantage of this, including the roll-out of mobile and broadband networks and the increase in demand for cloud storage.
Along with above-average growth potential in emerging markets, in aggregate, stocks in the region look relatively attractively valued. At the end of December 2020, the MSCI Emerging Markets Index was trading on lower valuation multiples and offered a higher dividend yield than the MSCI World Index (Exhibit 2, RHS). With this backdrop in mind, global investors may benefit from an allocation to emerging markets, particularly in a fund with a proven record of outperformance.
|
Exhibit 2: Market performance and valuation |
|
Performance of indices in £ (last five years) |
Valuation metrics (as at 31 December 2020) |
|
|
|
Source: Refinitiv, Edison Investment Research, MSCI |
|
Fund profile: Largest UK emerging markets trust
TEMIT is the UK’s largest emerging markets investment trust and was launched in June 1989. Its shares are quoted on both the London and New Zealand stock exchanges. The trust is managed by Franklin Templeton Emerging Markets Equity (FTEME), a pioneer in emerging markets investing with c $34bn of assets under management.
Chetan Sehgal has been TEMIT’s lead manager since 1 February 2018; he is based in Singapore and has 28 years’ investment experience. He was joined in September 2018 by Edinburgh-based Andrew Ness, who has 26 years’ investment experience. The managers aim to generate long-term capital growth by investing in companies listed in emerging markets, or those listed in developed markets that earn a significant amount of their revenues in emerging markets. TEMIT’s performance is measured against the MSCI Emerging Markets Index. To mitigate risk, at the time of investment, a maximum 10% of assets may be invested in a single issuer. Gearing of up to 10% of net asset value (NAV) is permitted; at the end of December 2020, the trust had 0.0% net gearing.
The fund managers: Chetan Sehgal and Andrew Ness
The manager’s view: Leveraging FTEME’s experience
Manager Sehgal comments on the benefits of being able to leverage FTEME’s experience of more than 30 years navigating through market cycles including boom/bust periods in the early 1990s, commodity cycles and the rise of China into a global superpower. FTEME has investment offices in 14 countries and has an integrated research offering, with analysis going back more than 20 years. Over 700 emerging market companies are researched by the FTEME team of 80+ investment professionals, who undertake more than 2,000 company meetings a year; the manager explains that there has been an even higher annualised number during the coronavirus pandemic given the shift to online as well as local physical interactions.
Sehgal highlights FTEME’s ‘three Ss’ approach to long-term investing in emerging markets:
■
Structural (beta) – seeking to capitalise on long-term structural opportunities including demographics, technology and consumption.
■
Sustainable (alpha) – seeking companies with sustainable earnings power that are trading at a discount to their intrinsic worth.
■
Stewardship (delta) – leveraging deep relationships and constructive engagement with companies to promote positive environmental, social and governance (ESG) change.
The manager says the important themes in emerging markets have remained constant over the last two to three years. Technological developments are reshaping the global economy, and not just in terms of e-commerce, as other operations such as entertainment and finance are increasingly moving online. There is much disruption due to technology and companies that can exploit data have a competitive edge. Sehgal notes there are many exciting technology-led opportunities in emerging markets, which historically came mainly from South Korea and China but are now available in many more countries. The manager believes that the emerging market consumer will provide significant growth opportunities for many years to come given the current under-penetration of goods and services compared with developed markets, as well as from premiumisation as demand moves up the value chain over time. Sehgal notes the importance of seeking companies across the market cap spectrum as well as focusing on both sector and geographic diversification in order to seek above-market returns. He also believes that improving governance standards are providing a structural tailwind for the perception and performance of emerging market companies.
When asked why investors should consider emerging markets, the manager says that although the US has outperformed over the last decade on the basis of higher earnings growth and a significant re-rating, and emerging market currencies have devalued by an average 2.9% pa over the period, there are now projections of relatively higher earnings growth in emerging markets. Sehgal suggests that ‘emerging markets deserve a second chance, and the next 10 years could be very different from the last decade’.
The manager highlights the region’s shifting economic landscape: between 2007 and 2020 the ‘old economy’ sectors (materials, energy and industrials) of the MSCI Emerging Markets Index declined from 37% to 17%, while the ‘new economy’ sectors (consumer discretionary and staples, communication services and IT) increased from 36% to 52% of the index. In terms of individual stock opportunities, Sehgal opines that although the four largest index stocks – Taiwan Semiconductor Manufacturing Company (TSMC), Alibaba Group, Tencent Holdings, and Samsung Electronics – have outperformed the broader market significantly over the last five years (and are all represented in TEMIT’s portfolio), he believes that there are also many more emerging markets companies with a good chance of delivering strong returns for shareholders.
Despite the negative effects of COVID-19, the manager suggests that emerging market economies have been somewhat resilient and corporate earnings are coming in above consensus expectations, helped by the adoption of new technologies and the development of dual supply chains in China and internationally (‘one world, two systems’). While the change in US president provides a level of uncertainty over the US’s relationship with China and the potential for tariffs, Sehgal is encouraged by the outlook for emerging markets. He says that long-term fundamentals in the region are favourable; as an example, emerging markets are less indebted than developed markets at the sovereign, corporate and household levels, while relative valuations are attractive. However, he cautions that, as in the past, there could be bouts of stock market volatility.
Asset allocation
Investment process: Utilising FTEME’s deep resources
Sehgal and Ness, who are assisted by portfolio analyst Manish Agarwal, are able to draw on the considerable resources of FTEME’s investment team. The managers are keen to stress that in recent years the levels of collaboration and communication within the team have been improved. There are regular meetings, both formal and informal, and all analysts and portfolio managers are expected to contribute to investment returns. The investment process is research driven and Sehgal and Ness consider that the team’s local presences provide a considerable competitive advantage. ESG considerations are integrated into the decision-making as part of FTEME’s stewardship approach. Risk management is also a very important part of the process, with scenario analysis undertaken to ensure the managers are not taking unintentional risks.
TEMIT has a diversified portfolio of 60–80 high-conviction positions invested across the market cap spectrum; they are selected from an investible universe of more than 700 companies. Sehgal and Ness aim to achieve long-term capital growth by investing in companies with sustainable growth, strong management teams and sound governance, that are trading at a discount to their intrinsic value. They believe that given the wide dispersion of returns between shares in emerging markets, they can generate alpha via stock selection, which is deemed more important than sector and geographic allocation. TEMIT’s active share typically ranges from 70% to 85% (this is a measure of how a fund differs from its benchmark, with 0% representing full index replication and 100% indicating no commonality); it is currently at the lower end of the range.
Current portfolio positioning
At end-December 2020, TEMIT’s top 10 positions made up 58.2% of the fund, which was a higher concentration compared with 46.9% a year earlier; eight positions were common to both periods. Comparing the fund with the benchmark, in aggregate, its holdings have higher returns (on assets, equity and invested capital), lower valuations (trailing P/E ratio and price to book) and a higher dividend yield.
Over the 12 months to the end of December, the largest changes on a sector basis (Exhibit 3) are higher exposures to technology (+9.3pp) and communication services (+2.5pp); these are also the largest overweight positions versus the index (+10.9pp and +6.0pp respectively). The largest sector reductions are lower weightings to financials (-5.7pp) and energy (-4.2pp).
In terms of geographic exposure (Exhibit 4), the largest changes over the last 12 months are higher weightings in South Korea (+6.7pp) and Taiwan (+4.5pp), with lower weightings in Russia (-3.0pp) and Brazil (-2.6pp). TEMIT’s largest active weights are an overweight position in South Korea (+9.2pp) and an underweight exposure to Hong Kong/China/Macau (-9.2pp).
Exhibit 3: Portfolio sector exposure vs benchmark (% unless stated)
Portfolio end-Dec 2020 |
Portfolio end-Dec 2019 |
Change |
Index |
Active weight |
Trust weight/ |
|
Information technology |
31.4 |
22.1 |
9.3 |
20.5 |
10.9 |
1.5 |
Financials |
19.1 |
24.8 |
(5.7) |
18.0 |
1.1 |
1.1 |
Consumer discretionary |
18.7 |
17.8 |
0.9 |
18.3 |
0.4 |
1.0 |
Communication services |
17.6 |
15.1 |
2.5 |
11.6 |
6.0 |
1.5 |
Consumer staples |
4.5 |
5.4 |
(0.9) |
5.9 |
(1.4) |
0.8 |
Materials |
3.5 |
4.0 |
(0.5) |
7.6 |
(4.1) |
0.5 |
Energy |
3.0 |
7.2 |
(4.2) |
5.0 |
(2.0) |
0.6 |
Industrials |
2.7 |
2.3 |
0.4 |
4.3 |
(1.7) |
0.6 |
Healthcare |
0.8 |
1.6 |
(0.8) |
4.7 |
(3.9) |
0.2 |
Utilities |
0.0 |
0.0 |
0.0 |
2.0 |
(2.0) |
0.0 |
Real estate |
0.0 |
0.0 |
0.0 |
2.1 |
(2.1) |
0.0 |
Other net assets |
(1.2) |
(0.3) |
(0.9) |
0.0 |
(1.2) |
N/A |
100.0 |
100.0 |
100.0 |
Source: Templeton Emerging Markets Investment Trust, Edison Investment Research. Note: Numbers subject to rounding.
Exhibit 4: Portfolio geographic exposure vs benchmark (% unless stated)
Portfolio end-Dec 2020 |
Portfolio end-Dec 2019 |
Change |
Index |
Active weight |
Trust weight/ |
|
Hong Kong/China/Macao |
29.9 |
28.5 |
1.4 |
39.1 |
(9.2) |
0.8 |
South Korea |
22.6 |
15.9 |
6.7 |
13.5 |
9.2 |
1.7 |
Taiwan |
15.5 |
11.0 |
4.5 |
12.8 |
2.8 |
1.2 |
Brazil |
6.8 |
9.4 |
(2.6) |
5.1 |
1.7 |
1.3 |
Russia |
6.2 |
9.2 |
(3.0) |
3.0 |
3.2 |
2.1 |
India |
5.8 |
7.4 |
(1.6) |
9.3 |
(3.4) |
0.6 |
South Africa |
3.4 |
3.0 |
0.4 |
3.5 |
0.0 |
1.0 |
UK |
2.3 |
2.7 |
(0.4) |
0.0 |
2.3 |
N/A |
Thailand |
1.8 |
2.8 |
(1.0) |
1.8 |
0.0 |
1.0 |
US |
1.4 |
2.8 |
(1.4) |
0.0 |
1.4 |
N/A |
Rest of the world |
5.4 |
7.6 |
(2.2) |
12.1 |
(6.7) |
0.4 |
Other net assets |
(1.2) |
(0.3) |
(0.9) |
0.0 |
(1.2) |
N/A |
100.0 |
100.0 |
100.0 |
Source: Templeton Emerging Markets Investment Trust, Edison Investment Research. Note: Numbers subject to rounding.
Commenting on selected portfolio activity in recent months, Sehgal highlights the addition to TEMIT’s largest holding. He says that South Korea-based semiconductor and consumer electronics company Samsung Electronics ‘stands out to us for its dominance in the memory chip and smartphone industries, and we believe that it is well positioned to gain market share amid US sanctions on Chinese technology companies’.
During H121 there were two new additions to the portfolio. Taiwan-based MediaTek is a global fabless semiconductor company that enables 1.5bn connected devices a year. It is a market leader in developing innovative systems-on-chip (SoC) for mobile device, home entertainment, connectivity and internet of things (IoT) products. In Q320, MediaTek’s revenues rose by 44.7% year-on-year, while its net profit increased by 93.7% as a result of margin expansion.
Tencent Music Entertainment Group (TME) is the leading online music entertainment platform in China, via its apps QQ Music, Kugou Music, Kuwo Music and WeSing. The company’s platform comprises online music, online karaoke and music-centric live streaming services. In Q320, TME’s total revenues increased by 16.4% year-on-year, helped by a 55.0% rise in online music subscription revenues. Online music paying users reached 51.7 million (up by nearly 50% year-on-year), and the paying ratio was 8.0% (Q319: 5.4%).
Performance: Long-term record of outperformance
Exhibit 5: Five-year discrete performance data
12 months ending |
Share price |
NAV |
MSCI Emerging |
MSCI World |
CBOE UK All Companies (%) |
31/12/16 |
47.8 |
49.2 |
33.1 |
29.0 |
16.5 |
31/12/17 |
32.5 |
30.8 |
25.8 |
12.4 |
14.0 |
31/12/18 |
(10.7) |
(11.6) |
(8.9) |
(2.5) |
(9.8) |
31/12/19 |
27.1 |
24.1 |
14.3 |
23.4 |
19.3 |
31/12/20 |
17.1 |
15.7 |
15.0 |
12.9 |
(10.9) |
Source: Refinitiv. Note: All % on a total return basis in pounds sterling.
Looking at TEMIT’s discrete-year performance in Exhibit 5, the trust’s total returns are ahead of those of the MSCI Emerging Markets Index in four out of the last five years in both NAV and share price terms.
In H121 (ending 30 September 2020), TEMIT’s NAV and share price total returns of +31.2% and +28.4% respectively were meaningfully ahead of the benchmark’s +24.4% total return. The largest stock contributors to total return were NAVER (+1.6pp), TSMC (+1.5pp) and Yandex (+0.9pp). NAVER in South Korea and Yandex in Russia are both the leading internet search engines in their home markets and offer a wide range of other online services such as e-commerce. These companies have benefited from increased demand during the pandemic. TSMC is a leading semiconductor manufacturer that has experienced higher demand due to the greater use of cloud-based applications related to remote working and online education; this trend has also accelerated during the pandemic. The company has exceeded consensus earnings expectations and has raised its full-year revenue guidance.
TEMIT’s largest detractors on a relative basis in H121 were not owning Chinese shopping platform Meituan (-0.7pp) and Indian conglomerate Reliance Industries (-0.6pp), both of which performed well, and its holdings in Banco Itaú Unibanco and ICICI Bank (both -0.5pp). Bank stocks have been negatively affected by concerns about economic weakness due to COVID-19 and expectations of slowing loan growth, lower margins and rising bad debts.
By sector, the best contributors to relative performance were communication services (+3.7pp), technology (+1.4pp) and financials (+1.2pp), while the largest detractors were consumer discretionary (-1.3pp), materials (-0.5pp) and energy (-0.4pp). Looking at country exposures, the highest contributors to relative performance were Taiwan (+1,8pp), South Korea (+1.6pp) and Russia (+1.2pp), with the laggards being India (-0.4pp) and Brazil (-0.3pp).
|
Exhibit 6: Investment trust performance to 31 December 2020 |
|
Price, NAV and benchmark total return performance, one-year rebased |
Price, NAV and benchmark total return performance (%) |
|
|
|
Source: Refinitiv, Edison Investment Research. Note: Three-, five- and 10-year performance figures annualised. |
|
TEMIT’s relative returns are shown below in Exhibit 7. It is ahead of the benchmark over one, three, five and 10 years in NAV terms (and over one, three and five years in share price terms). The outperformance versus the broad UK market over one, three and five years is particularly notable, illustrating the potential benefits of investing overseas.
Exhibit 7: Share price and NAV total return performance, relative to indices (%)
|
One month |
Three months |
Six months |
One year |
Three years |
Five years |
10 years |
Price relative to MSCI Emerging Markets |
1.0 |
2.9 |
4.8 |
1.8 |
11.0 |
29.8 |
(0.9) |
NAV relative to MSCI Emerging Markets |
0.0 |
(1.2) |
0.6 |
0.6 |
6.1 |
23.5 |
1.0 |
Price relative to MSCI World |
4.1 |
8.1 |
11.7 |
3.7 |
(2.2) |
32.1 |
(45.9) |
NAV relative to MSCI World |
3.0 |
3.7 |
7.2 |
2.5 |
(6.5) |
25.7 |
(44.8) |
Price relative to CBOE UK All Companies |
2.3 |
3.3 |
14.4 |
31.4 |
38.7 |
104.5 |
(1.9) |
NAV relative to CBOE UK All Companies |
1.2 |
(0.9) |
9.9 |
29.9 |
32.5 |
94.6 |
(0.0) |
Source: Refinitiv, Edison Investment Research. Note: Data to end-December 2020. Geometric calculation.
|
Exhibit 8: NAV total return performance relative to benchmark over three years |
|
|
Source: Refinitiv, Edison Investment Research |
Discount: Narrowing trend
TEMIT’s shares are currently trading at an 11.1% discount to cum-income NAV, which compares with a range of discounts over the last 12 months from 8.4% to a decade-wide 19.9% (during the coronavirus-led market selloff). It is broadly in line with the 11.5%, 11.4%, 12.1% and 10.6% average discounts over the last one, three, five and 10 years respectively. Historically, the board has regularly repurchased shares with the aim of reducing the volatility of the discount. During H121, 5.8m shares were bought back (2.4% of the share base) at a cost of £45.3m.
|
Exhibit 9: Share price discount to NAV (including income) over three years (%) |
|
|
Source: Refinitiv, Edison Investment Research |
Capital structure and fees
TEMIT is a conventional investment trust with one class of share; there are currently 236.3m ordinary shares in issue. The trust has two debt facilities with Scotiabank – a £120m three-year multi-currency revolving credit facility (RCF) expiring on 31 January 2023, and a £100m, 2.089%, sterling fixed-rate term loan maturing on 31 January 2025. Interest on the RCF will be based on market rates at the time of drawdown, which may be in sterling, US dollars or Chinese renminbi; the maximum amount of renminbi that may be drawn down is 45% of the £220m total debt facility. At end-December 2020, the trust had 0.0% net gearing.
Effective 1 July 2020, FTEME is paid an annual management fee of 1.0% of net assets up to £1bn and 0.80% of net assets above this level (previously 0.85% above £1bn); no performance fee is payable. Based on TEMIT’s 30 September 2020 net assets, this results in an annual saving of £0.6m. In H121, the trust’s ongoing charges were 0.99% compared with 1.02% in FY20.
TEMIT is subject to a five-yearly continuation vote, with the next due at the July 2024 AGM (the July 2019 vote was passed by a 99.95% majority). In May 2019, the board announced a five-year, performance-related conditional tender offer, subject to the next continuation vote being passed. If the trust’s NAV performance lags its benchmark in the five years ending 31 March 2024, the board, at its discretion, will undertake a tender offer for up to 25% of TEMIT’s shares in issue, at a price equivalent to the prevailing NAV minus 2% and the costs of the offer.
Dividend policy and record
In H121, TEMIT’s revenue earnings per share were 11.4p, which was 25.5% lower year-on-year, primarily due to the negative effects of the COVID-19 pandemic. The board has declared a 5.0p per share interim dividend, which is unchanged year-on-year. It has also announced a 10.0p per share special dividend to distribute a corporation tax rebate from HMRC relating to tax paid a number of years ago. At the end of H121, TEMIT had substantial revenue reserves of £140.8m, which is equivalent to c 3x the last annual ordinary dividend. Based on its current share price, the trust offers a 1.9% dividend yield.
Peer group comparison
Exhibit 10: Selected global emerging markets peer group as at 27 January 2021*
% unless stated |
Market cap (£m) |
NAV TR |
NAV TR |
NAV TR |
NAV TR |
Discount (cum fair) |
Ongoing charge |
Perf. |
Net gearing |
Dividend yield |
Templeton Emerging Markets IT |
2,337.5 |
26.4 |
32.1 |
178.9 |
88.9 |
(12.6) |
1.0 |
No |
100 |
1.9 |
Aberdeen Emerging Markets |
330.9 |
25.1 |
25.0 |
121.5 |
74.3 |
(14.0) |
1.1 |
No |
103 |
0.0 |
BlackRock Frontiers |
288.8 |
3.1 |
(13.3) |
54.2 |
77.9 |
(2.0) |
1.4 |
Yes |
109 |
4.3 |
Fundsmith Emerging Equities Trust |
385.1 |
19.1 |
21.6 |
70.0 |
|
(3.4) |
1.3 |
No |
100 |
0.2 |
Genesis Emerging Markets Fund |
1,090.8 |
15.3 |
19.7 |
107.8 |
77.9 |
(9.9) |
1.1 |
No |
100 |
1.5 |
JPMorgan Emerging Markets |
1,655.3 |
28.3 |
42.0 |
159.6 |
144.7 |
(1.8) |
0.9 |
No |
100 |
1.0 |
JPMorgan Global EM Income |
449.6 |
17.7 |
26.6 |
131.2 |
116.3 |
(4.9) |
1.2 |
No |
106 |
3.4 |
Utilico Emerging Markets |
429.4 |
(11.1) |
(4.6) |
43.9 |
70.6 |
(14.2) |
1.1 |
Yes |
110 |
3.9 |
Average (8 trusts) |
870.9 |
15.5 |
18.6 |
108.4 |
92.9 |
(7.9) |
1.1 |
103 |
2.0 |
|
TEM rank in peer group |
1 |
2 |
2 |
1 |
3 |
6 |
7 |
5= |
4 |
Source: Morningstar, Edison Investment Research. Note: *Performance as at 26 January 2021 based on ex-par NAVs. TR = total return. Net gearing is total assets less cash and equivalents as a percentage of net assets.
There are 14 funds in the AIC Global Emerging Markets sector. In Exhibit 10, we show the largest eight; TEMIT ranks first by quite some margin with a market cap of c £2.3bn. Its NAV total returns are above average over one, three and five years, ranking second over one and three years and first over five years; the trust ranks third (out of seven funds) over the last decade. On the date shown in the table, the trust’s discount was wider than average (none of the funds were trading at a premium). TEMIT has the second-lowest ongoing charge in the selected peer group, is currently ungeared and has a dividend yield that is modestly below the mean.
The board
TEMIT’s board has six directors, all of whom are non-executive and independent of the manager. The chairman is Paul Manduca, who joined the board on 1 August 2015 and assumed his current role on 20 November 2015. Senior independent director Beatrice Hollond was appointed on 1 April 2014, Simon Jeffreys on 15 July 2016, David Graham on 1 September 2016 and Charlie Ricketts on 12 July 2018. The newest director is Medha Samant, who joined the board on 1 October 2020. She has 27 years’ experience based in Hong Kong, working with asset management companies in the Asia-Pacific equity markets covering marketing, business development, portfolio management and research, including a recent focus on ESG.
|
|
Research: TMT
Management has confirmed that FY20 revenues and adjusted PBT will be marginally ahead of guidance, with revenues of €373m (guidance c €367m) and adjusted PBT of €55m (guidance c €52m). This outperformance has been driven by a strong close to the year, together with an additional revenue contribution from December’s M&A. Given the headwinds from COVID-19 in FY20, underlying organic revenue growth of 12% (H120: 8.0%, FY19: 15.5%) is a hugely resilient performance. The group is set well for FY21 and, with a growing next-gen console base in FY22/23, the medium-term outlook appears bright. With net cash of c €100m, Keywords remains well placed to execute further M&A deals in FY21.