Last close As at 05/08/2026
GBP18.88
▲ 108.00 (6.07%)
Market capitalisation
GBP572m
Avon Rubber has produced a strong set of interim results, with strong organic growth at Avon Protection and a much improved first half performance by milkrite | InterPuls in dairy. With the newly acquired Helmets & Armor line of business adding another growth stream, the outlook for the group is for the delivery of profitable growth notwithstanding the current pandemic.
Written by
Avon Rubber |
Strong growth in resilient markets |
H120 results |
Aerospace & defence |
20 May 2020 |
Share price performance
Business description
Next events
Analyst
Avon Rubber is a research client of Edison Investment Research Limited |
|||||||||||||||||||||||||||||||||||||||||||||
Avon Rubber has produced a strong set of interim results, with strong organic growth at Avon Protection and a much improved first half performance by milkrite | InterPuls in dairy. With the newly acquired Helmets & Armor line of business adding another growth stream, the outlook for the group is for the delivery of profitable growth notwithstanding the current pandemic.
Year end |
Revenue (£m) |
PBT* |
EPS* |
DPS |
P/E |
Yield |
09/18 |
165.5 |
27.2 |
76.6 |
16.0 |
38.8 |
0.5 |
09/19 |
179.3 |
31.4 |
90.9 |
20.8 |
32.7 |
0.7 |
09/20e |
233.0 |
35.4 |
93.1 |
27.1 |
32.0 |
0.9 |
09/21e |
288.4 |
49.2 |
129.5 |
35.2 |
23.0 |
1.2 |
Note: Note: *PBT and EPS are normalised, excluding amortisation of acquired intangibles, exceptional items and share-based payments. After adoption of IFRS 16.
Delivering on the strategy in H120
Management continues to successfully execute the three pronged strategy of organically growing core activities, enhanced by a focus on selective new product development and augmented by value-creating M&A. Avon Protection and milkrite | InterPuls both delivered strong organic sales growth of 10.0% and 8.5% respectively, albeit against a subdued prior year comparison. At Avon Protection both the Military and ongoing First Responders lines of business delivered strong organic revenue growth, which was boosted by the acquisition of Helmets & Armor from the start of Q220. All lines of the dairy business in all geographies drove the improved performance at milkrite | InterPuls. There was a £94.1m cash outflow that left net debt at £45.8m (excluding lease liabilities of £21.1m), £90.7m of which related to the acquisition. The interim dividend was once again increased by 30% to 9.02p per share, reflecting management confidence in prospects.
Order backlogs underpin sustained growth
H120 order backlog at Avon Protection of £110.6m was almost double the position a year earlier as Military continued to deliver its existing strong backlog and Helmets & Armor added £64.8m, which should support maintenance of the quarterly sales rate it delivered in Q220 through the second half of the year. Recent contract awards should kick in from FY21, with the anticipated $5m of cost synergies progressively improving margins. Favourable dairy market conditions also supported a positive book to bill performance at milkrite | InterPuls, with an opening H220 backlog of £4.9m (H119: £3.7m).
Valuation: Maintaining premium rating
Avon has maintained its rating in the recent market turmoil, reflecting the robust financial performance augmented by the acquisition. We continue to feel that the group is well positioned strategically to weather the pandemic as defence and dairy markets appear resilient. The FY21 P/E multiple of 23.0x reflects the strong growth being delivered.
H120 results
The performance in H120 was much stronger than the challenging prior year period with strong momentum in Avon Protection carried through from H219, a much improved dairy performance supported by improved markets, and a strong initial contribution from the new Helmets & Armor line of business acquired at the beginning of Q220.
■
Orders received £117.9m (H119: £94.9m), up 24.2% or down 4.7% at organic constant currency, and representing a book to bill ratio of 1.25x.
■
Closing order book up 95.4% at £115.5m, down 15.6% at organic constant currency.
■
Reported H120 revenues of £94.7m (H119: £73.6m), up 28.7%, or 9.5% at organic constant currency.
■
Adjusted H120 operating profit of £15.6m (H119: £9.0m) up 73.3%, or 45.2% on an organic constant currency basis.
■
Adjusted H120 profit before tax up 67.0% at £14.7m (H119: £8.8m), up 39.8%% at organic constant currency.
■
Adjusted H120 EPS rose 64.2% to 38.1p (H119: 23.2p) or 37.5% at constant currency.
■
Interim DPS was 9.02p (H119: 6.94p), an increase of 30.0%.
■
Net financial debt £45.8m excluding £21.1m of lease liabilities compared to net cash of £48.3m excluding lease liabilities of £11.3m at the start of the year.
Exhibit 1: Avon Rubber H120 results summary
Half year to March (£m) |
H119 |
H120 |
% change |
% change at OCC* |
Orders |
||||
Avon Protection |
69.3 |
90.5 |
30.6% |
(9.2%) |
milkrite I InterPuls |
25.6 |
27.4 |
7.0% |
7.5% |
Total orders |
94.9 |
117.9 |
24.2% |
(4.7%) |
Revenues |
||||
Avon Protection |
49.3 |
68.4 |
38.7% |
10.0% |
Of which |
||||
Military |
30.9 |
37.2 |
20.4% |
20.2% |
Helmets & Armor |
13.8 |
|||
First responder |
18.4 |
17.4 |
(5.4%) |
(6.8%) |
milkrite I InterPuls |
24.3 |
26.3 |
8.2% |
8.5% |
Of which |
||||
Interface |
17.4 |
18.7 |
7.5% |
7.1% |
Precision, Control & Intelligence |
4.3 |
4.5 |
4.7% |
8.7% |
Farm Services |
2.6 |
3.1 |
19.2% |
17.8% |
Total group revenues |
73.6 |
94.7 |
28.7% |
9.5% |
Adjusted operating profit |
||||
Avon Protection |
6.7 |
12.8 |
91.0% |
55.1% |
milkrite I InterPuls |
3.4 |
4.1 |
20.6% |
17.5% |
Other |
(1.1) |
(1.3) |
18.2% |
(15.4%) |
Total adjusted operating profit |
9.0 |
15.6 |
73.3% |
45.2% |
Adjusted operating profit margin |
||||
Avon Protection |
13.6% |
18.7% |
37.7% |
|
milkrite I InterPuls |
14.0% |
15.6% |
11.4% |
|
Total adjusted operating profit margin |
12.2% |
16.5% |
34.7% |
|
EPS adjusted (p) |
23.2 |
38.1 |
64.20% |
37.5% |
DPS (p) |
6.94 |
9.02 |
30.0% |
30.0% |
Net cash/(debt) |
48.3 |
(45.8) |
N/M |
|
Lease liabilities |
(11.3) |
(21.1) |
86.7% |
|
Net financial liabilities |
37.0 |
(66.9) |
N/M |
Source: Company reports. Note: *Organic constant currency.
Avon Protection
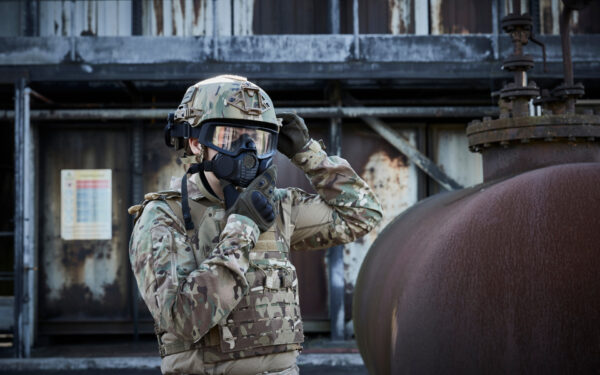
Avon Protection’s revenues grew 38.7% to £68.4m. The divisional EBITDA contribution was 34.3% higher at £16.1m, a 400bp increase in margin to 23.5%. The Military line of business of Avon Protection is the de facto, sole source supplier to the US DOD of General Purpose Masks, Tactical Masks, Power Air Systems and Tactical SCBA (self-contained breathing apparatus). It also supplies systems to international export customers, which accounted for 53% of H120 Military sales. The newly acquired Helmets & Armor extends the product offering to body armour and helmets, primarily for the DOD. First Responders supplies systems to law enforcement, fire and other emergency services.
Military grew strongly with organic growth of 20.2% as it continued to supply the multi-year mask systems contracts. The positive momentum should continue in the second half and is supported by a £36.5m order backlog at H120. The business continues to pursue additional export opportunities and talks regarding the replenishment contract for M50 general purpose mask systems for the DOD are said to be at an advanced stage.
Helmets & Armor made an initial contribution to revenues of £13.8m in Q220, and management expects to maintain that quarterly run rate during H220 before deliveries against the recently announced contract awards commence in FY21. The order backlog at H120 was £64.8m, which provides good medium-term visibility. Clearly, FY21 growth will also reflect a full year contribution from the line of business compared to nine months in FY20. Management also says it is on track to deliver the $5m of anticipated cost synergies by the end of FY21.
Excluding the revenue decline that resulted from the withdrawal from the fire SCBA market (FY19 revenues: £6.7m), First Responder revenues grew organically at constant currency by 6.6% to £17.4m in H120. The line of business is experiencing some increase in demand for filters accessories and spares as a result of COVID-19. The H120 order backlog stood at £9.3m. However, management does not expect to make up the fire SCBA shortfall in the full year.
Milkrite | InterPuls
There was also strong growth at milkrite | InterPuls, where favourable dairy market conditions supported positive farmer sentiment. Increased global production combined with stable milk and feed prices. Revenues grew in all three lines of activity (Interface, Precision Control & Intelligence and Farm Services). Orders received of £27.4m were 7.5% higher organically than in H119, and provided a backlog of £4.9m to underpin H220 prospects, an increase of 33.1%. Adjusted EBITDA of £5.8m was 11.5% higher organically with margins of 22.0%, 60bp better organically than in H119.
Finance
Excluding lease liabilities, the company moved from net cash of £48.3m at the start of the year to a net debt position of £45.8m at H120, almost entirely as a result of the acquisition of Helmets & Armor on 2 January 2020. The company is still awaiting payment of a $16.6m Rest of the World Military mask system contract that was delivered in FY19 and this is expected in H220.
The adoption of IFRS 16 accounting has added £21.1m of lease liabilities to net group net debt at H120, including £8.5m added by the acquisition of Helmets & Armor. These predominantly relate to property leases.
At the period end, the group had £15.8m undrawn on its $85m (£69.5m) RCF and gross cash of £7.8m, providing £23.7m of liquidity headroom. The net debt to EBITDA ratio (excluding lease liabilities) was 1.0x at H120, well below the debt covenant level of 3.0x. Management expects both liquidity and leverage to improve in H220.
Outlook
While COVID-19 uncertainty continues to weigh on markets, it would appear that Avon Rubber’s combination of defence and dairy revenues should remain largely unscathed. Both are classified as essential by the US, UK and Italian governments, and disruption has been minimal with no headcount reductions required. Measures have been implemented to ensure the safety of staff and employees. Longer-term budgetary issues could influence defence spending, but the critical nature of Avon Protection’s products and need for maintaining stocks would appear to be supportive of sustained volumes.
The continuing strength of the Military line of business and the full second half contribution from Helmets & Armor should deliver strong growth in adjusted operating profit for Avon Protection, more than offsetting the impact on the First Responders line of business of the withdrawal from the Fire SCBA market.
The board is confident of achieving FY20 expectations and we have maintained our estimates for revenues, adjusted PBT, adjusted EPS and net debt before finance leases. The EBITDA and adjusted operating profit increases reflect the adoption of IFRS 16, which spreads the cost of finance leases between interest and depreciation charges.
Exhibit 2: Avon Rubber earnings estimates revisions
Year to September (£m) |
2020e |
2021e |
||||
|
Prior |
New |
% change |
Prior |
New |
% change |
Avon Protection |
179.8 |
179.8 |
0.0% |
233.6 |
233.6 |
0.0% |
milkrite I InterPuls |
53.2 |
53.2 |
0.0% |
54.8 |
54.8 |
0.0% |
Total Sales |
233.0 |
233.0 |
0.0% |
288.4 |
288.4 |
0.0% |
|
|
|
|
|
|
|
EBITDA |
47.4 |
50.2 |
5.9% |
62.1 |
65.1 |
4.8% |
|
|
|
|
|
|
|
Avon Protection |
31.4 |
31.8 |
1.2% |
44.1 |
44.6 |
1.1% |
milkrite I InterPuls |
8.1 |
8.4 |
2.6% |
8.5 |
8.8 |
2.6% |
Unallocated |
(3.0) |
(2.9) |
-3.5% |
(3.1) |
(3.0) |
-3.5% |
Adjusted EBITA |
36.6 |
37.3 |
1.9% |
49.6 |
50.4 |
1.6% |
|
|
|
|
|
|
|
Adjusted PBT |
35.4 |
35.4 |
0.0% |
49.2 |
49.2 |
0.0% |
|
|
|
|
|
|
|
EPS - adjusted fully diluted continuing (p) |
93.1 |
93.1 |
0.0% |
129.5 |
129.5 |
0.0% |
DPS (p) |
27.1 |
27.1 |
0.0% |
35.2 |
35.2 |
0.0% |
Net debt/(cash) excluding finance leases |
8.7 |
8.7 |
0.0% |
(12.1) |
(12.1) |
0.0% |
Source: Edison Investment Research estimates
Exhibit 3: Financial summary
£m |
2018 |
2019 |
2020e |
2021e |
||
Year end 30 September |
IFRS |
IFRS |
IFRS |
IFRS |
||
PROFIT & LOSS |
||||||
Revenue |
|
|
165.5 |
179.3 |
233.0 |
288.4 |
Cost of Sales |
(99.9) |
(106.8) |
(138.8) |
(171.8) |
||
Gross Profit |
65.6 |
72.5 |
94.2 |
116.6 |
||
EBITDA |
|
|
35.3 |
41.3 |
50.2 |
65.1 |
Operating Profit (before amort. and except.) |
|
|
30.4 |
35.9 |
41.7 |
55.4 |
Intangible Amortisation |
(3.1) |
(3.9) |
(4.4) |
(4.9) |
||
Operating profit (company definition) |
27.3 |
32.0 |
37.3 |
50.4 |
||
Exceptionals |
(5.6) |
(17.7) |
(8.0) |
(6.3) |
||
Other |
(0.1) |
(0.7) |
(1.2) |
(1.1) |
||
Operating Profit |
21.6 |
13.6 |
28.1 |
43.1 |
||
Net Interest |
0.0 |
0.1 |
(0.7) |
(0.2) |
||
Profit Before Tax (norm) |
|
|
27.2 |
31.4 |
35.4 |
49.2 |
Profit Before Tax (FRS 3) |
|
|
21.6 |
13.7 |
27.4 |
42.9 |
Tax |
(1.8) |
600 |
(5,198) |
(8,152) |
||
Profit After Tax (norm) |
23.5 |
28.0 |
28.6 |
39.9 |
||
Profit After Tax (FRS 3) |
19.8 |
14.3 |
22.2 |
34.8 |
||
Average Number of Shares Outstanding (m) |
30.5 |
30.5 |
30.5 |
30.5 |
||
EPS - normalised (p) |
|
|
77.1 |
91.7 |
93.8 |
130.6 |
EPS - normalised & fully diluted (p) |
|
|
76.6 |
90.9 |
93.1 |
129.5 |
EPS - (IFRS) (p) |
|
|
64.9 |
46.9 |
72.6 |
113.9 |
Dividend per share (p) |
16.0 |
20.8 |
27.1 |
35.2 |
||
Gross Margin (%) |
39.6 |
40.4 |
40.4 |
40.4 |
||
EBITDA Margin (%) |
21.3 |
23.0 |
21.6 |
22.6 |
||
Operating Margin (before GW and except.) (%) |
18.4 |
20.0 |
17.9 |
19.2 |
||
BALANCE SHEET |
||||||
Fixed Assets |
|
|
64.1 |
64.4 |
148.6 |
144.2 |
Intangible Assets |
41.5 |
35.3 |
59.2 |
56.0 |
||
Tangible Assets |
22.6 |
21.4 |
72.8 |
73.9 |
||
Right of Use Asset |
7.7 |
16.6 |
14.4 |
|||
Investments |
0.0 |
0.0 |
0.0 |
0.0 |
||
Current Assets |
|
|
102.0 |
117.5 |
84.7 |
106.1 |
Stocks |
23.0 |
20.7 |
27.2 |
34.0 |
||
Debtors |
24.2 |
35.4 |
34.1 |
42.2 |
||
Cash |
46.6 |
48.4 |
10.4 |
17.0 |
||
Other |
8.2 |
13.0 |
13.0 |
13.0 |
||
Current Liabilities |
|
|
(41.4) |
(35.4) |
(65.0) |
(61.3) |
Creditors |
(41.3) |
(35.3) |
(45.8) |
(56.5) |
||
Short term borrowings |
(0.1) |
(0.1) |
(19.2) |
(4.8) |
||
Long Term Liabilities |
|
|
(39.9) |
(62.0) |
(70.8) |
(68.6) |
Long term borrowings |
0.0 |
0.0 |
0.0 |
0.0 |
||
Lease Liabilities |
(11.3) |
(20.2) |
(18.0) |
|||
Other long term liabilities |
(39.9) |
(50.7) |
(50.6) |
(50.6) |
||
Net Assets |
|
|
84.8 |
84.5 |
97.4 |
120.4 |
CASH FLOW |
||||||
Operating Cash Flow |
|
|
33.4 |
15.2 |
48.0 |
57.6 |
Net Interest |
(0.2) |
0.0 |
(0.7) |
(0.2) |
||
Tax |
(1.8) |
0.6 |
(5.2) |
(8.2) |
||
Capex |
(8.9) |
(7.9) |
(18.7) |
(15.8) |
||
Acquisitions/disposals |
5.1 |
0.0 |
(72.4) |
(2.4) |
||
Financing |
(1.1) |
(1.3) |
(1.0) |
(1.0) |
||
Dividends |
(4.1) |
(5.4) |
(7.1) |
(9.1) |
||
Other |
(0.6) |
0.6 |
0.0 |
0.0 |
||
Net Cash Flow |
21.8 |
1.8 |
(57.0) |
20.9 |
||
Opening net debt/(cash) |
|
|
(24.7) |
(46.5) |
(48.3) |
8.7 |
HP finance leases initiated |
0.0 |
0.0 |
0.0 |
0.0 |
||
Other |
0.0 |
0.0 |
0.0 |
0.0 |
||
Closing net debt/(cash) |
|
|
(46.5) |
(48.3) |
8.7 |
(12.1) |
Total net financial liabilities |
|
|
(46.5) |
(37.0) |
28.9 |
5.9 |
Source: Company reports, Edison Investment Research estimates
|
|
Research: Real Estate
The COVID-19 pandemic has thus far had no impact on Civitas Social Housing’s rent collection or financial performance and the portfolio continues to grow and perform as expected. In the three months ended 31 March 2020 (Q420), IFRS NAV per share increased marginally and quarterly dividends continued. As a result of continuing acquisitions and CPI-linked rental growth, the run rate of dividend cover has reached 100% and the target DPS for the current year has been increased by 1.9% to 5.4p/share.