Last close As at 05/08/2026
GBP5.24
▲ 7.00 (1.35%)
Market capitalisation
GBP232m
Research: Investment Companies
Standard Life UK Smaller Companies Trust
Standard Life UK Smaller Companies |
High-conviction portfolio of UK smaller-cap stocks |
Investment trusts |
12 January 2017 |
Share price/discount performance
Three-year performance vs index
Gearing
Analysts
|
|||||||||||||||||||||||||||||||||||||||||||||||||||||||||||||||||||||||||||||||||||||
Standard Life UK Smaller Companies Trust (SLS) aims to generate long-term capital growth from a portfolio of high-quality smaller-cap UK equities. Manager Harry Nimmo follows a long-standing, consistent investment process to construct a relatively concentrated portfolio of c 55 high-conviction holdings. SLS’s NAV total returns are ahead of the benchmark Numis Smaller Companies ex-Investment Companies index over three, five and 10 years and SLS leads the pack versus peers over 10 years. SLS’s annual dividend has compounded at an average annual rate of 23.5% over the last 10 years.
12 months ending |
Share price |
NAV |
Numis Smaller Cos ex-ICs (%) |
FTSE AIM (%) |
FTSE All-Share (%) |
FTSE 250 |
31/12/12 |
32.6 |
25.1 |
29.9 |
2.9 |
12.3 |
26.1 |
31/12/13 |
41.3 |
40.0 |
36.9 |
21.3 |
20.8 |
32.3 |
31/12/14 |
(15.1) |
(7.1) |
(1.9) |
(16.5) |
1.2 |
3.7 |
31/12/15 |
40.4 |
29.7 |
10.6 |
6.6 |
1.0 |
11.2 |
31/12/16 |
(3.5) |
5.5 |
11.1 |
16.1 |
16.8 |
6.7 |
Source: Thomson Datastream. Note: All % on a total return basis in GBP.
Investment strategy: Quality and high conviction
Harry Nimmo has a long-standing, disciplined investment process with a three-step approach – top-level, qualitative guidelines, a stock selection matrix and fundamental analysis. He aims to invest in quality companies with sustainable long-term growth in earnings and dividends. The matrix is used to sift c 800 companies in the investable universe and has a range of factors including earnings and revisions momentum, balance sheet strength, stock price momentum and valuation. Fundamental analysis is rigorous and company meetings are considered an important part of the investment process. The manager is responsible for the level of gearing; 5% cash to 25% debt as a percentage of net assets is permitted; the level of debt has typically been between c 4% and c 9% over the last five years.
Market outlook: Valuations relatively attractive
Although having significantly outperformed broader UK equities over the last 10 years, smaller-cap UK equities as measured by the Numis Smaller Companies ex- Investment Companies index appear relatively attractively valued across a range of metrics. Investors seeking exposure to the asset class may wish to consider a fund with a high-conviction portfolio and a record of outperformance versus the benchmark over the medium and long term.
Valuation: Discount wider than average
SLS’s current share price discount to cum-income NAV of 7.6%, while lower than the peer group average, is wider than the averages of one, three, five and 10 years, which range from 4.4% to 5.8%. There is scope for the discount to narrow if SLS’s near-term relative performance improves. Its board of directors actively manages the discount via discretionary six-monthly tenders and share repurchases when the discount exceeds 8%. Although focused on capital growth, SLS has delivered annual dividend growth in excess of 20% over the last 10 years; the current dividend yield is 1.8%.
Exhibit 1: Trust at a glance
Investment objective and fund background |
Recent developments |
|||||||||||||||||||||||||||||||||||||||||||||||||||||||||
Standard Life UK Smaller Companies Trust (SLS) aims to achieve long-term capital growth through investment in a diversified portfolio mainly consisting of UK-quoted smaller companies. SLS started life as Edinburgh Smaller Companies in 1993 and Standard Life Investments assumed management from 2003. |
■ 27 October 2016: Director Lynn Ruddick retired at the 2016 AGM. ■ 10 October 2016: 0.4m shares issued from treasury following conversion of £0.9m nominal CULS. ■ 1 September 2016: Annual results for 12 months ending 30 June 2016. NAV TR 4.1% vs benchmark TR -6.6%, share price TR +7.2%. ■ 22 August 2016: Appointment of Caroline Ramsay as independent non-executive director. |
|||||||||||||||||||||||||||||||||||||||||||||||||||||||||
Forthcoming |
Capital structure |
Fund details |
||||||||||||||||||||||||||||||||||||||||||||||||||||||||
AGM |
October 2017 |
Ongoing charges |
1.13% |
Group |
Standard Life Investments |
|||||||||||||||||||||||||||||||||||||||||||||||||||||
Interim results |
February 2017 |
Net gearing |
5.7% |
Manager |
Harry Nimmo |
|||||||||||||||||||||||||||||||||||||||||||||||||||||
Year end |
30 June |
Annual mgmt fee |
0.85% to £250m, then 0.65% |
Address |
1 George Street, Edinburgh, EH2 2LL |
|||||||||||||||||||||||||||||||||||||||||||||||||||||
Dividend paid |
Apr and Oct/Nov |
Performance fee |
None |
|||||||||||||||||||||||||||||||||||||||||||||||||||||||
Launch date |
1993 |
Trust life |
Indefinite |
Phone |
+44 (0)345 600 2268 |
|||||||||||||||||||||||||||||||||||||||||||||||||||||
Continuation vote |
N/A |
Convertible loan stock |
£15.4m nominal |
Website |
||||||||||||||||||||||||||||||||||||||||||||||||||||||
Dividend policy and history (financial years shown) |
Share buyback policy and history (financial years shown) |
|||||||||||||||||||||||||||||||||||||||||||||||||||||||||
While focused on SLS’s long-term capital growth objective, the manager pays close attention to the potential for dividend growth and SLS ordinary dividends have compounded at more than 20% pa over 10 years. |
The board is focused on managing the discount such that the share price discount to cum-income NAV is less than 8%. This is managed via share buybacks and periodic tender offers when required. Allotments since March 2014 relate to exercise of CULS. |
|||||||||||||||||||||||||||||||||||||||||||||||||||||||||
|
|
|||||||||||||||||||||||||||||||||||||||||||||||||||||||||
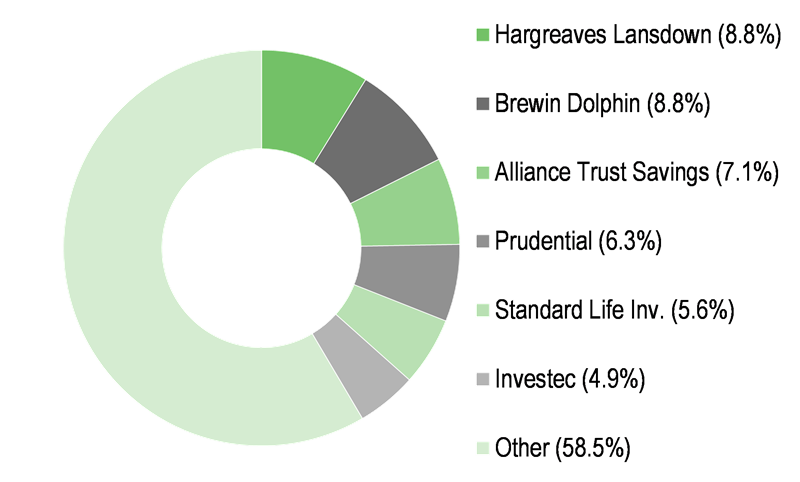
Shareholder base (as at 31 December 2016) |
Sector breakdown of portfolio (as at 30 November 2016) |
|||||||||||||||||||||||||||||||||||||||||||||||||||||||||
|
|
|||||||||||||||||||||||||||||||||||||||||||||||||||||||||
Top 10 holdings (as at 30 November 2016) |
||||||||||||||||||||||||||||||||||||||||||||||||||||||||||
|
||||||||||||||||||||||||||||||||||||||||||||||||||||||||||
Source: Standard Life UK Smaller Companies Trust, Edison Investment Research, Bloomberg, Morningstar. Note: *N/A where not in November 2015 top 10.
Market outlook: Small caps appear relatively attractive
As shown in Exhibit 2 (left-hand side) the small- and mid-cap Numis Smaller Companies ex-ICs (NSCI XIC) index has significantly outperformed the FTSE All-Share and AIM indices over the last 10 years. Although there have been periods of share price weakness, such as during the global financial crisis, the NSCI XIC index has compounded at an average annual rate in excess of 13% over the last five years. Despite its significant outperformance, the NSCI XIC index looks more attractively valued versus other indices on most measures as illustrated in Exhibit 2 (right-hand side). For investors seeking exposure to UK small companies, a fund with a well-defined investment process and a positive medium- and long-term performance track record may be of interest.
|
Exhibit 2: Market performance and valuation metrics |
||||||||||||||||||||||||||||||||||||||||||||||
NSCI XIC index performance vs FTSE AIM and FTSE All-Share indices |
Index valuation metrics based on CY17 estimates as at 5 January 2017 |
|||||||||||||||||||||||||||||||||||||||||||||
|
|
|||||||||||||||||||||||||||||||||||||||||||||
|
Source: Thomson Datastream, Bloomberg, Edison Investment Research. Note: *Excludes loss-making index constituents. |
||||||||||||||||||||||||||||||||||||||||||||||
Fund profile: High-quality UK smaller companies
SLS was launched in 1993 and originally managed by Edinburgh Fund Managers. Standard Life Investments was appointed as manager on 1 September 2003, with lead manager Harry Nimmo aiming to generate long-term capital growth from a diversified portfolio of mainly UK quoted smaller companies. SLS is benchmarked against the Numis Smaller Companies ex-Investment Companies index, although it has broad exposure to UK smaller companies (see Exhibit 3, page 5). The portfolio typically contains c 55 holdings of the manager’s highest conviction investment ideas; his process emphasises quality, growth and momentum. An individual holding will not normally exceed 5% of total assets; companies with a market cap below £50m comprise less than 5% of the portfolio and a 5% limit is placed on ‘blue sky’ companies. Companies listed on AIM comprise almost 40% of total assets. SLS may gear up to 25% of net assets and up to 5% may be held in cash. Although SLS’s focus is on capital growth, it has a record of real income growth; dividends have compounded at an average annual rate of 23.5% over the last 10 years.
The fund manager: Harry Nimmo
The manager’s view: Positive outlook for dividends
The manager highlights what he considers to be six rules for making money in smaller companies: look for sustainable dividend growth (a measure of resilience); concentrate your efforts (the potential investible universe is large); invest in quality (companies with sustainable growth that are financially strong); let winning positions run (allows growth to compound, stock price targets are not used); focus on management longevity (a positive indicator); and valuation is a secondary consideration (low P/E multiples are not necessarily a good predictor of long-term share price performance).
Nimmo comments that in 2016, stock markets were strongly driven by top-down investors trying to second guess the outcome of significant events such as the UK’s European referendum and the US presidential election. This made it a difficult environment for fundamental investors. He says that ultimately, share prices reflect growth in earnings and dividends and that higher-quality companies will perform better than lower-quality companies in uncertain times and expects it will take time before the effects of major events such as the Brexit vote are fully reflected in share prices. He suggests that if there is an economic setback, SLS’s portfolio companies can continue to grow in absolute terms.
Commenting on the dividends of portfolio companies, Nimmo says that special dividends are the unknown, in FY16 (to end-June 2016) the number of special dividends paid was down by around two-thirds, but SLS was still able to increase its own dividend by c 14%. He is reasonably confident that portfolio companies in aggregate will continue to grow their dividends. He highlights Cranswick, a pork producer, which is benefiting from deep relationships with the supermarkets and the move towards higher-quality products, increased its dividend by an average of 7% pa over the last five years. It recently announced a c 13% increase in its interim dividend, and its final dividend tends to be higher than the interim, which is a positive signal. He also notes there was a lack of dividend cuts by portfolio companies during the global financial crisis and that, unlike for some mega-cap companies, dividends are not under threat due to large payouts and low dividend coverage.
Nimmo states there was quite a lot of M&A activity in UK small caps in 2016 such as Steinhoff’s acquisition of retailer Poundland, which is an example of a foreign buyer being attracted to UK assets following the weakness of sterling. Over time, SLS has seen some of its holdings acquired, but this was less prevalent in 2016 as most acquisitions were at the value end of the market and SLS generally holds high-quality companies. The manager says he owns some quality cyclical companies that are trading on reasonable valuations such as Marshalls, which supplies landscaping products or flooring specialist Headlam, which could be considered potential acquisition targets.
Asset allocation
Investment process: Comprised of three stages
There are three stages to SLS’s investment process: top-level qualitative guidelines; a stock selection matrix; and fundamental analysis. The process is unchanged since the inception of the Standard Life Investments UK Smaller Companies OEIC in January 1997 (run by the same team).
At the top level, the manager seeks to buy the larger companies of tomorrow; these are companies with growth potential, proven business models, recurring revenues and ideally already generating profits. There is a potential investment universe of c 800 companies – these are sifted using Standard Life’s proprietary stock selection matrix. The matrix has a range of factors including: earnings and EBITDA revision momentum; StarMine estimates (an indication of estimate stability and dispersion); stock price momentum; Altman Z-scores1 (a formula for predicting bankruptcy), P/E multiples and dividend yield; and the level of director dealing. The matrix is also used to evaluate existing holdings to determine whether their scores have changed. Matrix scores range from -35 to +35, with a score of -10 to -35 indicating a sell, and a score of +10 to +35 indicating a buy. Potential investments scoring highly on the matrix then undergo fundamental analysis to test for false positives; considerations include analysis of a company’s market share, barriers to entry and pricing power.
The original Altman Z-score is a weighted combination of five ratios: working capital/total assets; retained earnings/total assets; earnings before interest and tax/total assets; market value of equity/total liabilities; and sales/total assets. A score below 1.8 is seen as a warning sign, while 3.0 and above is a positive indicator.
Current portfolio positioning
At end-November 2016, the top 10 holdings comprised 32.2% of the portfolio, similar to 31.1% at end-November 2015. Only three positions were common to both periods, mainly due to performance variations as portfolio turnover is relatively low, typically 25% pa. 80% of assets are in companies with a market cap below £1.4bn, however, the manager says it is useful to hold some larger companies that can provide liquidity if required.
Exhibit 3: Portfolio exposure by market cap (ex-cash, % unless stated)
Portfolio end-November 2016 |
Portfolio end-November 2015 |
Change (pp) |
|
FTSE 250* |
17.8 |
11.3 |
6.5 |
Numis Smaller Companies |
44.4 |
55.4 |
-11.0 |
AIM |
36.4 |
29.4 |
7.0 |
Non-index |
1.4 |
3.9 |
-2.5 |
100.0 |
100.0 |
Source: Standard Life UK Smaller Companies Trust, Edison Investment Research. Note: *FTSE 250 is mid-cap holdings that are above the threshold for Numis Smaller Companies index.
Exhibit 4 shows SLS’s exposure by sector. Over the last 12 months the largest increases in exposure were industrials and consumer goods, while the largest decreases were consumer services and financials. SLS has zero exposure to the oil & gas and basic materials sectors as these companies currently do not pass the rigorous stock selection process.
Exhibit 4: Portfolio sector exposure vs benchmark (% unless stated)
Portfolio end-November 2016 |
Portfolio end-November 2015 |
Change (pp) |
|
Consumer services |
24.1 |
29.4 |
-5.4 |
Industrials |
21.7 |
17.2 |
4.5 |
Technology |
14.9 |
15.5 |
-0.6 |
Consumer goods |
14.8 |
10.5 |
4.3 |
Financials |
9.4 |
12.7 |
-3.3 |
Healthcare |
9.3 |
6.7 |
2.7 |
Telecommunications |
5.7 |
5.5 |
0.2 |
Basic materials |
0.0 |
2.4 |
-2.4 |
100.0 |
100.0 |
Source: Standard Life UK Smaller Companies Trust, Edison Investment Research. Note: Adjusted for gearing.
Within financials, top 10 position Sanne has performed well. It is a fund administrator and has recently announced the acquisition of a Mauritius-based equivalent, IFS Group, which is a significant bolt-on purchase. Investors reacted positively to a placing to fund the deal as the acquisition is expected to be earnings enhancing (SLS participated in the placing); the larger market cap means Sanne is in line for inclusion in the FTSE 250 index.
Most of SLS’s recent purchases have been more internationally focused, such as meat packing company Hilton Food Group and specialised technical products and services company Diploma, a consolidator of businesses that are growing faster than gross domestic product and the acquisitions are accretive to Diploma’s earnings. A recent portfolio addition is industrial company Ricardo; the manager suggests that its current portfolio of businesses is stronger than in the past. Historically, earnings were unpredictable due to Ricardo’s cyclical and automotive exposure. There is now a greater focus on fuel efficiency and emission control, electric engines and autonomous vehicles and the customer base has diversified significantly in recent years. Nimmo says that Ricardo is an interesting addition to the portfolio and has a strong matrix score, and he has added to the position.
Victrex, one of SLS’s very long-standing portfolio positions has recently been sold. The company manufactures an advanced polymer called PEEK, which is extruded into a range of strong and lightweight products used in a variety of industries such as aerospace and transportation. Victrex has a poor matrix score and the company is suffering from a tougher competitive environment, which is causing price disruption in what has historically been a very high-margin business.
Performance: Medium- and long-term record intact
Exhibit 5 (right-hand side) shows SLS’s and the benchmark’s absolute total returns over both short- and long-term periods. Returns have been particularly strong over the last six months as UK small-cap share prices have rallied strongly following the post-Brexit sell-off, although SLS has modestly lagged the benchmark over this period.
|
Exhibit 5: Investment trust performance to 31 December 2016 |
|
Price, NAV and benchmark total return performance, one-year rebased |
Price, NAV and benchmark total return performance (%) |
|
|
|
Source: Thomson Datastream, Edison Investment Research. Note: Three, five and 10-year performance figures annualised. |
|
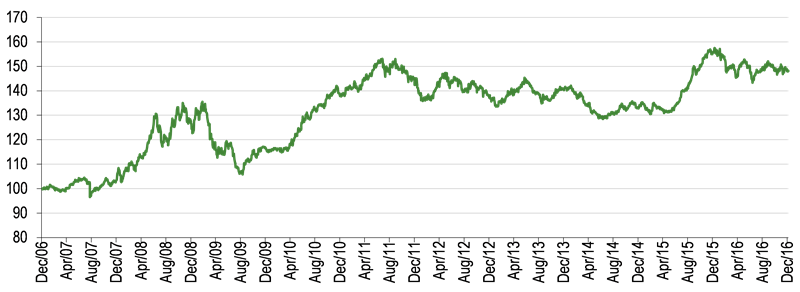
Relative returns are shown in Exhibit 6; SLS has lagged the benchmark over the last year as stock markets have been driven more by macro events rather than company fundamentals and SLS is significantly underweight resource stocks, which rallied strongly in H116. However, its NAV total return remains ahead of the benchmark over three, five and 10 years. The manager focuses on companies’ predictability and growth and has been utilising the same investment process over four discrete economic/business cycles; he is confident that over the long term, the process will generate good returns for shareholders. 2015 was a particularly strong year for SLS’s relative performance as a lot of portfolio companies issued positive trading statements and there was a lack of exposure to the poorly performing oil & gas and basic material sectors.
|
Exhibit 6: Share price and NAV total return performance, relative to indices (%) |
||||||||
|
One month |
Three months |
Six months |
One year |
Three years |
Five years |
10 years |
|
Price relative to Numis Smaller Cos ex-ICs |
(1.6) |
(4.5) |
(1.0) |
(13.1) |
(4.6) |
0.5 |
63.9 |
|
NAV relative to Numis Smaller Cos ex-ICs |
(1.7) |
(2.2) |
(0.9) |
(5.0) |
5.4 |
3.8 |
47.9 |
|
Price relative to FTSE AIM |
0.1 |
(3.4) |
(3.2) |
(16.9) |
11.3 |
67.2 |
298.7 |
|
NAV relative to FTSE AIM |
0.0 |
(1.1) |
(3.0) |
(9.1) |
23.1 |
72.8 |
259.6 |
|
Price relative to FTSE All-Share |
(1.6) |
(3.8) |
4.0 |
(17.4) |
(3.6) |
33.2 |
108.4 |
|
NAV relative to FTSE All-Share |
(1.6) |
(1.5) |
4.2 |
(9.6) |
6.6 |
37.6 |
88.0 |
|
|
Source: Thomson Datastream, Edison Investment Research. Note: Data to end-December 2016. Geometric calculation. |
||||||||
|
Exhibit 7: NAV total return performance relative to benchmark over 10 years |
||||||||
|
||||||||
|
Source: Thomson Datastream, Edison Investment Research |
||||||||
Discount: Wider than historical averages
SLS’s current 7.6% share price discount to cum-income NAV is wider than the historical averages of the last one, three, five and 10 years (range of 4.4% to 5.8%). There is scope for the discount to narrow, if near-term relative investment performance improves. The board actively manages the discount via discretionary six-monthly tenders. It also repurchases shares when the discount is wider than 8% in normal market conditions.
|
Exhibit 8: Share price premium/discount to NAV (including income) over three years (%) |
|
|
Source: Thomson Datastream, Edison Investment Research |
Capital structure and fees
SLS has 67.4m ordinary shares in issue. It currently has £15.4m nominal 3.5% convertible unsecured loan stock (CULS) outstanding. The CULS can be converted into ordinary shares on 30 September and 31 March each year to March 2018 at a price of 237.2542p, so are comfortably in the money. However, most investors are unlikely to convert in the near term given the CULS’s higher yield; the board is exploring debt options for 2018 when the CULS expires.
The board has delegated decisions on the level of net gearing to the manager, achieved through varying the cash position, with a range of a maximum 5% in cash to 25% debt (at the time of drawdown). Over the last five year ends, gearing has ranged from a net cash position of 4.6% to net gearing of 8.8%. At end-November 2016, net gearing was 5.7%.
Introduced in December 2015, SLS now has a tiered management fee structure of 0.85% of gross assets up to £250m and 0.65% above £250m. The performance fee was removed in 2012. In FY16, the ongoing charge was 1.13%, a 6bp reduction versus the prior year.
Dividend policy and record
Although SLS’s investment objective is to generate long-term capital growth, one of the manager’s six rules for investing in UK small-cap companies is to seek companies that can generate sustainable dividend growth. Dividends are paid twice a year in April and October or November – over the last 10 years, annual dividends have compounded at 23.5%. In FY16, the 6.6p annual dividend was a c 14% increase versus the prior year. SLS’s current dividend yield is 1.8%.
Peer group comparison
Exhibit 9 shows a comparison of SLS with AIC UK smaller companies sector trusts larger than £100m. Over 10 years its NAV total return is the highest by a significant margin. Over shorter periods, SLS’s NAV total return is modestly ahead of the peer group weighted average over three years, but lagged over one and five years. In terms of risk adjusted returns, as measured by the Sharpe ratio, SLS is broadly in line with the weighted average over both one and three years. Its discount is the second narrowest in the group and its ongoing charge is above average, although no performance fee is payable, unlike the majority of peers. SLS’s net gearing and dividend yield are lower than the peer group averages.
Exhibit 9: Selected peer group comparison as at 4 January 2016
% unless stated |
Market cap £m |
NAV TR 1 Year |
NAV TR 3 Year |
NAV TR 5 Year |
NAV TR 10 Year |
Sharpe 1y (NAV) |
Sharpe 3y (NAV) |
Discount (ex-par) |
Ongoing charge |
Perf. fee |
Net gearing |
Dividend yield (%) |
Standard Life UK Smaller Co |
247.9 |
6.9 |
25.6 |
116.5 |
223.5 |
(0.5) |
(0.1) |
(6.6) |
1.1 |
No |
103 |
1.8 |
Aberforth Smaller Companies |
1,044.1 |
6.8 |
14.7 |
134.6 |
97.7 |
(0.5) |
(0.3) |
(13.3) |
0.8 |
Yes |
103 |
2.4 |
BlackRock Smaller Companies |
461.1 |
12.1 |
29.2 |
133.5 |
204.6 |
(0.3) |
(0.1) |
(16.2) |
0.7 |
Yes |
109 |
1.8 |
BlackRockThrogmorton |
257.8 |
11.3 |
29.8 |
126.8 |
145.1 |
(0.3) |
(0.1) |
(16.9) |
1.1 |
Yes |
125 |
1.9 |
Dunedin Smaller Companies |
101.9 |
10.2 |
15.2 |
109.9 |
105.7 |
(0.4) |
(0.3) |
(15.8) |
0.8 |
Yes |
99 |
2.9 |
Henderson Smaller Companies |
496.8 |
10.9 |
28.6 |
151.6 |
158.3 |
(0.3) |
(0.0) |
(14.6) |
0.4 |
Yes |
107 |
2.3 |
Invesco Perpetual UK Smaller |
224.5 |
14.2 |
37.0 |
132.5 |
152.2 |
(0.2) |
0.1 |
(5.7) |
0.8 |
Yes |
100 |
3.4 |
JPMorgan Smaller Companies |
138.7 |
(0.1) |
10.9 |
107.2 |
86.2 |
(0.8) |
(0.4) |
(17.4) |
1.2 |
No |
110 |
2.2 |
Montanaro UK Smaller Companies |
150.0 |
0.2 |
6.3 |
62.8 |
96.1 |
(0.6) |
(0.4) |
(22.9) |
1.2 |
No |
104 |
2.2 |
Rights & Issues |
159.6 |
32.9 |
59.4 |
208.6 |
205.9 |
0.6 |
0.5 |
(9.9) |
0.5 |
No |
100 |
2.0 |
Strategic Equity Capital |
145.2 |
8.2 |
42.4 |
152.5 |
122.4 |
(0.6) |
0.1 |
(8.7) |
1.4 |
Yes |
100 |
0.4 |
Weighted average |
9.7 |
24.8 |
134.1 |
142.9 |
(0.4) |
(0.1) |
(13.5) |
0.8 |
106 |
2.2 |
||
Rank (out of 11 funds) |
5 |
8 |
7 |
8 |
1 |
7 |
7 |
2 |
4 |
6 |
10 |
Source: Morningstar, Edison Investment Research. Note: TR=total return. Sharpe ratio is a measure of risk-adjusted return. The ratios shown are calculated by Morningstar for the past 12- and 36-month periods by dividing a fund’s annualised excess returns over the risk-free rate by its annualised standard deviation. Net gearing is total assets less cash and equivalents as a percentage of net assets.
The board
There are four directors on the board at SLS; all are non-executive and independent of the manager. Chairman, David Woods was elected as a director in May 2005 and took up his current position in February 2014. Senior independent director, Carol Ferguson was elected in February 2009 and Allister Langlands was appointed in July 2014. The newest member of the board is Caroline Ramsay; she was appointed on 22 August 2016, following the retirement of Lynn Ruddick, who stepped down at the October 2016 AGM after seven years’ service.
|
|
Investment Companies