Jupiter US Smaller Companies (JUS) invests in small and mid-cap US companies with the aim of achieving long-term capital growth with capital preservation. Robert Siddles, the manager since the trust’s launch in 1993, seeks to invest in companies with strong franchises, equity-owning managements, high free cash flow and pricing power, which have experienced a period of share price weakness and offer at least 50% upside to their assessed fair value. This conservative approach means that the portfolio can underperform in periods when either high-risk stocks such as biotechnology lead, as happened in 2015, or when the market rises rapidly, as occurred last year.
Written by
Jupiter US Smaller Companies |
Small-cap growth with a margin of safety |
Investment trusts |
23 March 2017 |
Share price/discount performance
Three-year performance vs index
Gearing
Analysts
|
|||||||||||||||||||||||||||||||||||||||||||||||||||||||||||||||||||||||||
Jupiter US Smaller Companies (JUS) invests in small and mid-cap US companies with the aim of achieving long-term capital growth with capital preservation. Robert Siddles, the manager since the trust’s launch in 1993, seeks to invest in companies with strong franchises, equity-owning managements, high free cash flow and pricing power, which have experienced a period of share price weakness and offer at least 50% upside to their assessed fair value. This conservative approach means that the portfolio can underperform in periods when either high-risk stocks such as biotechnology lead, as happened in 2015, or when the market rises rapidly, as occurred last year.
12 months ending |
Share price |
NAV |
US small-cap equities (%) |
FTSE All-Share (%) |
S&P 500 |
28/02/13 |
31.1 |
27.5 |
18.2 |
14.1 |
19.4 |
28/02/14 |
(1.0) |
10.3 |
17.6 |
13.3 |
13.6 |
28/02/15 |
7.6 |
12.0 |
13.1 |
5.6 |
25.3 |
29/02/16 |
(12.2) |
(6.4) |
(7.0) |
(7.3) |
4.0 |
28/02/17 |
49.8 |
40.1 |
50.2 |
22.8 |
40.0 |
Source: Thomson Datastream. Note: All % on a total return basis in GBP.
Investment strategy: Risk-aware, bottom-up approach
Siddles takes a bottom-up approach to investing, travelling often to the US to meet companies on their own ground. His investment approach is risk-aware and value-focused. Companies identified by an initial quantitative screen must pass a five-part ‘good company test’, blending qualitative assessments with a margin of safety in valuations, in order to be considered for investment. The manager divides portfolio companies into those that he expects to grow and compound returns over the long term, and shorter-term (two- to three-year) turnaround and recovery situations.
Market outlook: Look for value amid high valuations
Stock markets on both sides of the Atlantic have reached new highs recently, buoyed in the US by the potential for business-friendly policies under the new administration, and a return to more normal monetary conditions after a decade of extraordinary Fed policy. President Trump’s ‘America first’ agenda may favour smaller companies, which tend to be more domestically focused. However, with equities looking expensive in aggregate (forward P/Es for large-cap and small-cap US equities are respectively 17% and 10% above five-year averages), value-focused investment strategies may have scope to outperform.
Valuation: Scope for discount to narrow further
At 21 March 2017, JUS’s shares traded at a 9.9% discount to net asset value. This was a little narrower than the 12-month average of 10.7% and a little wider than the 9.3% average over three years, although the five-year average discount is narrower at 4.8%. The board uses share buybacks with the aim of keeping the discount below 10% over the longer term. The discount has narrowed since a year ago when US equities were out of favour, and there is scope for it to narrow further from its current level if the style rotation from growth to value continues.
Exhibit 1: Trust at a glance
Investment objective and fund background |
Recent developments |
||||||||||||||||||||||||||||||||||||||||||||||||||||||||||||||||||||||
Jupiter US Smaller Companies’ objective is to achieve long-term capital growth by investing in a diversified portfolio of quoted US smaller and medium-sized companies. It uses a 2,000-stock US small and mid-cap index (capital returns, sterling adjusted) as a performance benchmark. |
■ 6 March 2017: Half-year report for the six months ended 31 December 2016. NAV total return +22.2% and share price total return +30.1% compared with +27.5% for the benchmark (all in sterling terms). ■ 15 November 2016: All resolutions passed at AGM. |
||||||||||||||||||||||||||||||||||||||||||||||||||||||||||||||||||||||
Forthcoming |
Capital structure |
Fund details |
|||||||||||||||||||||||||||||||||||||||||||||||||||||||||||||||||||||
AGM |
November 2017 |
Ongoing charges |
1.03% |
Group |
Jupiter Unit Trust Managers |
||||||||||||||||||||||||||||||||||||||||||||||||||||||||||||||||||
Annual results |
September 2017 |
Gearing |
Nil |
Manager |
Robert Siddles |
||||||||||||||||||||||||||||||||||||||||||||||||||||||||||||||||||
Year end |
30 June |
Annual mgmt fee |
0.80% |
Address |
The Zig Zag Building, 70 Victoria St, London, SW1E 6SQ |
||||||||||||||||||||||||||||||||||||||||||||||||||||||||||||||||||
Dividend paid |
N/A |
Performance fee |
Yes, see page 7 |
||||||||||||||||||||||||||||||||||||||||||||||||||||||||||||||||||||
Launch date |
10 March 1993 |
Trust life |
Indefinite |
Phone |
020 3817 1000 |
||||||||||||||||||||||||||||||||||||||||||||||||||||||||||||||||||
Continuation vote |
Three-yearly, next 2017 |
Loan facilities |
None |
Website |
|||||||||||||||||||||||||||||||||||||||||||||||||||||||||||||||||||
Portfolio exposure by sector (as at 28 February 2017) |
Share buyback policy and history (calendar years) |
||||||||||||||||||||||||||||||||||||||||||||||||||||||||||||||||||||||
JUS has the authority to allot up to 10% and buy back up to 14.99% of shares to manage a premium or a discount. Buybacks are employed with the aim of maintaining the discount at a maximum of c 10%. |
|||||||||||||||||||||||||||||||||||||||||||||||||||||||||||||||||||||||
|
|
||||||||||||||||||||||||||||||||||||||||||||||||||||||||||||||||||||||
Shareholder base (as at 24 January 2017) |
Portfolio exposure by theme (as at 31 December 2016) |
||||||||||||||||||||||||||||||||||||||||||||||||||||||||||||||||||||||
|
|
||||||||||||||||||||||||||||||||||||||||||||||||||||||||||||||||||||||
Top 10 holdings (as at 28 February 2017) |
|||||||||||||||||||||||||||||||||||||||||||||||||||||||||||||||||||||||
|
|||||||||||||||||||||||||||||||||||||||||||||||||||||||||||||||||||||||
Source: Jupiter US Smaller Companies, Edison Investment Research, Bloomberg, Morningstar. Note: *N/A where not in February 2016 top 10. **Formerly known as Healthways.
Market outlook: Proceed with caution
US equity markets have powered ahead in recent months, buoyed by the expectation of business-friendly policies from the new Trump administration and the return to more normal monetary conditions as signalled by two Federal Reserve rate rises since December 2016. Measured from the dip immediately before the presidential election in November, the main US large-cap and small-cap indices were up 12.4% and 15.7% respectively in US dollar terms at 21 March 2017, although after an early boost for small-caps, large-caps have led since early December. As shown in Exhibit 2 below (left-hand chart), the effect has been magnified for sterling-based investors given the weakness of the currency since the UK’s vote to leave the European Union.
Meanwhile, forward P/E valuations are elevated compared with medium-term averages (right-hand chart). In such an environment, an investment strategy that focuses on finding good-quality, undervalued companies with appreciable share price upside may find favour with investors.
|
Exhibit 2: Market performance and valuation |
|||||||||||||||||||||||||||||||
Sterling performance of US and UK equities, 10 years to 14 March |
12m forward P/E ratios (Datastream indices) |
||||||||||||||||||||||||||||||
|
|
||||||||||||||||||||||||||||||
|
Source: Thomson Datastream, Edison Investment Research, Bloomberg |
|||||||||||||||||||||||||||||||
Fund profile: Growth with focus on capital preservation
Jupiter US Smaller Companies (JUS) was launched in 1993 as the F&C US Smaller Companies Trust. In 2014 its manager since launch, Robert Siddles, moved from F&C Asset Management to Jupiter Asset Management, and JUS’s board took the decision to follow him. The trust took on its current name in April 2014. JUS seeks to achieve long-term capital growth by investing in a fairly concentrated portfolio of US small- and mid-cap companies, with an emphasis on those in the $100m-5bn market cap range. Siddles takes a risk-averse, value-orientated approach to investing, and aims to blend companies that can grow and compound returns over the long term with recovery and turnaround situations held over a shorter (two- to three-year) time horizon. Because of its focus on growth, JUS does not pay dividends; it has also historically not used gearing, which the board and manager deem an unnecessary risk given the volatility of smaller companies as an asset class.
The fund manager: Robert Siddles
The manager’s view: Business always trumps politics in the US
Manager Robert Siddles argues that the current focus on US politics is overdone, with business historically having played a more important role in the direction of the country. He concedes that the political cycle does have an effect on the US stock market, with equities tending to do well for the first year or two after an election; however, given the economy is eight years into a period of expansion, there is a possibility that a slowdown may occur sooner rather than later. (Getting a recession out of the way early in a term also boosts politicians’ chances of re-election, he adds.)
Siddles says the focus should not be so much on President Trump himself, but on the wave of popular disaffection that led to his election victory. The ‘American dream’ of prosperity and home-ownership is under threat against a backdrop of higher house prices caused by a flood of money from quantitative easing, and China’s entry to the World Trade Organisation putting downward pressure on wages. Regardless of the shape of the new administration’s plans to repeal and replace the Affordable Care Act (‘Obamacare’), higher healthcare costs, larger excesses and increasing ‘co-pays’ on health insurance have also detrimentally affected disposable incomes.
Because of these pressures, Siddles has tilted the JUS portfolio towards companies that save hard-pressed consumers money, such as discount store Ollie’s Bargain Outlets, and defensive, reliable growth areas such as funeral homes, where a rise in the sheer number of elderly people is beginning to outweigh the headwind of increasing longevity. A recent purchase in this area is Service Corp, which Siddles views as a ‘Buffett compounder’, purchased at an attractive price after a mild winter led to a temporarily falling mortality rate. In the recovery area, Siddles has bought out-of-favour IT service companies such as Synchronoss Technologies and app developer Virtusa.
While he concedes that it is not currently as easy to find value as it is in a recession, Siddles points out that with more than 2,500 stocks to choose from, “there will always be something interesting”.
Asset allocation
Investment process: Risk-aware focus on value opportunities
JUS manager Robert Siddles follows a disciplined, value-orientated approach to constructing a portfolio of 50-60 US small and mid-cap stocks (broadly those with a market capitalisation between $100m and $5bn), aimed at achieving long-term capital growth while limiting downside risk. The portfolio is built on a bottom-up basis, with the manager travelling frequently to the US to meet companies on their own ground. Siddles also runs the open-ended Jupiter US Small and Midcap Companies fund using the same strategy.
The investment process is split into three stages, beginning with a quantitative screen to identify companies in the universe that have experienced either short- or long-term price weakness. These stocks are then subject to a rigorous qualitative risk assessment, looking at style, industry and company-specific factors, with the aim of avoiding value traps. From a style perspective, the manager tends to avoid most technology stocks, biotech, fashion and restaurants, while he favours non-life insurers, staple goods and services, transport/distribution and custodians of capital. Industry cycles are assessed, with analysis of past bubbles, industry problems, global capital flows, commodity cycles and regional population trends feeding into ideas for research. The central part of the risk assessment is the ‘good company test’, in reality five tests, all of which a company must pass in order to be considered for inclusion in the portfolio:
■
A winning franchise: companies should be ‘natural winners’ that can gain market share and counter competitive risks.
■
Free cash flow: preferably used to enhance value for existing shareholders.
■
Inside ownership: high management equity ownership aligns interests with shareholders.
■
Balance of power: companies should retain pricing power rather than being vulnerable to over-powerful customer bases.
■
Low share valuation risk: at least 50% upside from the share price at the time of investment.
Siddles notes that the low business risk embodied by the first four tests and the low share price risk assessed by the fifth means the ‘good company test’ is both a very challenging hurdle and a good indicator of a ‘margin of safety’ in investments. Few companies meet all the requirements, which means the manager builds full financial models (the third stage of the process) on a relatively small number of stocks each year; this also fits with the relatively low-turnover approach of the strategy.
Candidates for inclusion are grouped into two broad types: ‘Buffett compounders’ and ‘Graham recovery stocks’. (See our initiation note for a fuller explanation of these labels.) Compounders are broadly those with valuable assets or earnings and are likely to be held for the very long term, while recovery stocks may be cyclical or ‘special situation’-type corporate turnarounds; these are likely to have a shorter holding period.
Stocks may be sold because of a change in industry cycles, a failure to deliver growth on a two- to three-year view, if the investment thesis no longer applies (for example in the case of a recovery stock that has reached its target price), or if a company makes a big, non-core acquisition that changes the nature of the business. Holdings may also be trimmed if they exceed 5% of the portfolio or industry exposure exceeds 15%, if they have moved up sharply over a short period or if they become too large in terms of market capitalisation.
Current portfolio positioning
There were 58 stocks in the JUS portfolio at 28 February, an increase from 50 at the year-end on 30 June. While this is broadly in line with the average number of holdings for closed-ended peers, it illustrates a highly selective approach relative to the 2,500+ stocks in the US small- and mid-cap universe. The majority of positions are between 1% and 2% of the portfolio, and the top 10 holdings made up 21.7% of assets at 28 February 2017.
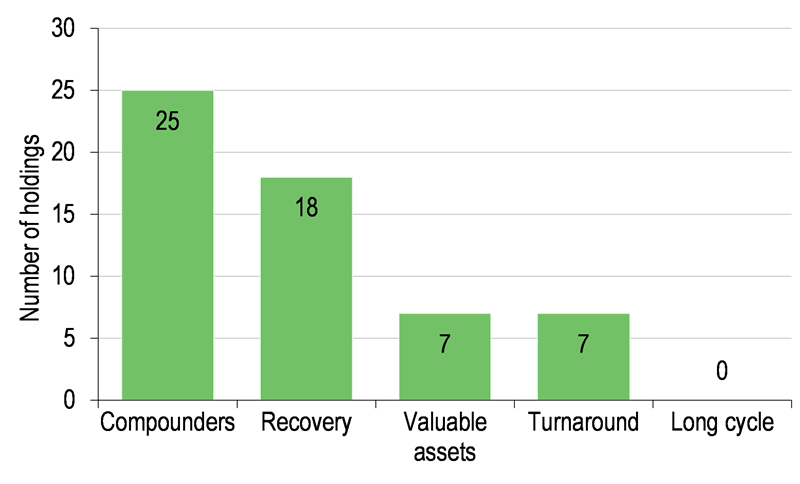
Numerically, the JUS portfolio is currently tilted in favour of ‘Buffett’ rather than ‘Graham’ stocks, with 32 holdings (at 31 December) classified as having compounding potential from valuable assets or earnings, and 25 recovery or corporate turnaround situations (see Portfolio exposure by theme chart, Exhibit 1). In terms of sector exposures (Exhibit 3), the biggest change over the past 12 months has been a more than doubling in the consumer discretionary stock weighting. As US residents struggle against a backdrop of higher house prices and rising healthcare costs, Siddles has been buying companies focused on saving consumers money, such as branded goods discounter Ollie’s Bargain Outlet and gas station/convenience store operator Murphy USA.
The biggest reduction in exposure was to producer durables, largely as a result of the sale of Roper Technologies, formerly one of the largest positions in the portfolio, which Siddles had owned since 2001. The financial services weighting has fallen slightly as a result of profit-taking after strong performance following the US election; Towne Bank (acquired as a result of its takeover of portfolio holding Monarch Financial) was sold, and Cardinal Financial exited the portfolio following an agreed bid from United Bankshares. Siddles sold almost all the energy stocks in the portfolio in July 2016, as they had recovered strongly and he was unconvinced that the oil price would continue to rise.
Exhibit 3: Portfolio sector exposure (% unless stated)
Portfolio end-February 2017 |
Portfolio end-February 2016 |
Change (pp) |
|
Consumer discretionary |
20.6 |
10.0 |
10.6 |
Financial services |
19.5 |
21.2 |
(1.7) |
Producer durables |
14.9 |
20.0 |
(5.1) |
Healthcare |
16.8 |
15.2 |
1.6 |
Technology |
12.1 |
8.6 |
3.5 |
Consumer staples |
6.5 |
8.2 |
(1.7) |
Materials & processing |
2.8 |
4.0 |
(1.2) |
Utilities |
2.1 |
5.0 |
(2.9) |
Energy |
1.9 |
4.5 |
(2.6) |
Cash |
2.8 |
3.4 |
(0.6) |
100.0 |
100.0 |
Source: Jupiter US Smaller Companies, Edison Investment Research
Performance: Positive returns over all periods
|
Exhibit 4: Investment trust performance to 28 February 2017 |
||||||||
Price, NAV and benchmark capital return performance, one-year rebased |
Price, NAV and benchmark capital return performance (%) |
|||||||
|
|
|||||||
|
Source: Thomson Datastream, Edison Investment Research. Note: Three-, five- and 10-year performance figures annualised. |
||||||||
|
Exhibit 5: Share price and NAV capital return performance, relative to indices (%) |
||||||||
|
One month |
Three months |
Six months |
One year |
Three years |
Five years |
10 years |
|
Price relative to US small-cap equities |
(1.8) |
1.8 |
(0.6) |
(0.2) |
(10.3) |
(16.3) |
10.9 |
|
NAV relative to US small-cap equities |
(1.6) |
(1.4) |
(2.8) |
(6.8) |
(7.0) |
(5.9) |
8.0 |
|
Price relative to FTSE All-Share |
(1.9) |
(0.6) |
7.7 |
22.0 |
17.8 |
18.4 |
72.3 |
|
NAV relative to FTSE All-Share |
(1.8) |
(3.8) |
5.4 |
14.1 |
22.2 |
33.0 |
67.7 |
|
Price relative to S&P 500 |
(3.8) |
(1.1) |
1.0 |
7.1 |
(22.4) |
(25.7) |
(6.9) |
|
NAV relative to S&P 500 |
(3.7) |
(4.3) |
(1.2) |
0.1 |
(19.5) |
(16.5) |
(9.4) |
|
|
Source: Thomson Datastream, Edison Investment Research. Note: Data to end-February 2017. Geometric calculation. |
||||||||
JUS’s manager notes that the portfolio is run conservatively with an emphasis on capital preservation. In this regard it has a long track record of success, as shown in Exhibit 4 (right-hand chart), with positive NAV and share price returns over all periods shown. Performance has tended to lag returns from both large and small-cap US equities (Exhibit 5) although, as shown in Exhibit 6, JUS’s investment approach has protected returns in falling markets such as 2008/09 and 2011, and the trust has outperformed the benchmark over 10 years. Absolute performance in the 12 months to end-February has been particularly strong, with the NAV up c 40% and the share price up c 50% as the discount has narrowed. While sterling weakness since the UK’s EU referendum and a bounce in domestically focused US small-caps since the presidential election have undoubtedly played a part, strong performance has also come from financial services companies (c 20% of the portfolio) and technology (c 12%), as well as on a stock-specific basis from holdings such as Tivity Health – Siddles took profits in the health and wellbeing firm (formerly Healthways) in H117, but it is back in the top 10 holdings having posted a c 20% share price increase (in US$ terms) since 1 January.
|
Exhibit 6: NAV total return performance relative to US small-cap equities over 10 years |
|
|
Source: Thomson Datastream, Edison Investment Research |
Discount: Narrowing, but still above long-term average
At 21 March 2017, JUS’s shares traded at a 9.9% discount to NAV. This was broadly in line with the one- and three-year averages of 10.7% and 9.3% respectively, but wider than the five-year average of 4.8%. The board has tended to buy back shares to manage the discount when it has exceeded 10%. The wider discount since mid-2015 may reflect a lack of investor appetite for more value-focused investment strategies, which has arguably begun to reverse.
|
Exhibit 7: Share price premium/discount to NAV over three years (%) |
|
|
Source: Thomson Datastream, Edison Investment Research |
Capital structure and fees
A conventional investment trust with one class of share, JUS had 20.7m ordinary shares in issue at 21 March 2017. To manage a discount or a premium, the board has the authority to buy back or issue shares. Over the past 12 months, 3.0m shares have been repurchased at a cost of £21.1m. JUS does not employ gearing, as the board and manager believe it would be inappropriate to magnify the risk of investing in US smaller companies through the use of leverage.
As JUS’s Alternative Investment Fund Manager (AIFM) under the AIFM Directive, Jupiter Unit Trust Managers (JUTM) is paid a management fee of 0.8% of net assets per year, calculated as 0.2% quarterly. A performance fee of 5% of outperformance may be paid if NAV performance in a financial year is more than 2% above the sterling-adjusted performance of the benchmark. If the NAV per share underperforms the benchmark by 2% or more, the underperformance will be carried forward and no performance fee will be payable until the NAV has both recovered the accumulated underperformance and exceeded the target performance for the year. The maximum performance-related fee which may be payable in respect of any year is 0.7% of gross assets.
Dividend policy and record
JUS has never paid a dividend, reflecting its focus on capital growth and the fact that US smaller companies are not a high-yielding asset class. In the six months to 31 December, portfolio income was £903,000. However, this was more than offset by management fees and other expenses charged to the revenue account.
Peer group comparison
The AIC North America Smaller Companies sector, of which JUS is a member, is a small peer group with one direct geographical comparator and another that invests in UK as well as US smaller companies. For this reason, in Exhibit 8 we have also included sterling share classes of open-ended US smaller companies funds, among them JUS’s sister unit trust. Within the AIC peer group, JUS’s NAV performance is ahead of the weighted average over one and 10 years and behind over three and five years. Returns lag the open-ended peer averages over all periods shown. Charges are below average, although unlike its closest peer, JUS may charge a performance fee. The discount and gearing are both below average. Across both open- and closed-ended peer groups, only one fund yields more than zero.
Exhibit 8: Selected peer group as at 21 March 2017
% unless stated |
Market cap/AUM £m |
NAV TR |
NAV TR |
NAV TR |
NAV TR |
Ongoing charge |
Perf. |
Discount (ex-par) |
Net |
Dividend yield (%) |
Jupiter US Smaller Companies |
168.7 |
28.9 |
35.6 |
92.5 |
185.5 |
1.0 |
Yes |
(9.7) |
100 |
0.0 |
JPMorgan US Smaller Companies |
154.9 |
44.5 |
71.5 |
148.3 |
205.5 |
1.7 |
No |
(0.9) |
107 |
0.0 |
North Atlantic Smaller Cos |
358.1 |
11.8 |
46.7 |
118.9 |
155.3 |
1.0 |
Yes |
(20.9) |
100 |
0.0 |
Sector weighted average |
23.5 |
49.6 |
119.1 |
174.2 |
1.2 |
(13.6) |
102 |
0.0 |
||
JUS rank in sector |
2 |
2 |
3 |
3 |
2 |
2 |
2 |
2 |
=1 |
|
Open-ended funds |
||||||||||
Artemis US Smaller Companies |
187.6 |
43.9 |
-- |
-- |
-- |
0.0 |
||||
F&C US Smaller Companies |
76.4 |
34.6 |
54.5 |
115.1 |
209.7 |
0.0 |
||||
GS US Sm Cap CORE Eq |
41.0 |
43.0 |
61.6 |
120.0 |
179.2 |
0.3 |
||||
Hermes US Smid Equity |
778.1 |
17.1 |
-- |
-- |
-- |
0.0 |
||||
Janus US Venture |
158.3 |
35.4 |
59.3 |
-- |
-- |
0.0 |
||||
JPM US Smaller Companies |
88.7 |
54.4 |
40.0 |
100.2 |
-- |
0.0 |
||||
Jupiter US Small and Midcap Cos |
27.9 |
30.1 |
-- |
-- |
-- |
0.0 |
||||
Legg Mason IF Royce US Smlr Cos |
229.7 |
39.4 |
37.6 |
71.1 |
155.9 |
0.0 |
||||
Legg Mason RY US Sm Cp Opp |
797.5 |
47.3 |
38.4 |
100.9 |
-- |
0.0 |
||||
Neuberger Berman US Sm Cap |
355.5 |
33.4 |
47.4 |
-- |
-- |
0.0 |
||||
Schroder US Smaller Companies |
822.2 |
41.3 |
66.1 |
125.7 |
230.6 |
0.0 |
||||
T. Rowe Price US Smlr Coms Eq |
952.8 |
39.4 |
63.8 |
143.7 |
268.7 |
0.0 |
||||
Threadneedle Amer Smlr Cos |
1,163.4 |
42.7 |
63.6 |
127.5 |
260.6 |
0.0 |
||||
Weighted average |
38.2 |
56.5 |
121.8 |
245.9 |
0.0 |
Source: Morningstar, Edison Investment Research. Note: TR = total return. Net gearing is total assets less cash and equivalents as a percentage of net assets (100 = ungeared).
The board
JUS has five non-executive directors. The chairman, Gordon Grender, has been on the board since 1993. Peter Barton, chairman of the audit and management engagement committees, was appointed in 1998. Norman Bachop joined the board in 1999 and is the senior independent director. Clive Parritt was appointed in 2007, with the newest director, Lisa Booth, joining the board in 2015. The directors have backgrounds in US equity fund management, investment banking, accountancy and law.
|
|
Research: Healthcare
ReNeuron reported in December 2016 positive Phase II trial data for its CTX cells in chronic stroke patients, despite not meeting the three-month time frame of a two-point improvement in its primary outcome measure, the Action Research Arm Test (ARAT). As a result, the company has confirmed that it will progress to a pivotal controlled clinical study in 2017. Beyond CTX, we expect safety and efficacy data from its retinitis pigmentosa (RP) trial in 2017 and Phase I data from its critical limb ischaemia (CLI) trial. Our rNPV has increased to £291m.