Last close As at 05/08/2026
GBP0.84
▲ −1.10 (−1.29%)
Market capitalisation
GBP412m
Research: Real Estate
Custodian Property Income REIT’s (CREI’s) Q225 trading update points to strong H1 performance when results are released in December. With income growth supported by leasing progress and rental growth, DPS (+9% y-o-y) is fully covered. Reflecting improved investment market sentiment and asset management, portfolio valuations show early signs of recovery. CREI expects this to continue.
Custodian Property Income REIT |
Significant uplift in fully covered DPS |
Q225 update |
Real estate |
13 November 2024 |
Share price performance
Business description
Next events
Analyst
Custodian Property Income REIT is a research client of Edison Investment Research Limited |
|||||||||||||||||||||||||||||||||||||||||||||
Custodian Property Income REIT’s (CREI’s) Q225 trading update points to strong H1 performance when results are released in December. With income growth supported by leasing progress and rental growth, DPS (+9% y-o-y) is fully covered. Reflecting improved investment market sentiment and asset management, portfolio valuations show early signs of recovery. CREI expects this to continue.
Year end |
Net rental income (£m) |
EPRA earnings* (£m) |
EPRA |
NAV/** |
DPS |
P/NAV** |
Yield |
03/23 |
37.1 |
24.8 |
5.6 |
99.3 |
5.50 |
0.79 |
7.1 |
03/24 |
38.9 |
25.7 |
5.8 |
93.4 |
5.80 |
0.83 |
7.4 |
03/25e |
40.2 |
27.2 |
6.2 |
94.1 |
6.00 |
0.83 |
7.7 |
03/26e |
40.8 |
27.5 |
6.2 |
94.3 |
6.12 |
0.83 |
7.8 |
Note: *Excludes revaluation gains/losses and other exceptional items. **Defined as EPRA net tangible assets (EPRA NTA) per share.
Occupier strength and asset management
On a like-for-like basis, the portfolio estimated rental value (ERV) increased 0.8% in Q225 (Q1: 1.0%). Passing rent increased 1.5% (Q1: 1.2%), driven by positive leasing events, in aggregate at rents well above previous passing rents and/or ERV. With portfolio ERV of £49.3m compared with passing rent of £44.3m, reversionary upside remains strong, and borrowing costs are mostly fixed. Selective property disposals are accretive to earnings and NAV, with proceeds supporting further debt reduction. Property valuations edged up in Q2 and CREI’s investment manager is increasingly confident that the market has bottomed and that valuations will gradually pick up. H125 NAV total return of 3.5% was driven by DPS paid.
Diversified exposure to a market recovery
Across most of the UK commercial property market, but especially the industrial sector, robust occupier demand has underpinned rental growth. Meanwhile, sector values are down c 20% from their peak and with interest rates now declining, investment market sentiment is improving. Recent private equity investment in the REIT sector is a positive indicator for a building recovery. CREI provides investors with diversified UK commercial property exposure, within a closed-end fund structure. It is differentiated by an enhanced income strategy that targets higher- yielding, smaller, regional properties, with strong income characteristics, let to predominantly institutional-grade tenants. Income risk is spread across a wide number of properties and tenants, the vast majority of which are externally classified as having better than average risk. Although diversified, the portfolio is not passively positioned and is actively managed. The weighting towards industrial and retail warehouse assets is strong.
Valuation: Growing DPS and attractive yield
Dividends are fully covered and CREI’s FY25 DPS target represents an attractive yield of 7.7%, with the potential for capital growth, while the discount to FY24 NAV is 17%.
H125 financial performance
3.5% NAV total return
Aggregate quarterly dividends declared in H125 of 3.0p (an increase of 9% versus H124) were fully covered by EPRA earnings of approximately £13.3m or 3.0p per share (H124: £13.0m or 2.9p per share; H224: £12.8m or 2.9p per share). NAV per share increased in Q225 after a slight dip in Q125 and was marginally up over the half year. NAV total return in H125 was 3.5% or an annualised 7.1%.
Exhibit 1: Quarterly performance
Q124 |
Q224 |
Q324 |
Q424 |
Q125 |
Q225 |
H125 |
||
£m unless stated otherwise |
Jun-23 |
Sep-23 |
Dec-23 |
Mar-24 |
Jun-24 |
Sep-24 |
Sep-24 |
|
Opening NAV |
437.6 |
434.9 |
422.8 |
411.2 |
411.8 |
410.3 |
411.8 |
|
Valuation movement |
(3.3) |
(12.3) |
(11.0) |
(0.5) |
(1.0) |
2.2 |
1.2 |
|
Profit/(loss) on disposal |
0.0 |
0.0 |
0.0 |
1.4 |
0.2 |
(0.3) |
(0.1) |
|
Acquisition costs |
0.0 |
0.0 |
(0.6) |
(0.9) |
0.0 |
0.0 |
0.0 |
|
EPRA earnings |
6.7 |
6.3 |
6.1 |
6.7 |
6.7 |
6.6 |
13.3 |
|
Dividends paid |
(6.1) |
(6.1) |
(6.1) |
(6.1) |
(7.4) |
(6.6) |
(14.0) |
|
Closing NAV |
434.9 |
422.8 |
411.2 |
411.8 |
410.3 |
412.2 |
412.2 |
|
NAV per share (p) |
98.6 |
95.9 |
93.3 |
93.4 |
93.1 |
93.5 |
93.5 |
|
EPRA EPS (p) |
1.5 |
1.4 |
1.4 |
1.5 |
1.5 |
1.5 |
3.0 |
|
DPS declared (p) |
1.375 |
1.375 |
1.375 |
1.375 |
1.500 |
1.500 |
3.0 |
|
Special DPS declared (p) |
- |
- |
- |
0.300 |
- |
- |
- |
- |
NAV total return* |
0.7% |
-1.3% |
-1.3% |
1.6% |
1.5% |
2.0% |
3.5% |
Source: Custodian Property Income REIT unaudited data, Edison Investment Research. Note: *NAV total return is based on DPS paid (not declared) in the period.
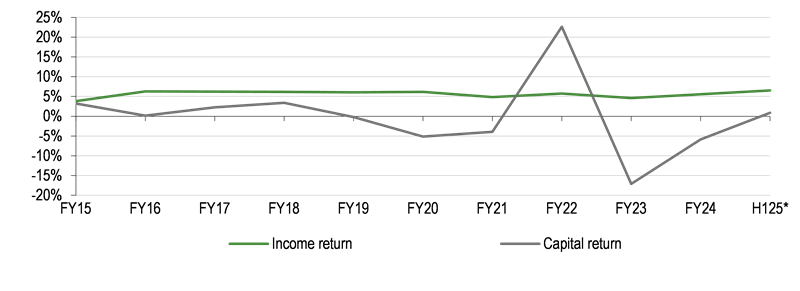
The table below shows the quarterly NAV total returns (the change in NAV adjusted for dividends paid) in more detail. In line with CREI’s income-focused strategy, dividends continue to consistently drive returns but with property investment market showing signs of improvement, capital return was also positive in Q225, and slightly so for H125. Reflecting CREI’s income-focused strategy and the broad, market-wide weakness of property values in the past two years, dividends paid have accounted for all of CREI’s aggregate c 57% accounting returns since listing in March 2015, contributing an average 4.7% pa.
Exhibit 2: NAV total return by quarter
Q124 |
Q224 |
Q324 |
Q424 |
Q125 |
Q225 |
H125* |
|
Pence per share (p) unless stated otherwise |
Jun-23 |
Sep-23 |
Dec-23 |
Mar-24 |
Jun-24 |
Sep-24 |
Sep-24 |
Opening NAV per share |
99.3 |
98.6 |
95.9 |
93.3 |
93.4 |
93.1 |
93.4 |
Closing NAV per share |
98.6 |
95.9 |
93.3 |
93.4 |
93.1 |
93.5 |
93.5 |
Dividends paid per share |
1.4 |
1.4 |
1.4 |
1.4 |
1.7 |
1.5 |
3.2 |
Dividend return |
1.4% |
1.4% |
1.4% |
1.5% |
1.8% |
1.6% |
3.4% |
Capital return |
-0.7% |
-2.7% |
-2.7% |
0.1% |
-0.3% |
0.4% |
0.1% |
NAV total return |
0.7% |
-1.3% |
-1.3% |
1.6% |
1.5% |
2.0% |
3.5% |
Source: Custodian Property Income REIT data, Edison Investment Research. Note: *H125 unaudited.
The relative stability of income returns versus more volatile and uncertain capital returns can be seen clearly in the chart below.
|
Exhibit 3: Relative stability of income returns |
|
|
Source: Custodian Property Income REIT data, Edison Investment Research. Note: *H125 annualised unaudited data. |
Asset sales
CREI has continued to dispose of assets, in aggregate at well above book values, using the proceeds to reduce its more expensive variable rate borrowing and fund capital expenditure.
During Q125, a vacant former car showroom in Redhill and a vacant industrial property in Warrington were sold for an aggregate £11.3m, 49% ahead of the Q324 valuation.
In Q225, vacant offices in Castle Donington were sold for £1.75m, in line with the end-Q125 valuation, and in Solihull for £1.4m, 33% ahead of the end-Q125 valuation.
Thus far in Q325, an occupied industrial unit in Sheffield has been sold to the occupier for £0.55m, 10% ahead of the Q125 valuation.
Valuations began to pick up in Q225
Following a period of stabilisation during the first half of this calendar year, valuations were marginally positive in the most recent quarter, as rental growth continues across all sectors, interest rates begin to decline, and investment activity in the direct property market starts to pick up. CREI is strongly of the view that the market has bottomed and that valuations will gradually pick up.
Exhibit 4: H125 portfolio valuation movements
Portfolio value |
Like-for-like valuation movement |
Like-for-like valuation movement (%) |
|||||||
£m unless stated otherwise |
H125 |
H125 |
Q125 |
Q225 |
H125 |
Q125 |
Q225 |
H125 |
|
Industrial |
287.2 |
49% |
1.7 |
0.9 |
2.6 |
0.6% |
0.3% |
0.9% |
|
Retail warehouse |
125 |
21% |
0.0 |
2.3 |
2.3 |
0.0% |
1.8% |
1.8% |
|
Other* |
77.2 |
13% |
(0.4) |
0.2 |
(0.2) |
-0.6% |
0.2% |
-0.3% |
|
High St retail |
32.8 |
6% |
(0.3) |
0.7 |
0.4 |
-0.7% |
2.2% |
1.2% |
|
Office |
60.2 |
10% |
(2.0) |
(1.9) |
(3.9) |
-3.2% |
-3.1% |
-6.5% |
|
Total portfolio |
582.4 |
100% |
(1.0) |
2.2 |
1.2 |
-0.2% |
0.5% |
0.2% |
|
Source: Custodian Property Income REIT data, Edison Investment Research. Note: *Other comprises drive-through restaurants, car showrooms, trade counters, gymnasiums, restaurants and leisure units.
Corporate activity continuing
Corporate activity and managed wind-downs have seen a marked reduction in the number of diversified, income-focused REITs and this continues apace. This has been a reaction to persistent sector-wide discounts to NAV. More recently private equity investors have emerged as buyers of listed REITs, recognising the potential for a recovery in the commercial real estate market.
Having announced a strategic review in April 2024, in September, Balanced Commercial Property Trust (BCPT) agreed a cash bid from funds owned by Starwood Capital, a global private investment firm focused on the real estate sector. Starwood offered 96p a share, a discount of 8.7% compared with BCPT’s end-June NAV per share of 105.1p.
Also in September, abrdn Property Income Trust Limited (API) agreed a portfolio takeover by accounts managed by the private investment firm, GoldenTree Asset Management. API has been pursuing a strategy of managed wind-down since its shareholders narrowly rejected an all-share bid from CREI earlier in the year. The GoldenTree transaction is expected to complete by the end of November and the cash consideration represents 64p per API share, a 12.7% discount to the end-June NAV per share of 73.3p.
Earlier in the year, UK Commercial Property REIT (UKCM) was acquired by Tritax, having ended discussion with Picton Property Income, and CT Property Trust (UKCPT) was acquired by LondonMetric. Among other diversified property companies, Circle Property and Ediston Property disposed of their portfolios and left the market and Place Capital is well-advanced with its portfolio wind-down.
Performance driven by rental growth and leasing
Rental growth is being driven by the industrial portfolio
On a like-for-like basis, the portfolio ERV increased 0.8% in Q225, following 1.0% growth in Q125, all driven by the industrial sector, while other sectors have been stable. Like-for-like passing rent increased 1.5% after a 1.2% increase in Q125 driven by positive leasing events, in aggregate at rents well above previous passing rents and/or ERV.
Portfolio ERV of £49.3m exceeds passing rent of £44.3m by £5.0m or 11%. While the organic rental income opportunity remains significant, the gap between ERV and rent roll has narrowed since the start of the year (FY24: £6.2m or 14%) primarily because of the sale of vacant properties (reducing ERV without reducing passing rent). The reversionary upside potential from re-letting existing occupied space at market rent levels is £1.8m (FY24: £2.1m) with an additional £3.2m potential from further void reduction.
EPRA occupancy1 has increased from 91.7% at the start of the year to 93.5% at the end of Q225, also reflecting the sale of vacant properties and leasing events.
1Reflects the ERV of occupied space as a proportion of total ERV.
Although the sale of vacant properties has no impact on rent roll, it has a positive impact on net rental income by reducing property operating costs.
Occupier demand has remained
Leasing activity during Q225 added c £0.7m of new annual rent, a similar level as in Q125.
Rent reviews and lease renewals have in aggregate been at a premium to ERV and passing rent through both Q125 and Q225. Letting of vacant space and new leases with existing tenants have been in line with ERV, with the latter at a premium to passing rent.
Since the end of H125, an aggregate c £0.6m of leasing events have completed, including an aggregate c £150k pa from the letting of vacant space, a 78% uplift in passing rent (c £0.2m) on a rent review of an industrial property, and a number of new lease agreements with existing tenants. Most significantly, CREI has reached an agreement (subject to planning permission and vacant possession) to let an office building in Manchester, currently undergoing refurbishment, on a 12-year lease with an annual rent of c £715k.
These positive leasing developments have been partly offset by the failure of two (of c 370) tenants of industrial properties. The lease on one of the industrial units, with an annual rent of £0.5m, is expected to be assigned to a new business owner resulting in an unchanged rent but a £0.3m write-off of arrears. The tenant of the other unit, with annual rent of £0.4m, has entered administration with c £0.1m of rent arrears. CREI says that should the administrators decide to vacate, it will take the opportunity to carry out a comprehensive refurbishment of the unit to improve its specification and let it at a higher rent.
Exhibit 5: Leasing events
Q125 |
Q225 |
H125 total |
|
Reviews |
|||
Number of lease events |
3 |
2 |
5 |
Annual rent (£m) |
1.3 |
0.1 |
1.3 |
Premium to ERV |
11% |
14% |
11% |
Premium to passing rent |
41% |
33% |
41% |
New annual rental income (£m) |
0.4 |
0.0 |
0.4 |
Lease renewals |
|||
Number of lease events |
2 |
5 |
7 |
Annual rent (£m) |
0.1 |
0.3 |
0.4 |
Premium to ERV |
6% |
11% |
10% |
Premium to passing rent |
0% |
23% |
17% |
New annual rental income (£m) |
0.0 |
0.1 |
0.1 |
New leases – vacant space |
|||
Number of lease events |
7 |
8 |
15 |
New annual rental income (£m) |
0.3 |
0.7 |
1.0 |
New leases - existing tenants |
|||
Number of lease events |
5 |
5 |
|
Annual rent (£m) |
1.0 |
1.0 |
|
Premium to passing rent |
7% |
7% |
|
New annual rental income (£m) |
0.0 |
0.1 |
0.1 |
Total leasing events |
|||
Number of lease events |
12 |
20 |
32 |
Annual rent (£m) |
1.6 |
2.0 |
3.6 |
New annual rental income (£m) |
0.7 |
0.7 |
1.4 |
Source: Custodian Property Income data, Edison Investment Research
No change to earnings forecasts
There are no material changes to our forecasts, which, given the continuing uncertainty around the pace of UK economic growth assume little by way of rental or valuation growth. This is reflected in only modest gains in gross rental income with a marginally faster increase in net rental income as void costs fall away. With no material change in administrative or finance costs this supports further uplifts in earnings and DPS.
Property valuations are held broadly flat, and NAV grows modestly.
Exhibit 6: Forecast summary
Forecast |
Previous forecast |
Change in forecast |
||||
£m unless stated otherwise |
FY25e |
FY26e |
FY25e |
FY25e |
FY25 |
FY26 |
Gross rental & other income |
44.0 |
44.2 |
43.4 |
44.0 |
0.6 |
0.2 |
Non-recoverable property costs |
(3.7) |
(3.4) |
(3.1) |
(3.2) |
(0.6) |
(0.2) |
Net rental income |
40.2 |
40.8 |
40.3 |
40.8 |
(0.0) |
0.0 |
Administrative expenses |
(5.5) |
(5.6) |
(5.5) |
(5.6) |
0.0 |
0.0 |
Net Interest |
(7.5) |
(7.7) |
(7.4) |
(7.6) |
(0.1) |
(0.0) |
EPRA earnings |
27.2 |
27.5 |
27.3 |
27.5 |
(0.1) |
0.0 |
Realised & unrealised property gain/(losses) |
3.1 |
0.0 |
4.0 |
0.0 |
(0.9) |
0.0 |
IFRS earnings |
30.3 |
27.5 |
31.3 |
27.5 |
(1.0) |
0.0 |
EPRA EPS (p) |
6.2 |
6.2 |
6.20 |
6.25 |
(0.0) |
0.0 |
IFRS EPS (p) |
6.9 |
6.2 |
7.1 |
6.2 |
(0.2) |
0.0 |
DPS declared (p) |
6.00 |
6.12 |
6.00 |
6.12 |
0.0 |
0.0 |
Dividend cover (x) |
1.03 |
1.02 |
1.03 |
1.02 |
||
EPRA NTA (p) |
94.1 |
94.3 |
94.3 |
94.5 |
(0.2) |
(0.2) |
EPRA NTA total return |
7.4% |
6.6% |
7.6% |
6.6% |
||
LTV |
28.4% |
28.3% |
28.0% |
29.6% |
||
Source: Edison Investment Research
Predominantly fixed-cost borrowing
The end-H125 loan to value ratio was 28.6%, ahead of the company’s medium-term target of 25%, but with significant headroom against debt covenants and a substantial pool of assets unencumbered by borrowings (£108m at end-FY24, or 18% of the portfolio value).
End-H125 borrowings were £174m, from total facilities of £190m, or £215m including an accordion option at the discretion of the lender. Drawn borrowings comprised £140m (80% of the total) of long-term fixed-rate debt, at a blended interest cost of 3.4%, with a six-year average maturity, and £34m of floating rate debt, drawn from the company’s revolving credit facility (RCF). The weighted average cost of aggregate borrowings was 4.0%.
Property disposals in the past year have provided funding for capex and a reduction in borrowing from £185m at end-H124. The first debt maturity, the £20m Scottish Widows facility, is not until August 2025 (Q226) and with £41m of borrowing headroom including a £25m accordion facility on the RCF, we see no obstacles to refinancing. The cost of refinanced debt is likely higher than the current 4.0% but given the relatively small size of the facility this not material (a two percentage point increase is equivalent to less than 0.1p per share).
Exhibit 7: Summary of end-H125 debt portfolio
Lender |
Facility |
Drawn at end-FY24 (£m) |
Margin* |
Term to maturity (years)*** |
Maturity date |
Scottish Widows |
20.0 |
20.0 |
3.9% |
.9 |
Aug-25 |
Scottish Widows |
45.0 |
45.0 |
3.0% |
3.7 |
Jun-28 |
Aviva tranche 1 |
35.0 |
35.0 |
3.0% |
7.5 |
Apr-32 |
Aviva tranche 2 |
15.0 |
15.0 |
3.3% |
8.1 |
Nov-32 |
Aviva tranche 3 |
25.0 |
25.0 |
4.1% |
8.1 |
Nov-32 |
Total fixed rate |
140.0 |
140.0 |
3.4% |
5.5 |
|
Lloyds Bank revolving credit facility** |
50.0 |
34.0 |
SONIA +1.62%-1.92% |
2.2 |
Nov-26 |
Total debt facilities |
190.0 |
174.0 |
4.7 |
Source: Custodian Property Income REIT data, Edison Investment Research. Note: *Margin data rounded to one decimal point. **Does not include £25m accordion option at discretion of lender. ***As at 30 September 2024.
Valuation and performance
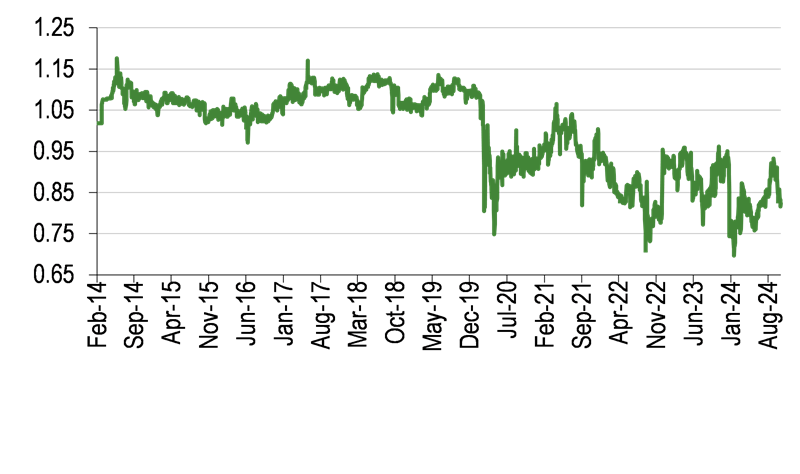
CREI’s 6.0p target DPS for FY25 represents a prospective yield of 7.7%. Meanwhile, the shares trade at an 17% discount to the H125 NAV per share of 93.5p.
|
Exhibit 8: Dividend yield history (%) |
Exhibit 9: P/NAV history |
|
|
|
Source: Custodian Property Income REIT trailing DPS data, LSEG Data & Analytics share prices |
Source: Custodian Property Income REIT trailing NAV data, LSEG Data & Analytics share prices |
|
Exhibit 8: Dividend yield history (%) |
|
|
Source: Custodian Property Income REIT trailing DPS data, LSEG Data & Analytics share prices |
|
Exhibit 9: P/NAV history |
|
|
Source: Custodian Property Income REIT trailing NAV data, LSEG Data & Analytics share prices |
The list of regionally focused, diversified REITs that represent CREI’s close peers has shrunk materially as a result of corporate activity and company wind-downs. CREI’s P/NAV and yield are in line with the peer group average although there is a fairly wide dispersion within the group. CREI and the peer group have outperformed the broader property sector over the past three years but have significantly underperformed versus the broad UK equity market.
Exhibit 10: Peer performance and valuation
Price |
Market cap (£m) |
P/NAV |
Trailing yield (%)** |
Share price performance |
||||
One month |
Three months |
One year |
Three years |
|||||
AEW UK REIT |
95 |
151 |
0.87 |
8.4 |
0% |
1% |
-2% |
-12% |
Picton Property Income |
68 |
375 |
0.71 |
5.3 |
-6% |
-7% |
6% |
-31% |
Schroder REIT |
49 |
238 |
0.82 |
6.9 |
-6% |
3% |
17% |
-1% |
Average |
0.80 |
6.9 |
-4% |
-1% |
7% |
-14% |
||
Custodian Property Income REIT |
77 |
341 |
0.83 |
7.1 |
-7% |
-1% |
-10% |
-19% |
UK property sector index |
1,245 |
-7% |
-7% |
2% |
-35% |
|||
UK equity market index |
4,393 |
-3% |
-2% |
9% |
5% |
|||
Source: Company data, LSEG Data & Analytics prices at 4 May 2024. Note: *Based on last reported EPRA NAV/NTA. **Based on trailing 12-month DPS declared.
Exhibit 11: Financial summary
Year end 31 March, £m |
2022 |
2023 |
2024 |
2025e |
2026e |
INCOME STATEMENT |
|||||
Gross rental & other income |
39.0 |
40.6 |
43.0 |
44.0 |
44.2 |
Non-recoverable property costs |
(3.4) |
(3.5) |
(4.0) |
(3.7) |
(3.4) |
Net rental income |
35.6 |
37.1 |
38.9 |
40.2 |
40.8 |
Administrative expenses |
(5.5) |
(6.0) |
(5.3) |
(5.5) |
(5.6) |
Operating Profit before revaluations |
30.1 |
31.0 |
33.7 |
34.7 |
35.2 |
Revaluation of investment properties |
94.0 |
(91.6) |
(27.0) |
3.2 |
0.0 |
Costs of acquisitions |
(2.3) |
(3.4) |
(1.6) |
0.0 |
0.0 |
Profit/(loss) on disposal |
5.4 |
4.4 |
1.4 |
(0.1) |
0.0 |
Operating Profit |
127.2 |
(59.6) |
6.5 |
37.8 |
35.2 |
Net Interest |
(4.8) |
(6.3) |
(8.0) |
(7.5) |
(7.7) |
Profit Before Tax |
122.3 |
(65.8) |
(1.5) |
30.3 |
27.5 |
Taxation |
0.0 |
0.0 |
0.0 |
0.0 |
0.0 |
Profit After Tax |
122.3 |
(65.8) |
(1.5) |
30.3 |
27.5 |
Adjust for: |
|||||
Net revaluation of investment property/costs of acquisition |
(91.7) |
90.6 |
25.7 |
(3.1) |
0.0 |
Gains/(losses) on disposal |
(5.4) |
0.0 |
1.6 |
0.0 |
0.0 |
EPRA earnings |
25.3 |
24.8 |
25.7 |
27.2 |
27.5 |
Average Number of Shares Outstanding (m) |
428.7 |
440.9 |
440.9 |
440.9 |
440.9 |
IFRS EPS (p) |
28.5 |
(14.9) |
(0.3) |
6.9 |
6.2 |
EPRA EPS (p) |
5.9 |
5.6 |
5.8 |
6.2 |
6.2 |
Dividend per share (p) |
5.25 |
5.50 |
5.80 |
6.00 |
6.12 |
Dividend cover (x)* |
1.10 |
1.01 |
1.01 |
1.03 |
1.02 |
Ongoing charges ratio (excluding property expenses) |
1.20% |
1.23% |
1.24% |
1.33% |
1.35% |
NAV total return |
28.4% |
-12.5% |
-0.3% |
7.4% |
6.6% |
BALANCE SHEET |
|||||
Non-current assets |
665.2 |
614.7 |
581.1 |
591.8 |
599.4 |
Investment properties |
665.2 |
613.6 |
578.1 |
588.8 |
596.4 |
Other non-current assets |
0.0 |
1.1 |
3.0 |
3.0 |
3.0 |
Current assets |
16.8 |
10.6 |
24.0 |
11.7 |
10.1 |
Debtors |
5.2 |
3.7 |
3.3 |
3.5 |
3.5 |
Cash |
11.6 |
6.9 |
9.7 |
8.2 |
6.6 |
Current liabilities |
(39.9) |
(15.1) |
(15.4) |
(15.4) |
(15.4) |
Creditors/Deferred income |
(17.2) |
(15.1) |
(15.4) |
(15.4) |
(15.4) |
Short term borrowings |
(22.7) |
0.0 |
0.0 |
0.0 |
0.0 |
Non-current liabilities |
(114.5) |
(172.7) |
(177.9) |
(173.2) |
(178.5) |
Long term borrowings |
(113.9) |
(172.1) |
(177.3) |
(172.6) |
(177.9) |
Other long term liabilities |
(0.6) |
(0.6) |
(0.6) |
(0.6) |
(0.6) |
Net assets |
527.6 |
437.6 |
411.8 |
414.9 |
415.6 |
NAV/share (p) |
119.7 |
99.3 |
93.4 |
94.1 |
94.3 |
EPRA NTA/share (p) |
119.7 |
99.3 |
93.4 |
94.1 |
94.3 |
CASH FLOW |
|||||
Operating Cash Flow |
32.6 |
24.3 |
23.2 |
25.7 |
26.2 |
Net Interest |
(4.5) |
(27.5) |
18.0 |
14.3 |
0.0 |
Tax |
0.0 |
(12.6) |
(19.0) |
(9.1) |
(6.0) |
Net additions to investment property (inc property, plant & equipment |
26.6 |
(40.1) |
(1.0) |
5.2 |
(6.0) |
Ordinary dividends paid |
(24.2) |
0.0 |
0.0 |
0.0 |
0.0 |
Debt drawn/(repaid) |
(25.1) |
(24.3) |
(24.2) |
(27.2) |
(26.8) |
Proceeds from shares issued (net of costs) |
0.5 |
35.3 |
4.8 |
(5.0) |
5.0 |
Other cash flow from financing activities |
1.7 |
11.0 |
(19.4) |
(32.2) |
(21.8) |
Net Cash Flow |
7.7 |
(4.7) |
2.8 |
(1.3) |
(1.6) |
Opening cash |
3.9 |
11.6 |
6.9 |
9.7 |
8.4 |
Closing cash |
11.6 |
6.9 |
9.7 |
8.4 |
6.8 |
Debt as per balance sheet |
(136.6) |
(172.1) |
(177.3) |
(172.6) |
(172.9) |
Unamortised loan arrangement fees |
(1.1) |
(1.4) |
(1.7) |
(1.4) |
(1.1) |
Total debt |
(137.8) |
(173.5) |
(179.0) |
(174.0) |
(174.0) |
Restricted cash |
(1.1) |
(1.5) |
(2.5) |
(1.8) |
(1.8) |
Closing net debt |
(127.3) |
(168.1) |
(171.8) |
(167.4) |
(169.0) |
Net LTV |
19.1% |
27.4% |
29.2% |
28.4% |
28.3% |
Source: Custodian Property Income REIT historical data, Edison Investment Research forecasts
|
|
Research: Real Estate
Regional REIT (RGL) has issued a Q324 trading update and has declared a quarterly DPS of 2.2p, in line with previous guidance. The retention rate on lease renewals remains high, partly reflecting the benefits of portfolio capex, also reflected in a further improvement in the EPC rating. A more general uptick in leasing is yet to be seen, with budget-related torpor also acting as a drag on the completion of disposals. There is no change to our forecasts.