Last close As at 06/08/2026
—
— 0.00 (0.00%)
Market capitalisation
—
Research: Energy & Resources
Canacol Energy’s H121 production averaged 176.3mmscfd, demonstrating its continued resilience as Colombia recovers from COVID-19, and was above the midpoint of management’s full year production guidance of 153–190mmscfd. In August, sales were 186mmscfd. The 2021 drilling programme of up to 12 wells is well underway at an estimated capex of US$98–140m, and has delivered a discovery at Aguas Vivas 1, which encountered the thickest net pay for the company to date. Canacol targets a reserves replacement ratio (RRR) of 200% annually, which we estimate requires an active drilling programme of c 12–16 wells per year over the next five years (assuming a 70% success rate), and discovering gas outside the current core producing acreage. Meanwhile, a new gas pipeline will open up the interior market in Colombia from 2024.
Written by
Canacol Energy |
Shares do not price in exploration upside |
Q221 update |
Oil & gas |
9 September 2021 |
Share price performance
Business description
Next events
Analysts
Canacol Energy is a research client of Edison Investment Research Limited |
|||||||||||||||||||||||||||||||||||||||||||||||
Canacol Energy’s H121 production averaged 176.3mmscfd, demonstrating its continued resilience as Colombia recovers from COVID-19, and was above the midpoint of management’s full year production guidance of 153–190mmscfd. In August, sales were 186mmscfd. The 2021 drilling programme of up to 12 wells is well underway at an estimated capex of US$98–140m, and has delivered a discovery at Aguas Vivas 1, which encountered the thickest net pay for the company to date. Canacol targets a reserves replacement ratio (RRR) of 200% annually, which we estimate requires an active drilling programme of c 12–16 wells per year over the next five years (assuming a 70% success rate), and discovering gas outside the current core producing acreage. Meanwhile, a new gas pipeline will open up the interior market in Colombia from 2024.
Year end |
Revenue* (US$m) |
Adjusted EBITDAX** |
Cash from |
Net debt*** |
Capex**** |
Dividend yield (%) |
12/19 |
219.5 |
162.8 |
108.4 |
300.3 |
(84.3) |
1.4 |
12/20 |
246.8 |
184.6 |
152.3 |
298.9 |
(89.0) |
5.7 |
12/21e |
237.0 |
193.1 |
161.9 |
348.0 |
(148.2) |
5.8 |
12/22e |
287.9 |
240.4 |
200.3 |
377.6 |
(170.8) |
5.8 |
Note: *Revenue net of transport expense and royalty. **Adjusted EBITDAX is before non-recurring or non-cash charges and exploration expense. ***Cash and equivalents minus short- and long-term debt. ****Forecasts based on 2020 reserves 2P production profile.
New pipeline: Access to interior market
Canacol has secured a new long-term take or pay gas sales contract that will diversify its client base. It will be executed via a new pipeline connecting the company’s gas fields to the interior market in Colombia, an area that accounts for 60% of the country’s natural gas demand and that is expected to enter a supply shortfall from 2022. The pipeline is scheduled for completion by end-2024.
Track record of achieving 200% RRR
Canacol achieved a 200% RRR in all years over the period 2016–19. In 2020, the RRR was 120% (see Exhibit 1), due to only six of the planned 12 wells being drilled after delays caused by COVID-19. It has achieved an average success rate of more than 80% from 2016 and we therefore increase our success rate assumption (used in our valuation for additional risk reserves) to 70% from 50% previously. Canacol is carrying out an up to 12-well drilling programme in 2021 to achieve a 200% RRR, and we estimate that it requires c 12–16 wells per year over 2022–25 to maintain this rate. This will also require moving beyond the current producing licences. A 3D seismic survey in 2021 will look to expand the prospect inventory, while a first well is expected in the Middle Magdalena Valley from 2022.
Valuation: Significantly undervalued
Our risked exploration net asset value (RENAV) is based on a combination of 2P reserves and additional ‘to be developed’ risked reserves that we expect to be added over the next five years. We value core NAV at C$3.15, to which we add C$2.97 for additional risked reserves, to arrive at our valuation of C$6.12/share, which is 85% above the current share price. We believe the current share price does not fully reflect the potential upside from exploration.
Gas sales continue to be resilient
Canacol‘s gas sales remained resilient during 2020 despite lower than forecast production rates as a result of a decrease in spot market sales due to COVID-19. However, this only affected the c 20% of Canacol’s gas production sold under interruptible contracts and, with 80% of sales under long-term take-or-pay contracts denominated in US dollars, the company’s cash flows are protected against oil market weakness. Canacol still achieved a record average annual production rate of 171mmscfd in 2020 (up 19% y-o-y), reflecting the first full year of increased export capacity since the 85km gas pipeline extension between the Jobo gas processing facility and Cartagena came online in Q319. This solid performance has continued into H121, when production averaged 176.3mmscfd. Post H121, demand for spot market values has increased, with a contractual sales volume of c 190mmscfd in July 2021 and c 186mmscfd in August 2021. This increase in demand is due to a number of factors: a reduction in the recent civil unrest in Colombia, progress of the country’s COVID-19 vaccination roll-out and higher natural gas demand as a result of the weakening of the La Niña climate phenomenon. A continuation of sales at the August rate would imply an average production rate of c 181mmscfd, towards the high end of the company’s 2021 guidance of 153–190mmscfd. We adopt 180mmscfd in our forecasts.
2P reserves also increased in 2020 to 637bcf, albeit at a lower rate than in previous years, due to an enforced reduction in operational activity caused by the COVID-19 pandemic. The RRR for the year was 122%, below the company’s annual target of 200%, but we estimate that Canacol will return to this level in 2021, based on a 70% success rate in an assumed 12 wells.
Management expects capex of US$98–140m for the year based on its production guidance range, which will be fully funded from existing cash and 2021 cash flow. Canacol has identified a further US$23.5m of contingent capex for the completion, testing and tie-in of successful exploration wells.
The civil disturbances in Colombia have so far occurred in the cities and in the oil-producing Llanos, Middle Magdalena and Putumayo Basins, and have not adversely affected Canacol’s operations, which are located in the Lower Magdalena basin.
New pipeline to open-up interior market
Canacol announced on 30 August that a new 20-inch pipeline will be built from the Canacol gas treatment plant in Jobo to Medellin, c 285km to the south, at an estimated cost of c US$450m. The project will be financed by 70% debt and 30% equity, and we assume Canacol will own a 25% equity stake (c US$35), which is the maximum stake it can hold from a regulatory perspective. The pipeline, which is scheduled for completion by end-2024, will have an initial transportation capacity of c 100mmscfd, which can be expanded to 200mmscfd if additional compression capacity is installed. Canacol has secured a take or pay gas sales contract with Empresas Publicas de Medellin (EPM) (Colombia’s largest multi-utility). Under the terms of the contract, Canacol will supply gas to EPM in Medellin, via the new pipeline from 1 December 2024, initially at a rate of 21mmscfd, rising to 54mmscfd on 1 December 2025 and remaining at this level until the contract expires on 30 November 2035.
|
Exhibit 1: Colombia pipelines schematic |
|
|
Source: Canacol Energy |
The pipeline will connect Canacol’s fields to the interior market in Colombia, which has c 60% of Colombia’s growing gas demand. The region is reliant on the mature Llanos Basin gas fields that are expected to enter their decline phase from 2022. The pipeline will also allow Canacol to send gas to Bogota and Cali via the existing Transmetano and TGI gas pipeline networks. Canacol is working on further take or pay gas contracts with consumers in the interior, where gas demand is estimated to be c 160mmscfd in Bogota and 61mmscfd in Cali.
|
Exhibit 2: Natural gas supply/demand forecast for the interior of Colombia |
|
|
Source: Canacol Energy, Demand forecast: UPME Supply forecast: Declaracion de Produccion de Gas Natural 2021-2030 |
Canacol will now focus on completing a number of activities to progress the pipeline project. Work is being finalised on the environmental permit to be submitted to the National Environmental Permitting Authority for approval before the end of 2021. By the end of Q122, Canacol expects to have selected the pipeline contractor and arranged the necessary financing for the project. Meanwhile negotiations are ongoing to execute additional gas sales contracts for 45mmscfd to fill the remainder of the 100mmscfd capacity of the pipeline.
Strategy to maintain 200% RRR
Canacol has set itself a target of maintaining its 2P reserves life for more than eight years and to achieve an RRR of at least 200%. Historically, it has achieved this in all years over the period 2016–20 except for 2020, where the RRR was 120% (see Exhibit 3), although this was due to only six of the planned 12 wells being drilled after delays caused by COVID-19.
|
Exhibit 3: 2P added compared with production (bcf, LHS) and RRR (RHS) |
Exhibit 4: 2P added per well (bcf, LHS) and % success rate (RHS) |
|
|
|
Source: Canacol Energy, Edison Investment Research |
|
Exhibit 3: 2P added compared with production (bcf, LHS) and RRR (RHS) |
|
|
Source: Canacol Energy, Edison Investment Research |
|
Exhibit 4: 2P added per well (bcf, LHS) and % success rate (RHS) |
|
|
Source: Canacol Energy, Edison Investment Research |
In 2016–20, four to eight gas wells were drilled per year, with a high commercial success rate, ranging from c 70% to 100% on an annual basis (see Exhibit 4), and we estimate that the average 2P reserves added per commercial well is 17bcf (based on median). We note that this is a crude estimate as 2P reserves added (during any given year) do not necessarily correspond with successful wells drilled during that year (ie there is typically a lag) and may also relate to the development of existing 2P reserves.
Adopting average 2P reserves added of 15bcf per well (which is below the average 2P reserves added by Canacol over 2016-20) and a 70% chance of success, based on 12 wells for 2021 and our FY21 production forecast of 180mmscfd (or 65.7bcf), we estimate that Canacol will achieve an RRR of almost 200% in 2021, by adding c 126bcf. Using average capex over the last three years of US$1.1m/bcf, we estimate that this will require capex of c US$140m, which is at the top end of Canacol’s guidance range (US$98–140m). We note that the company has also allocated contingent capex of US$23.5m for the completion and tie-in of successful wells.
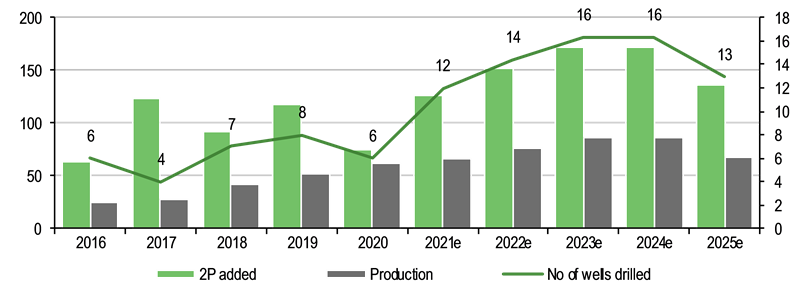
Furthermore, we estimate that to maintain an RRR of 200% over the period 2022–25, Canacol will need to drill c 13–16 wells pa, based on our annual production forecasts (see Exhibit 3). This will result in combined 2P added over 2022–25 of 629bcf, which we estimate requires total capex of c US$710m or c US$177m pa. We believe our assumption of 2P reserves added of 15bcf per well is reasonable, as we would expect this figure to trend downwards over time for existing acreage. However, we acknowledge that Canacol is planning to explore new acreage from 2022. In addition, our assumed 70% success rate is at the lower end of the rates Canacol has achieved historically.
|
Exhibit 5: Estimated 2P added to achieve 200% RRR over 2021–25 (bcf, LHS) and corresponding estimated required number of drilled wells (RHS) |
|
|
Source: Canacol, Edison Investment Research estimates |
Exploration plans: Drilling programme and seismic acquisition
|
Exhibit 6: Canacol acreage |
|
|
Source: Canacol Energy |
As of December 2020, Canacol has been independently assessed by Gaffney, Cline & Associates to hold 5.7tcf of gross mean, unrisked, conventional gas resources across 188 prospects and leads (up from 4.7tcf in December 2019). In addition, the company holds a 20% working interest (WI) in unconventional shale potential in VMM 2 and VMM 3 in the Middle Magdalena Valley, with gross mean prospective resources of 2,083mmbbls of oil and 5252bcf of gas in the La Luna prospect.
Despite a historical success rate of c 80%, we note that the first two exploration wells of the programme, Flauta-1 and Milano-1, did not encounter commercial gas. However, the third exploration well, Aguas Vivas 1, encountered 412ft of TVD of net gas pay, the thickest yet found by the company in the main Cienega de Oro (CDO) sandstone reservoir (the previous thickest CDO interval of 309ft TVD was found in the Clarinete-5 development well). The well was tested at a final rate of 35.5mmscfd and an average rate of 17.2mmscfd, and has been tied into the Jobo gas treatment facility.
To prove up this new gas discovery, Canacol immediately drilled the Aguas Vivas-2 appraisal well, which encountered 229ft TVD of net gas pay, followed by a second appraisal well, Aguas Vivas-3, with 378ft TVD of net gas pay. The company will now integrate these results with the existing 3D seismic to assess the extent of the Aguas Vivas accumulation and to define development locations for future drilling.
|
Exhibit 7: 2021 well locations |
|
|
Source: Canacol Energy |
As the prospect sizes in VIM-5, VIM-21 and Esperanza diminish, Canacol will need to move beyond these licences to target larger prospects. In 2021, it will acquire 655km2 of 3D seismic across VIM-5 and SSJN-7 to identify new leads and prospects in order to expand the exploration prospect inventory. The seismic acquisition over SSJN-7 has been successfully completed, and the acquisition at VIM-5 is currently ongoing. The company also intends to build a new area of production in blocks VMM-45 and VMM-49 in the Middle Magdalena Valley.
Following seismic acquisition, Canacol intends to drill its first well in the Middle Magdalena Valley in 2022 or 2023, maintaining a policy of targeting the biggest structures first, and followed by c two wells per year in subsequent years. These wells are expected to be more expensive than those currently being drilled, at c US$15m each compared to c US$4m each in the Lower Magdalena Valley.
Aguas Vivas 1 success alters 2021 programme
A planned 2020 drilling programme of 12 wells had to be cut back to six wells to meet COVID-19 restrictions. However, Canacol is now planning to drill up to 12 wells in a continuous programme throughout 2021 in what will be the largest ever undertaken by the company. In 2020, Canacol drilled two exploration wells, three development wells and one appraisal well. In 2021, the emphasis shifted towards exploration, with nine exploration wells and three development wells planned at the start of the year. However, the success at Aguas Vivas 1 has altered this original drilling plan, as Canacol looks to prove up the new discovery with two appraisal wells, Aguas Vivas 2 and 3, being drilled back to back. As of September 2021, this will result in three development wells, two appraisal wells and seven exploration wells being drilled in 2021, with Saxofon-1, Fragata-1 and Pifano-1 dropping off the drill programme to be replaced by the two Aguas Vivas appraisal wells and San Marcos-1, an exploration well to the east of the Aguas Vivas accumulation. Due to the success of Aquas Vivas 1, we do not change our 15bcf per commercial well assumption.
Exhibit 8: 2021 originally planned wells
Block |
Well |
Well-type |
Esperanza |
Milano-1* |
Exploration |
Fragata-1 |
Exploration |
|
Cãnahuate-4* |
Development |
|
Nelson-9* |
Development |
|
VIM-21 |
Aguas Vivas 1* |
Exploration |
Cornamusa-1 |
Exploration |
|
VIM-5 |
Saxofon-1 |
Exploration |
Corneta-1 |
Exploration |
|
Pifano-1 |
Exploration |
|
Siku-1 |
Exploration |
|
Flauta-1* |
Exploration |
|
Oboe-2* |
Development |
Source: Canacol Energy. Note: *Wells drilled/underway.
To date, the Oboe-2, Cãnahuate-4 and Nelson-9 development wells have been completed and tied into the Jobo processing facility. Neither of the Flauta-1 and Milano-1 exploration wells encountered commercial gas and both have been plugged and abandoned. After the success in the Aguas Vivas 1 exploration well and the Aguas Vivas 2 and 3 appraisal wells, the next well to be drilled will be the San Marcos exploration well.
Valuation and financials
We update our valuation to reflect the 2020, Q121 and Q221 results, end-2020 2P reserves, our adjusted expectations of Canacol’s exploration programme (and assumed reserves additions) and a more conservative outlook on gas prices, consistent with the company’s reserves auditor and reflected in the end-2020 reserves data.
Exhibit 9: Old versus new forecasts
New |
Old |
Difference |
Comment |
|
Valuation (C$/share) |
||||
Core NAV |
3.15 |
3.63 |
(0.47) |
Decrease in long-term gas price assumptions |
Additional reserves |
2.97 |
2.25 |
0.72 |
Increase in assumed success rate for exploration and factor in 335mmscfd plateau production due to Medellin pipeline |
Valuation |
6.12 |
5.88 |
0.25 |
|
Financial extracts for FY21 (US$) |
||||
Revenue |
237 |
228 |
9 |
Decrease in gas price netted off with increase in production |
EBITDAX |
193 |
187 |
6 |
Decrease in gas price netted off with increase in production |
CFO |
162 |
156 |
6 |
Decrease in gas price netted off with increase in production |
Source: Edison Investment Research
Gas price assumptions
We adopt the latest Boury Global Energy Consultants compiled gas price assumptions in our model, consistent with the long-term prices in Canacol’s Annual Information Form (AIF) published with the FY20 results (see Exhibit 10). This shows a considerable drop in gas price outlook (from the 2019 AIF), in part due to an assumed lower component of interruptible volumes in the sales gas mix, and in part due to lower price assumptions for both take-or-pay and interruptible sales.
We had already assumed a substantially lower gas price outlook than Canacol’s reserves auditor (as explained in our January Outlook note), hence the impact on our valuation is substantially less than that reported with the 2020 reserves (as discussed in our last note published on 9 March 2021). The differences between the 2019 and 2020 AIFs as well as our previous gas price assumptions are shown in Exhibit 10.
|
Exhibit 10: Change in gas price assumptions ($/mcf) |
|
|
Source: Canacol Energy, Edison Investment Research |
The average realised sales price in Q221 was $4.09/mcf, 6% below Q121 ($4.35/mcf), mostly due to offtakers under higher-priced fixed contracts performing regular maintenance. In addition, the spot market was negatively affected by reduced demand due to the La Niña climate phenomenon and the shutdown in Colombia due to political unrest. We expect the average realised sales price to increase above Q121 levels in H2 and therefore keep our price forecast for FY21 unchanged at c $4.35/mcf.
Additional expected reserves added from exploration
In our valuation, we include an estimate of additional reserves added from the ongoing drilling programme over the next five years. Based on our analysis outlined at the start of the previous section, we estimate that additional 2P reserves of 762bcf will be added over 2021–25. Based on an estimated NPV of C$0.85/mcf, this equates to potential additional value of US$453m, or C$2.97/share. This is notably higher than our previous estimate of US$324m (or C$2.25/share) and is driven by relaxing our assumption of the success rate from wells drilled to 70% from 50% previously, following a review of the company’s exploration strategy and reflecting reduced execution risk (see analysis in ‘Strategy to maintain 200% RRR’).
We note that there will be an increase in capex as a result of our increased assumptions on exploration activity. This results in negative FCF in the near term (2021–24), but will assist a continued increase in production post 2025 once the Medellin pipeline is complete; we assume plateau production of 335mmscfd.
Valuation implications
Our core NAV for Canacol decreases from C$3.63/share to C$3.15/share, mainly as a result of lower gas price assumptions that now reflect the latest reserves data. However, our NAV, including additional reserves which we expect to be produced in the medium term from ongoing exploration, has increased from C$5.87/share to C$6.12/share. The breakdown of our base case valuation is shown in Exhibit 11.
Exhibit 11: Base case valuation
Asset |
Number of shares: 192.1m** |
Recoverable reserves |
Net risked value |
|||||
Country |
Diluted WI |
CoS |
Gross |
Net WI |
NPV |
Absolute |
C$/share |
|
|
% |
% |
bcf |
US$/mcf |
US$m |
12.5% |
||
Adjusted net (debt)/cash at end 2020* |
(302) |
(1.97) |
||||||
SG&A - NPV of five years |
(102) |
(0.67) |
||||||
Decommissioning provisions |
(25) |
(0.16) |
||||||
Cash from assumed exercise of options |
53 |
0.34 |
||||||
Producing assets |
||||||||
Esperanza |
Colombia |
100% |
100% |
207 |
207 |
1.36 |
281 |
1.83 |
VIM-21 |
Colombia |
100% |
100% |
50 |
50 |
1.81 |
90 |
0.59 |
VIM-5 |
Colombia |
100% |
100% |
381 |
381 |
1.28 |
486 |
3.17 |
Core NAV |
|
|
|
637 |
637 |
|
481 |
3.15 |
Exploration/development upside |
||||||||
Five-year programme (assumes 200% RRR) |
|
100% |
70% |
762 |
762 |
0.85 |
453 |
2.97 |
Total NAV |
|
|
|
1,399 |
1,399 |
|
935 |
6.12 |
Source: Edison Investment Research Note: *Adjusted for shares repurchased since year-end. **Fully diluted number of shares.
Discount sensitivity rate
We have used a generic discount rate of 12.5% in our valuation. This is in line with that used for funded, cash-generative E&Ps with operations in emerging markets, resulting in our valuation of C$6.12/share. At a 10% discount rate, it would increase to C$6.78/share. We provide a sensitivity to this key input below.
Exhibit 12: 2P and risked exploration NAV sensitivity (C$/share) to WACC
8.0% |
10.0% |
12.5% |
15.0% |
|
2P NAV |
4.43 |
3.81 |
3.15 |
2.61 |
Risked NAV |
7.40 |
6.78 |
6.12 |
5.57 |
Source: Edison Investment Research
Relative valuation
Canacol trades at a P/CF multiple of 2.4x in FY22e compared to its Canadian (junior) E&P peers on 2.0x and its North American E&P peers with South American operations on 1.7x. North American E&P peers with South American operations include Frontera Energy, Gran Tierra, Parex Resources, Petrotal and GeoPark; excluding Gran Tierra, which is an outlier, FY22e P/CF for this peer group becomes 1.9x.
Exhibit 13: Peer group valuation table
Market cap (US$m) |
EV |
P/CF |
P/CF |
EV/EBITDA FY21e (x) |
EV/EBITDA FY22e (x) |
FCF yield FY21e (%) |
FCF yield FY22e (%) |
Net debt/ |
Net debt/ |
Div yield FY21e (%) |
Prod growth FY22e (%) |
EV/kboed FY21e (x) |
|
Edison estimate - Canacol |
466 |
802 |
2.9 |
2.4 |
4.3 |
3.4 |
-2.2 |
1.0 |
2.0 |
1.8 |
5.8 |
15.3 |
25.4 |
North American E&P peers with South American operations |
735 |
990 |
2.5 |
1.7 |
2.9 |
2.2 |
15.6 |
41.1 |
1.0 |
0.7 |
0.4 |
19.9 |
30.1 |
Frontera Energy Corp |
541 |
801 |
2.0 |
1.4 |
2.3 |
1.9 |
-1.3 |
33.1 |
0.9 |
0.7 |
0.0 |
6.8 |
21.0 |
GeoPark |
708 |
1,325 |
3.4 |
2.1 |
4.2 |
3.1 |
12.5 |
23.9 |
1.9 |
1.4 |
0.9 |
10.6 |
34.0 |
Gran Tierra Energy |
202 |
909 |
0.9 |
0.6 |
3.4 |
2.5 |
50.0 |
77.4 |
2.7 |
2.0 |
0.0 |
19.1 |
33.7 |
Parex Resources |
2,013 |
1,643 |
3.5 |
2.9 |
2.4 |
2.2 |
14.8 |
17.7 |
-0.5 |
-0.4 |
0.9 |
12.5 |
34.9 |
210 |
271 |
2.8 |
1.4 |
1.9 |
1.4 |
1.9 |
53.3 |
0.0 |
0.0 |
0.0 |
50.4 |
27.1 |
|
Canada |
3,613 |
5,163 |
3.0 |
2.4 |
4.2 |
3.2 |
10.0 |
21.4 |
1.4 |
1.1 |
1.2 |
12.8 |
26.6 |
Junior E&P <30kboed |
317 |
516 |
2.9 |
2.0 |
4.3 |
2.8 |
2.6 |
25.0 |
1.7 |
1.1 |
0.0 |
22.5 |
23.5 |
Cardinal Energy (Alberta) |
396 |
553 |
3.6 |
2.5 |
4.6 |
3.3 |
17.1 |
29.4 |
1.6 |
1.1 |
0.0 |
9.7 |
28.5 |
Crew Energy |
246 |
533 |
2.5 |
1.7 |
5.2 |
3.3 |
-12.2 |
23.1 |
2.6 |
1.6 |
0.0 |
24.1 |
20.0 |
Kelt Exploration |
552 |
527 |
4.8 |
3.3 |
5.3 |
3.0 |
-3.6 |
1.9 |
-0.2 |
-0.1 |
0.0 |
35.5 |
24.5 |
Obsidian Energy |
193 |
533 |
1.2 |
1.1 |
2.9 |
2.7 |
15.1 |
38.1 |
1.9 |
1.8 |
0.0 |
6.9 |
21.9 |
Pipestone Energy Corp |
295 |
484 |
3.3 |
1.8 |
3.6 |
2.1 |
-2.7 |
27.1 |
1.1 |
0.7 |
0.0 |
41.8 |
19.1 |
Surge Energy |
222 |
468 |
2.1 |
1.3 |
4.3 |
2.5 |
1.7 |
30.4 |
2.9 |
1.7 |
0.0 |
17.0 |
26.8 |
Intermediate E&P >30kboed |
1,044 |
1,539 |
3.1 |
2.4 |
4.1 |
3.2 |
9.5 |
19.7 |
1.4 |
1.1 |
1.1 |
11.3 |
26.7 |
Baytex Energy Corp |
1,032 |
2,283 |
1.9 |
1.7 |
4.0 |
3.5 |
27.7 |
32.4 |
2.5 |
2.2 |
0.0 |
2.3 |
28.7 |
Birchcliff Energy |
1,290 |
1,933 |
3.5 |
3.3 |
4.8 |
4.4 |
14.4 |
16.0 |
1.5 |
1.4 |
0.5 |
2.6 |
24.1 |
Frontera Energy Corp |
541 |
801 |
2.0 |
1.4 |
2.3 |
1.9 |
-1.3 |
33.1 |
0.9 |
0.7 |
0.0 |
6.8 |
21.0 |
Nuvista Energy |
701 |
1,196 |
3.3 |
1.9 |
4.9 |
2.9 |
3.8 |
15.1 |
2.3 |
1.4 |
0.0 |
27.4 |
23.1 |
Paramount Resources |
1,590 |
2,081 |
4.3 |
2.8 |
5.3 |
3.7 |
7.9 |
15.8 |
1.7 |
1.2 |
0.8 |
6.8 |
25.5 |
Parex Resources |
2,013 |
1,643 |
3.5 |
2.9 |
2.4 |
2.2 |
14.8 |
17.7 |
-0.5 |
-0.4 |
0.9 |
12.5 |
34.9 |
Peyto Exploration & Development Corp |
963 |
1,865 |
2.7 |
2.1 |
4.2 |
3.5 |
8.6 |
17.1 |
2.1 |
1.7 |
0.6 |
10.6 |
20.4 |
Tamarack Valley Energy |
802 |
1,217 |
2.8 |
2.1 |
4.5 |
3.0 |
13.2 |
25.2 |
0.6 |
0.4 |
0.0 |
20.8 |
36.0 |
Large E&P >100kboed |
9,741 |
13,805 |
2.9 |
2.7 |
4.3 |
3.7 |
16.9 |
20.3 |
1.1 |
1.0 |
2.3 |
6.4 |
29.2 |
ARC Resources |
5,330 |
7,630 |
2.8 |
2.6 |
4.7 |
3.7 |
15.0 |
17.0 |
0.4 |
0.3 |
2.7 |
15.2 |
25.6 |
Canadian Natural Resources |
39,918 |
55,138 |
4.0 |
3.8 |
4.8 |
4.7 |
16.7 |
15.9 |
1.5 |
1.5 |
4.4 |
2.4 |
44.4 |
Crescent Point Energy Corp |
1,985 |
4,039 |
1.7 |
1.5 |
3.4 |
3.0 |
24.9 |
29.0 |
1.6 |
1.4 |
0.2 |
-0.9 |
30.4 |
Enerplus Corp |
1,509 |
2,402 |
2.3 |
1.9 |
3.9 |
3.1 |
13.9 |
25.9 |
0.5 |
0.4 |
2.0 |
6.4 |
21.3 |
Ovintiv |
7,318 |
12,920 |
2.3 |
2.1 |
4.0 |
3.4 |
19.8 |
20.7 |
2.1 |
1.8 |
1.6 |
-2.9 |
24.1 |
Tourmaline Oil Corp |
9,446 |
10,749 |
4.3 |
4.1 |
4.9 |
4.5 |
10.5 |
13.8 |
0.6 |
0.6 |
1.8 |
13.4 |
24.5 |
Whitecap Resources |
2,680 |
3,757 |
3.1 |
2.6 |
4.3 |
3.4 |
17.8 |
19.8 |
1.1 |
0.8 |
3.5 |
11.0 |
33.9 |
US |
11,094 |
15,553 |
3.9 |
3.3 |
5.1 |
4.2 |
14.2 |
19.8 |
1.6 |
1.3 |
1.4 |
10.9 |
42.6 |
RoW |
3,175 |
4,765 |
2.8 |
2.8 |
3.4 |
3.2 |
17.0 |
24.8 |
1.3 |
1.2 |
2.6 |
9.6 |
73.7 |
Average |
6,505 |
9,196 |
3.3 |
2.8 |
4.4 |
3.6 |
13.1 |
22.4 |
1.4 |
1.2 |
1.5 |
12.1 |
40.3 |
Source: Edison Investment Research, Refinitiv. Note: Prices as at 8 September 2021.
Exhibit 14: Financial summary
|
US$m |
2019 |
2020 |
2021e |
2022e |
|
Year-end December |
IFRS |
IFRS |
IFRS |
IFRS |
||
PROFIT & LOSS |
||||||
Revenue |
219.5 |
246.8 |
237.0 |
287.9 |
||
Cost of sales (opex) |
(17.1) |
(15.6) |
(16.4) |
(19.3) |
||
Gross profit |
202.4 |
231.2 |
220.6 |
268.6 |
||
General & admin |
(29.0) |
(26.8) |
(27.5) |
(28.2) |
||
Share based payments |
(7.9) |
(5.9) |
(6.1) |
(6.2) |
||
Exploration expense |
(3.0) |
- |
- |
- |
||
EBITDA |
162.8 |
184.6 |
193.1 |
240.4 |
||
Depreciation |
(54.3) |
(64.5) |
(67.0) |
(77.3) |
||
Operating Profit (before amort. and except.) |
97.6 |
110.9 |
120.0 |
156.9 |
||
Intangible amortisation |
- |
- |
- |
- |
||
Exceptionals |
- |
- |
- |
- |
||
Other |
- |
- |
- |
- |
||
EBIT |
97.6 |
110.9 |
120.0 |
156.9 |
||
Net interest |
(32.9) |
(31.0) |
(31.1) |
(31.0) |
||
Profit Before Tax (norm) |
64.7 |
79.8 |
88.9 |
125.9 |
||
Profit Before Tax (FRS 3) |
64.7 |
79.8 |
88.9 |
125.9 |
||
Tax |
(30.5) |
(82.1) |
(32.3) |
(40.2) |
||
Profit After Tax (norm) |
34.2 |
(2.3) |
56.7 |
85.8 |
||
Profit After Tax (FRS 3) |
34.2 |
(2.3) |
56.7 |
85.8 |
||
Average Number of Shares Outstanding (m) |
178.3 |
180.6 |
179.0 |
178.5 |
||
EPS - normalised (c) |
19.21 |
(1.27) |
31.68 |
48.05 |
||
EPS - normalised fully diluted (c) |
19.21 |
(1.27) |
31.68 |
48.05 |
||
EPS - (IFRS) (US$) |
0.19 |
(0.01) |
0.32 |
0.48 |
||
Dividend per share (c) |
0.05 |
0.21 |
0.20 |
0.20 |
||
Gross margin (%) |
92.19 |
93.70 |
93.10 |
93.28 |
||
EBITDA margin (%) |
92.19 |
93.70 |
93.10 |
93.28 |
||
Operating margin (before GW and except.) (%) |
44.48 |
44.92 |
50.65 |
54.50 |
||
BALANCE SHEET |
||||||
Non-current assets |
620.8 |
596.3 |
677.4 |
770.9 |
||
Intangible assets |
53.9 |
62.8 |
153.3 |
257.7 |
||
Tangible assets |
506.1 |
524.8 |
515.4 |
504.5 |
||
Investments |
60.8 |
8.7 |
8.7 |
8.7 |
||
Current assets |
133.3 |
153.5 |
92.3 |
68.1 |
||
Stocks |
- |
- |
- |
- |
||
Debtors |
69.6 |
70.7 |
70.7 |
70.7 |
||
Cash |
41.2 |
68.3 |
7.1 |
(17.1) |
||
Other/ restricted cash |
22.4 |
14.5 |
14.5 |
14.5 |
||
Current liabilities |
(97.8) |
(92.6) |
(92.6) |
(92.6) |
||
Creditors |
(89.6) |
(85.4) |
(85.4) |
(85.4) |
||
Short-term borrowings |
(8.2) |
(7.2) |
(7.2) |
(7.2) |
||
Long-term liabilities |
(413.5) |
(449.8) |
(437.8) |
(443.1) |
||
Long-term borrowings |
(333.4) |
(359.9) |
(347.9) |
(353.3) |
||
Other long-term liabilities (inc. decomm.) |
(80.1) |
(89.9) |
(89.9) |
(89.9) |
||
Net assets |
242.7 |
207.4 |
239.3 |
303.3 |
||
CASH FLOW |
||||||
Operating cash flow |
108.4 |
152.3 |
161.9 |
200.3 |
||
Capex inc acquisitions |
(84.3) |
(89.0) |
(148.2) |
(170.8) |
||
Financing expenses |
(29.5) |
(28.7) |
(32.1) |
(31.1) |
||
Equity issued |
2.1 |
(12.6) |
(2.8) |
- |
||
Dividends |
(7.1) |
(20.6) |
(28.0) |
(28.0) |
||
Net cash flow |
(10.4) |
1.5 |
(49.2) |
(29.5) |
||
Opening net debt/(cash) |
288.1 |
300.3 |
298.9 |
348.0 |
||
HP finance leases initiated |
- |
- |
- |
- |
||
Other |
(1.9) |
0.0 |
- |
- |
||
Closing net debt/(cash) |
300.3 |
298.9 |
348.0 |
377.6 |
Source: Canacol, Edison Investment Research estimates
|
|
Research: Real Estate
With the Russian economy recovering to pre-pandemic levels and e commerce activity continuing its strong pace of growth, the Russian warehouse market, in which Raven Property Group is a leading long-term investor, is performing strongly. Low vacancy, a lack of new supply and increased construction costs are driving accelerated rental growth, and this is supporting capital values, despite a significant rise in interest rates.