Last close As at 05/08/2026
EUR277.40
— 0.00 (0.00%)
Market capitalisation
—
Research: TMT
Esker reported another period of strong revenue and profit growth while continuing to invest in product development, consulting and sales & marketing resource. This policy of ongoing investment has fuelled double-digit revenue growth, 80% of which is recurring, over the last five years and supports the company’s premium rating. Progress towards the company’s stretching 20% revenue growth target should support further upside to the share price.
Esker |
Setting its sights higher |
H119 results |
Software & comp services |
19 September 2019 |
Share price performance
Business description
Next events
Analyst
Esker is a research client of Edison Investment Research Limited |
|||||||||||||||||||||||||||||||||||||||||||||||||||
Esker reported another period of strong revenue and profit growth while continuing to invest in product development, consulting and sales & marketing resource. This policy of ongoing investment has fuelled double-digit revenue growth, 80% of which is recurring, over the last five years and supports the company’s premium rating. Progress towards the company’s stretching 20% revenue growth target should support further upside to the share price.
Year end |
Revenue (€m) |
PBT* |
Dil. EPS* |
DPS |
P/E |
Yield |
12/17 |
76.1 |
10.7 |
1.32 |
0.32 |
61.5 |
0.4 |
12/18 |
86.9 |
12.2 |
1.64 |
0.41 |
49.4 |
0.5 |
12/19e |
100.6 |
14.4 |
1.74 |
0.45 |
46.6 |
0.6 |
12/20e |
114.6 |
18.0 |
2.12 |
0.50 |
38.3 |
0.6 |
Note: *PBT and EPS are normalised, excluding amortisation of acquired intangibles, exceptional items and share-based payments.
Strong revenue and profit growth in H119
Esker reported 18% revenue growth in H119 (15% in constant currency) and operating profit growth of 9%, resulting in an operating margin of 14.4%. Its SaaS-related business (89% of H1 revenues) grew 19% on a constant currency basis. The company continued to invest in headcount during H1, with the majority of new hires in consulting and sales & marketing. We have revised our forecasts to reflect H1 costs, higher capex and a more conservative tax rate.
Setting more ambitious growth targets
For the last few years, Esker has targeted double-digit revenue growth and 15% operating margins, investing any profits above this level back into the business. It has now raised its revenue growth target to 20%. This partly reflects the diminishing importance of the non-SaaS business (only 11% of H1 revenues vs 23% in FY16) and partly the company’s strategy to build a network of channel partners. We view the revenue growth target as a stretch target and forecast growth closer to 15% over the next two years. However, we view successful execution of the partner strategy as a key potential source of upside to our forecasts.
Valuation: Profitable growth supports premium rating
Esker’s stock has gained 23% over the last year, and trades at a premium to French small-cap software peers and global DPA software providers. Compared to companies with a similar SaaS business model, however, Esker trades at a discount on all multiples. As the company accelerates revenue growth towards its 20% target, we would expect the shares to re-rate. We note that Esker has a strong balance sheet with €15m net cash at the end of H119, representing ample funds to support growth via internal investment or selective M&A.
Investment summary
Company description: Document automation specialist
Esker is a document process automation (DPA) software developer, specialising in moving business processes from paper-based to digital. Its software is used to automate the purchase-to-pay and order-to-cash cycles. The company principally operates a SaaS delivery model and the majority of revenues are generated from customers using its on-demand solutions. Esker’s revenues are well spread geographically, with 58% from Europe, 37% from North America and the remainder from Australia and Asia. In recent years, the company has made small bolt-on acquisitions and we believe it would consider further acquisitions if they added technology expertise or geographic presence at a reasonable price. The company generates organic growth from a combination of winning new customers globally and deepening existing relationships. To accelerate the pace at which it can sign up and on-board customers, it is developing a network of partners to undertake implementation work and resell Esker software.
Financials: 20% revenue growth, 15% operating margin targets
Esker has raised its group revenue growth target from double-digit to 20% and maintained its 15% operating margin target. While SaaS-related revenue growth is at this level already, the rate of decline of legacy product and on-premise licence revenues (which made up 10% of H1 revenues) will influence the group target. In H119 the company made progress towards these targets, with constant currency revenue growth of 15% and an operating margin of 14.4%. We have made small changes to our estimates and forecast net cash to increase to €26.3m by the end of FY20.
Valuation: Reflects SaaS business model
The stock has gained 23% over the last year and on a P/E basis continues to trade at a premium to both a group of listed global DPA software companies and to French-listed small-cap software companies, in our view justified by revenue growth and operating margins at the upper end of both groups. Compared to US SaaS companies, which have a similar business model to Esker, the company trades at a material discount on all valuation metrics. We note that on average they are growing faster than Esker, although they are generating lower operating margins than Esker. The typical growth path for US SaaS companies involves investing heavily in sales and marketing to gain market share as fast as possible, with little focus on achieving profitability in the short term. Esker’s model sits somewhere between low-growth, high-profitability on-premise software businesses and US SaaS companies’ high growth operating model, aiming for a happy medium of double-digit revenue growth while achieving mid-teen operating margins. Esker has the added advantage of a strong balance sheet that does not require additional funding to support growth.
Sensitivities: Currency, on-demand transition, competition
Our forecasts and the Esker share price are sensitive to the following factors. Currency: Esker is exposed to the US$/€ exchange rate. Competition: Esker competes with well-established, well-funded software companies and will need to maintain its technology to continue this. Success of channel partner strategy: revenue growth and headcount needs will depend on the rate at which partners are able to resell and/or implement Esker software. Rate of decline of on-premise licensing and legacy business: these businesses are very profitable maintenance-revenue generators. The rate at which these businesses decline will affect growth and profitability. Reliance on datacentre providers: Esker leases datacentre capacity for its on-demand products. Changes in the availability and pricing of capacity will have an impact on Esker’s profitability.
Company description: Automating business processes
Esker is a document process automation (DPA) software developer, specialising in moving business processes from paper-based to digital. The company made the transition to the SaaS delivery model earlier than many peers, and now the majority of revenues are generated from customers using its on-demand solutions.
Background
Esker was founded in 1985 by Jean-Michel Bérard, the current CEO. Management was originally focused on software consulting and developed its first host access product in 1989. The company listed on the Nouveau Marché in 1997. From 1998 to 2000 the company made a series of acquisitions in the US host access and fax server markets. Esker launched the DeliveryWare platform in 2000, Mail on Demand in 2003, Esker on Demand (an automated on-demand mail and fax service) in 2004 and FlyDoc in 2006. The current SaaS products for accounts payable and accounts receivable were launched in 2009. The company’s listing was transferred from Euronext C to Euronext Alternext in 2010 (since renamed Euronext Growth). The company made bolt-on acquisitions: TermSync and CalvaEDI in 2015 and e-integration in 2017. Esker’s revenues are well spread geographically, with 58% from Europe, 37% from North America, and the remainder from Australia and Asia.
Growth strategy: Broaden functionality, add partners
Esker’s DPA SaaS software supports order-to-cash and purchase-to-pay business processes. The company is working to broaden the functionality of its product suite and ultimately join up the processes to create a business collaboration network. It is also exploring the opportunities that such a network could open up in the supply chain finance market. As well as increasing headcount to support organic growth, management would consider acquiring complementary businesses. Excluding acquisitions, growth in recent years has come from a combination of adding new customers and existing customers adding new processes and/or pushing higher volumes through Esker’s platform. To accelerate growth, the company is building a network of partners to undertake implementation work and resell Esker software.
Well established management team headed up by founder
As described above, the company’s CEO, Jean-Michel Bérard, founded the company in 1985. Emmanuel Olivier joined the company in 1999, was originally the CFO and became COO in 2003. He previously worked at Ernst & Young in France and the US for seven years. The CEO’s brother, Jean-Jacques Bérard, is the EVP of R&D, having joined Esker in 1995. Other members of the management board include Eric Bussy (director of marketing and product management), Steve Smith (COO, Americas), Eric Thomas (VP business development) and Anne Grand-Clément (global director of professional services and technical support).
DPA software
Esker has developed a unified cloud platform to automate order-to-cash and purchase-to-pay cash cycles. Its DPA software operates in five areas: procurement, accounts payable, accounts receivable, sales order processing and document delivery. These can be combined to fulfil the cash cycles as per Exhibit 1: order-to-cash to fulfil customer orders and collect payment; and purchase-to-pay to source, order and pay for goods and services.
|
Exhibit 1: Esker’s positioning |
|
|
Source: Esker |
Features of the software include:
■
multi-tenant cloud platform;
■
single solution with common interface to access all functionality;
■
mobile capabilities;
■
ERP integrations;
■
artificial intelligence (AI) functionality; and
■
ongoing development via agile methodology.
Automating invoice and order delivery and receipt
Esker’s DPA software operates in the following way. For receipt of documents (eg sales orders, supplier invoices), the software converts paper documentation into digital format, and populates standard templates with the data from the digital document. The software can also extract data from other sources such as emails, email attachments and faxes. Esker has used machine learning for many years to train the software: if there is any doubt over the accuracy of the data, the user compares the original document to the digitised version and corrects it as necessary helping the software to learn. The standardised data can then be fed into the customer’s ERP system and processed and viewed by the relevant people throughout the organisation before being archived automatically. For sending documents, the software generates orders or invoices in the format required, and if paper documents or fax services are required, Esker’s document delivery service can be used.
The software has certified integrations with the main ERP vendors, including SAP (including S/4HANA), Cegid, Oracle’s E-Business Suite, JD Edwards EnterpriseOne, Microsoft Dynamics NAV, Sage, Infor and NetSuite.
The software provides a dashboard showing relevant KPIs and data analytics to support performance monitoring. For accounts receivable, the software offers self-service online payment options such as credit cards, ACH, SEPA and direct debit, or can be integrated with the customer’s preferred payment processor. The software also manages cash allocation automatically.
The business helps buyers and suppliers to collaborate by providing a portal for each process that they can both access, with features such as invoice status and chat. More recently, using AI it has developed a shared database of document recognition models for orders and invoices in pdf format. The longer-term goal is to connect these portals together to create a networking platform that would allow customers and suppliers to interact securely and could be used for direct exchange of purchase orders and invoices, payment of invoices, early payment discounting, dispute resolution and data clarification.
Document delivery the final step in the process
Document delivery services enable customers to send business documents via cloud fax or mail centres directly from their desktop or enterprise applications. Esker services on-demand document delivery through its fax servers located in France, the US and Australia and mail production centres located in France, Belgium, the UK, the US, Australia, Spain and Singapore.
Demand drivers: Efficiency, cash management, regulation
The software improves productivity by accelerating the cash conversion cycle, reducing errors, enabling faster processing, improving process visibility and improving customer service. It has the added benefit of reducing paper and paper-related costs.
The software also meets government legislation around e-invoicing. In Europe, the EU has mandated that paper and digital invoices should be treated equally and lays out ways that documents can be authenticated. EU member states have been subject to the 2014/55/EU directive since April 2019: this specifies that businesses selling to government entities must use e-invoicing that is based on specified interoperability standards. This should increase demand for e-invoicing solutions. In Latin America, e-invoicing is government-mandated to ensure tax compliance and collection.
SaaS-based software driving growth
Exhibit 2: DPA product range
Product |
Details |
Esker on Demand |
Hosted service, charged for monthly on basis of volumes. Also charge service revenues. |
DeliveryWare platform |
On-premise software plus maintenance and services. |
FlyDoc |
Simpler version of Esker on Demand, charged for in the same way; targeted at SMEs and individuals. Represents an electronic post office (automates fax sending/receipt, mail sending, archiving). Only in France and the US. |
Product |
Esker on Demand |
DeliveryWare platform |
FlyDoc |
Details |
Hosted service, charged for monthly on basis of volumes. Also charge service revenues. |
On-premise software plus maintenance and services. |
Simpler version of Esker on Demand, charged for in the same way; targeted at SMEs and individuals. Represents an electronic post office (automates fax sending/receipt, mail sending, archiving). Only in France and the US. |
Source: Esker
Esker on Demand is Esker’s main product. This multi-tenant, SaaS solution was originally developed by Esker in 2004, ahead of many other software companies’ entry into the SaaS market. It started to gain traction from 2009 as customers were attracted by the lack of upfront investment and the usage-based payment mechanism. Esker’s longest-standing product is DeliveryWare, an on-premise solution. Typically, new business is for Esker on Demand, although some customers prefer to use the on-premise solution for security reasons. The company has more than 5,000 SaaS customers and 600,000 SaaS users.
Esker upgrades the Esker on Demand software every 15 days. Every three years, Esker takes the previous SaaS upgrades and incorporates them into one large upgrade of the DeliveryWare software. The software is hosted out of four data centres: two leased by Esker (France, US) and two Microsoft Azure facilities (Netherlands, Singapore).
Product development
The table below shows the development of the platform in terms of functionality.
Exhibit 3: Product development roadmap
Media types |
Document types |
Processes |
People |
Finance |
|||||
EDI |
✓ |
Purchase orders |
✓ |
Order processing |
✓ |
Portals |
✓ |
Payment |
✓ |
Fax |
✓ |
Customer invoices |
✓ |
Accounts receivable |
✓ |
Collaboration |
Dynamic discounting |
||
✓ |
Supplier invoices |
✓ |
Accounts payable |
✓ |
Mobile app |
✓ |
Reverse factoring |
||
✓ |
Purchasing |
✓ |
Business network |
Factoring |
|||||
SMS |
✓ |
||||||||
Source: Esker, Edison Investment Research. Key: ✓ = available; = under development/partially available.
We understand that the company’s main priorities for product development include:
■
Employing artificial intelligence to increase automation. Esker has used machine learning for many years to improve the accuracy of its software in automating invoice processing. It also incorporates robotic process automation into its software in selected areas, for example to automate invoice submission to a customer’s accounts payable portal or to retrieve sales orders from portals and input them into a customer’s ERP system. It is applying deep learning, which requires access to a very high volume of documents, to a number of use cases. For example, it is using deep learning to classify documents received in an email inbox. The software needs to be able not only to figure out which department a document is intended for, but also to reject documents that are spam. The goal is to achieve accuracy on a par with a human – this then frees up the software user to focus their attention on exceptions rather than routine email sorting. Other AI-based enhancements to the platform include auto-splitting of batch invoices, semantic recognition of purchase orders and anomaly detection. The company is developing new enhancements in the area of fraud detection, semantic recognition of other documents and non-OCR1 recognition of documents.
Optical Character Recognition
■
Extending the functionality of the P2P solution: Esker is increasingly adding functionality to its purchase-to-pay offering, through a combination of in-house development and technology partnerships, and is focusing its efforts on the functionality demanded by customers. One area of demand is catalogue management: Esker already offers ‘punch out’ functionality, which allows purchasing customers to access online suppliers such as Dell and Amazon Business from within the Esker e-procurement application and place orders with those suppliers. The company continues to add features in this area. Contract management functionality is also being developed so that invoices and purchase orders can be linked to the related contract.
■
Supply chain finance: as an interesting add-on to its existing software business, Esker has evaluated the supply chain financing market to assess the best way to participate. Several invoice networks are active in this space, for example Taulia and Tungsten, offering invoice factoring, reverse factoring and/or dynamic discounting. Rather than offering finance itself (not a core skill of the company), Esker has entered the market via a partnership. It has a supply chain finance initiative in Singapore in partnership with Jing King Tech Group (JK Tech). JK Tech is a provider of payment solutions, transaction security and services to the banking industry. The joint venture connects Esker’s e-invoicing platform to a group of banking partners, including UOB, Singapore’s second largest bank. Esker and JK Tech market NEMO, a cloud-based supply chain finance solution to banking and financing partners in China and South-East Asia. Having visibility into approved invoices gives finance providers a more efficient way of assessing the credit-worthiness of customers seeking finance. If this proves popular, Esker would look to extend this type of offering in other countries.
Partnering to access niche technology
As well as in-house product development and acquisitions of companies with relevant technology, Esker has started partnering to provide access to technology that augments its products. Last year it partnered with Rimilia, a UK-based company with a SaaS-based product that provides automatic matching of cash receipts to invoices, for Esker’s order-to-cash solution. The company recently made a 40% investment in the initial seed finance round for a US start-up called B/2BNOW; B/2BNOW provides EDI solutions for SAP S/4HANA Cloud ERP systems. Steve Smith, COO of Esker US, has joined the board of B/2BNOW.
Sales strategy: Mainly direct, adding channel partners
Esker has a direct sales presence in Europe (France, Germany, Italy, Spain and the UK), the US and Asia-Pacific (Australia, Hong Kong, Malaysia and Singapore). Esker has sales representatives in Miami (to target South America, in particular Argentina, Brazil and Colombia), Brussels (to target European-headquartered US companies) and Montreal. Esker also sells its software to several companies on a white-label basis.
Land and expand strategy
The salesforce tends to target those responsible for business processes – in most cases this will be the finance department, although sometimes it is customer services. The company also works with the customer’s IT department, but this is mainly to work on integrating the software rather than to sell to. As the implementation process takes time and can be disruptive, most customers tend to select Esker for one process initially. Esker may then benefit from growth within that process, eg more departments, more geographies. Some customers then go on to use Esker for additional processes. In H119, the company created a customer experience team to strengthen the relationship with customers and to minimise churn.
Signing up channel partners
To accelerate the pace at which it can sign up and on-board new customers, Esker is starting to build a network of channel partners. These partners are providing consulting and implementation services, and in some cases are reselling Esker’s technology. In 2018, the company signed a partnership with Optima ECM Consulting in the US, systems integrator Viveris in France and IBIZ Consulting Services in Asia.
To add capability in Asia, in February, the company announced that Fuji Xerox would market Esker’s accounts payable automation solution as part of its offering to optimise accounts payable management processes in Japan, and soon Australia, Hong Kong and Singapore. Esker and Fuji Xerox already work together in New Zealand where customers in the construction, retail, business and education sectors have signed up to use Esker’s accounts payable solution. Fuji Xerox is a 75/25 joint venture between FUJIFILM and Xerox; its direct salesforce covers Japan and the Asia-Pacific region including China. Esker generated 4% of its revenues in Asia-Pacific/Australia in FY18. As the agreement also includes Fuji Xerox providing consulting, implementation and support to customers that choose to buy the software, this agreement could accelerate Esker’s penetration of this region without Esker incurring substantial sales and consulting costs.
In June, the company signed a reseller agreement with KPMG Netherlands. KPMG will market Esker’s cloud-based accounts payable solution as part of its RPA and Finance Transformation offering.
The company noted in its H119 results that it closed its first deal with KPMG Netherlands in H1 and has a number of deals in the pipeline that it hopes to close in H2. It expects the Fuji Xerox relationship to have a material impact on revenues from FY20.
Joint venture with Neopost targeting SMEs expands geographically
Esker sold its software on a white-label basis through Neopost in France for several years and in 2015 entered into a joint venture (JV) with Neopost to expand the scope of this agreement. The JV (owned 70% Neopost, 30% Esker) is focused on selling Esker’s software, marketed as Neotouch, to SMEs in France, the US and the UK. Esker’s direct salesforce tends not to target the SME market. In FY18, Esker reported a €317k contribution from its share in the joint venture, and the joint venture generated c 7% of group sales.
Competitive positioning: Esker competes by process
Esker competes against a different group of companies for each business process and by geography. As well as specialist DPA software companies, the company also sees competition from business process outsourcers such as Accenture and Xerox.
Esker has the advantage that its software can be used across all processes, reducing the number of software suppliers a company deals with and simplifying the implementation process. More than 5,000 companies globally use Esker software, including Cap Gemini, Experian, GE Healthcare, Heineken, Microsoft, Samsung and Siemens. Esker has more than a decade’s experience in SaaS delivery and has achieved various SaaS certifications such as SSAE16, ISAE3402 and ISO27001, providing a level of confidence regarding business continuity and data security.
Accounts payable is the most competitive area – when Esker wins business it tends to be for customers that have decided to move from manual to automated processing, rather than winning business from an existing supplier (although this occasionally happens). Accounts receivable has historically been Esker’s strongest area; the customer owns the process so the document format is set in-house and therefore data recognition is more straightforward. Due to European legislation around electronic signatures, demand for automated accounts receivable processing is growing, as companies move from paper to digital invoices. Esker sometimes replaces mail houses in this market. The most complex market from a technical perspective is sales order processing. This is because end-customers send orders to Esker’s customers in many different non-standard formats such as faxes, emails or within email attachments. This market has the fewest suppliers and Esker has a very high win rate. The newest area for Esker is purchasing (launched in 2014), which contributes less than 1% of revenues. This is a sub-set of the procurement software market, which is dominated by cloud provider Coupa. Esker’s purchasing solution covers the procurement process from purchase requisition to invoice payment authorisation, but over time we expect the company to extend the functionality of the solution to encompass the earlier part of the procurement process. Esker typically sells this solution to existing accounts payable customers to support the full purchase-to-payment cycle.
Exhibit 4: Competitive environment – DPA software suppliers
Company |
Accounts receivable |
Sales order processing |
Accounts payable |
Purchasing |
Esker |
x |
x |
x |
x |
Basware |
x |
x |
x |
|
Billtrust |
x |
|||
Conexiom |
x |
|||
Coupa |
x |
|||
Determine |
x |
|||
HighRadius |
x |
|||
ITESOFT |
x |
|||
Kofax* |
x |
|||
OmPrompt |
x |
|||
OpenText |
x |
x |
||
SAP (Ariba) |
x |
|||
Sidetrade |
x |
|||
Tradeshift |
x |
x |
||
Tungsten (OB10) |
x |
|||
Yooz |
x |
Source: Esker, Edison Investment Research. Note: *Includes ReadSoft.
Exhibit 4 shows the most common competitors for each process. Competition tends to be country specific; for example, Billtrust for accounts receivable in the US, ITESOFT for accounts payable in France. Global competitors include Basware, Kofax, OpenText and SAP.
Document delivery has a different group of mail-focused competitors, including j2 Global, Docapost, and Maileva (both subsidiaries of Le Groupe La Poste) and OpenText.
Supplier/buyer networks present an opportunity for Esker
Many customers use Esker’s software to enable them to join supplier networks such as Ariba or OB10. These networks usually require e-invoicing and Esker’s software enables them to produce invoices according to the requirements of the networks. In other cases such as Taulia, the networks rely on invoices that are approved for payment to provide supply chain financing. As Esker’s software provides dashboards to show this type of information, Esker is able to introduce customers with the necessary volume of approved invoices to the networks.
Legacy Products (4% of FY18 revenues)
Esker’s Legacy Products division includes fax servers and host access products. While the legacy business continues to be supported, the company is not actively chasing new business or developing new products.
■
Fax servers were developed to send the fax directly via a word processing programme, or to receive a fax and send it directly to the recipient’s inbox. Esker Fax works on Windows 2000/2003/XP operating systems and is compatible with electronic messaging systems including IBM Lotus Notes, Microsoft Exchange and SMTP. VSI-Fax is designed for UNIX and Linux operating systems.
■
Host access supplies terminal emulator software that enables users to access mainframes from PCs. Tun PLUS supports access to SCO Linux, Linux, IBM AIX, HP-UX, IBM 390 and IBM AS/400 servers, and SmarTerm supports access to Digital (Vax Open VMS), Data General and IBM servers. Esker mainly generates maintenance revenues from this business, although occasionally it wins new business as the number of host access suppliers reduces.
Sensitivities
Our forecasts and the Esker share price will be sensitive to the following factors:
■
Currency: while Esker has some natural hedging, the R&D and central function teams are based in France, resulting in exposure to the US dollar-euro exchange rate. If the US dollar weakens against the euro from the current level, it would have a negative effect on revenues and profitability.
■
Competition: Esker competes with well-established, well-funded software companies and will need to maintain its technology to compete.
■
Pace of adoption of SaaS solutions: as customers move to on-demand software, Esker is seeing a decline in on-premise licences (which are recognised when the contract is signed) in favour of subscription-based revenues (which are recognised over the life of the contract). The pace at which customers make this move will influence revenue growth and profitability. The influence of on-premise licensing is reducing: in FY15 it made up 19% of revenues but had declined to 7% by H119.
■
Success of channel partner strategy: the rate at which the company is able to sign up channel partners, the pace at which those partners are able to resell Esker solutions and the ability of partners to successfully implement Esker solutions for clients will influence revenue growth and headcount requirements.
■
Rate of decline of legacy businesses: both the host access and fax server businesses are very profitable maintenance-revenue generators. The rate at which these businesses decline will have an impact on profitability, although as these businesses make up a decreasing proportion of revenues (only 4% in H119), the effect is reducing.
■
Reliance on datacentre providers: Esker leases datacentre capacity for its on-demand products. Changes in the availability and pricing of capacity will influence profitability.
Financials
Revenues: SaaS business is the driver
Exhibit 5: Revenues by business line and by type
€m |
FY16 |
FY17 |
Growth |
FY18 |
Growth |
FY19e |
Growth |
FY20e |
Growth |
SaaS-related DPA revenues |
50.9 |
64.4 |
26.5% |
75.8 |
17.7% |
90.6 |
19.6% |
105.8 |
16.8% |
License-based DPA revenues |
10.7 |
8.1 |
(24.3%) |
7.8 |
(3.7%) |
6.6 |
(14.8%) |
6.2 |
(6.9%) |
Legacy products |
4.4 |
3.6 |
(18.2%) |
3.3 |
(8.3%) |
3.4 |
2.4% |
2.6 |
(23.1%) |
Total |
66.0 |
76.1 |
15.3% |
86.9 |
14.2% |
100.6 |
15.9% |
114.6 |
13.9% |
SaaS |
43.4 |
51.4 |
18.5% |
60.5 |
17.7% |
72.8 |
20.2% |
85.9 |
18.0% |
Consulting |
10.6 |
14.4 |
35.0% |
16.6 |
15.7% |
18.9 |
13.5% |
20.7 |
10.0% |
Upgrades & maintenance |
8.6 |
8.0 |
(7.0%) |
7.4 |
(8.3%) |
6.9 |
(7.0%) |
6.3 |
(7.5%) |
New licenses |
2.6 |
1.6 |
(36.7%) |
1.9 |
15.4% |
1.7 |
(8.0%) |
1.3 |
(25.0%) |
Fax card sales/hardware |
0.7 |
0.6 |
(16.8%) |
0.5 |
(22.3%) |
0.4 |
(10.0%) |
0.3 |
(20.0%) |
Total |
66.0 |
76.1 |
86.9 |
100.6 |
114.6 |
Source: Esker, Edison Investment Research
Esker reports revenues in two ways:
■
split by business line: DPA (split out as SaaS and licence-based) and Legacy Products, on a quarterly basis; and
■
split by type of revenue: SaaS, maintenance fees, licence sales, hardware and consulting, on a half-yearly basis.
SaaS revenues are generated on a per-transaction basis from Esker on Demand and FlyDoc customers. Licence and maintenance fees are generated from DeliveryWare on-premise licence sales and the fax server and host access businesses. Hardware sales are generated by the fax server business. Consulting revenues are generated from on-premise and on-demand DPA business. Older DPA subscription sales were structured on a traffic-only basis, with consulting revenues charged for the initial integration of the software. For the last few years, Esker has sold on a hybrid subscription model that guarantees minimum monthly revenues plus transaction-based revenues, reducing Esker’s dependence on the speed at which a customer implements the software. On-demand contracts are typically signed for a minimum of 12 months, and most commonly are for three years. See Exhibit 5 for historical and forecast divisional performance.
SaaS-related revenues (which include SaaS and consulting revenues) have shown significant growth in recent years. On a like-for-like, constant currency basis, these grew 20% in FY16, 21% in FY17, 20% in FY18 and a further 19% in H119 (SaaS +21%, consulting +7%). Management noted that growth in consulting revenues in H1 was held back by the number of consulting staff involved in training new hires or channel partners but that growth should rebound in H2. Licence-based DPA revenues (licences, consulting and maintenance revenues) declined 3% in FY16, 23% in FY17, 1% in FY18 and 16% in H119, now making up only 7% of revenues.
Targeting 20% revenue growth
The company is targeting 20% growth for group revenues. As we expect a continuing decline in licence-based and legacy product revenues, this implies that SaaS-related revenues would need to accelerate above 20% to achieve the targeted growth rate at the group level. While our group revenue forecasts show lower growth than the 20% target, we see potential upside from the growing number of channel partnerships.
High level of recurring revenue provides good visibility
In H119, recurring revenues2 made up 80% of the total, versus 78% in FY17 and FY18. Esker has a strong record of retaining customers – management estimates that churn is less than 1% per year. As each new customer comes on board, this adds another layer of recurring revenues. In H119, Esker won orders worth €11.4m (+52% y-o-y); this is the amount of revenue the company is contracted to earn over the (usually) three-year life of the contract, and does not include variable per document fees, which can make up the same amount again over the three years.
SaaS plus maintenance revenues.
Review of H119 results: Close to 15% margin target
Exhibit 6: Half-year results highlights
€m |
H119 |
H118 |
Y-o-y |
Revenues |
50.1 |
42.4 |
18.2% |
EBITDA |
10.9 |
9.8 |
11.1% |
EBITDA margin |
21.7% |
23.1% |
-1.39% |
Reported operating profit |
7.2 |
6.6 |
8.7% |
Operating margin |
14.4% |
15.7% |
-1.25% |
Reported net income |
5.5 |
4.9 |
11.0% |
Basic EPS (€) |
1.02 |
0.93 |
9.7% |
Diluted EPS (€) |
1.00 |
0.85 |
17.6% |
Net cash |
15.0 |
11.2 |
34.4% |
Source: Esker
Esker reported 18% y-o-y growth in revenues in H119 (15% on a constant currency basis). EBITDA increased 11% y-o-y, as operating costs increased at a faster rate than revenues. Staff costs increased 19% y-o-y, as the company increased headcount by 60 from the end of FY18 to the end of H119 (+17% y-o-y), with the majority of new heads in consulting and sales and marketing. Purchases and external costs increased 20% y-o-y, reflecting the higher headcount and higher marketing spend. Depreciation and amortisation increased from €3.2m in H118 to €3.7m in H119 reflecting increasing amortisation of capitalised development costs and a higher level of tangible capex in H119. Reported operating profit increased 9% y-o-y, to reach an operating margin of 14.4%. This is close to the company’s operating margin target of 15%.
The JV with Neopost is adding a growing contribution, at €251k in H119 versus €151k in H118 and €67k in H117. The company used an estimated tax rate of 31% for H119; compared to the 25% rate achieved in FY18 this appears conservative.
Strong cash position
The company ended H119 with a net cash position of €15.0m, down from €16.6m at the end of FY18. In H1, the company generated operating cash flow of €6.5m. As well as paying the prior-year dividend of €2.2m, the company paid down €2.2m of debt. Gross cash was €22.2m at period end (including €3m recorded in fixed assets), providing ample funds for acquisitions and investment. We forecast that net cash will increase to €20.8m by the end of FY19 and €26.6m by the end of FY20.
No change to capex strategy
The company invests in tangible fixed assets for its mail centres and offices and capitalises development costs (€5.7m in FY18). In H1, the company also paid c €0.5m to acquire the property in which its Italian business is based. In H1, it capitalised €3.2m of development costs and amortised €2.3m. We expect a gradual increase in both capitalisation and amortisation in FY19 and FY20 reflecting the growing R&D headcount.
Changes to forecasts
We have made small changes to our forecasts. We reflect H119 costs and increase our capex assumptions for both years, based on H1 capex. We have used a 31% tax rate for FY19 and FY20 (up from 28%), although this may prove to be conservative.
Exhibit 7: Changes to estimates
€m |
FY19e old |
FY19e new |
change |
y-o-y |
FY20e old |
FY20e new |
change |
y-o-y |
Revenues |
100.6 |
100.6 |
0.0% |
15.9% |
114.6 |
114.6 |
0.0% |
13.9% |
EBITDA |
21.0 |
20.9 |
(0.4%) |
14.5% |
24.8 |
25.0 |
0.6% |
19.4% |
EBITDA margin |
20.8% |
20.8% |
(0.1%) |
(0.2%) |
21.6% |
21.8% |
0.1% |
1.0% |
Normalised EBIT |
14.0 |
13.7 |
(2.1%) |
14.9% |
17.4 |
17.3 |
(0.6%) |
26.4% |
Normalised EBIT margin |
13.9% |
13.6% |
(0.3%) |
(0.1%) |
15.2% |
15.1% |
(0.1%) |
1.5% |
Reported EBIT |
13.7 |
13.5 |
(1.5%) |
17.4% |
17.1 |
17.0 |
(0.8%) |
25.8% |
Reported EBIT margin |
13.6% |
13.4% |
(0.2%) |
0.2% |
14.9% |
14.8% |
(0.1%) |
1.4% |
Normalised PBT |
14.4 |
14.4 |
0.2% |
18.6% |
17.8 |
18.0 |
1.0% |
24.7% |
Normalised net income |
10.4 |
10.0 |
(4.0%) |
9.1% |
12.8 |
12.4 |
(3.2%) |
24.7% |
Normalised dil. EPS (€) |
1.81 |
1.74 |
(4.0%) |
6.1% |
2.19 |
2.12 |
(3.2%) |
21.6% |
Reported basic EPS (€) |
1.83 |
1.77 |
(3.4%) |
8.6% |
2.23 |
2.15 |
(3.5%) |
21.3% |
Reported diluted EPS (€) |
1.77 |
1.72 |
(3.4%) |
8.5% |
2.15 |
2.08 |
(3.5%) |
21.0% |
Net cash |
23.3 |
20.5 |
(12.1%) |
23.6% |
31.2 |
26.3 |
(15.5%) |
28.5% |
DPS (€) |
0.45 |
0.45 |
0.0% |
9.8% |
0.50 |
0.50 |
0.0% |
11.1% |
Source: Edison Investment Research
Currency impact
With 37% of revenues in the US but a lower proportion of the cost base in US dollars, the company is exposed to changes in the dollar-euro exchange rate. The company noted that the stronger dollar versus the euro in H119 resulted in a €1.2m benefit to reported revenues and a €0.5m boost to reported operating profit. In our cost calculations, we use a rate of $1.13/€ for FY19 and $1.11/€ for FY20. Any weakening of the dollar could have a material negative impact on our forecasts.
Valuation
We have compared Esker’s valuation to a group of listed global DPA software companies and to French-listed small-cap software companies (Exhibit 8). The stock gained 23% over the last year and continues to trade at a premium to both peer group averages on a P/E basis, in our view justified by revenue growth and operating margins at the upper end of both groups.
We note that most companies in both peer groups are not predominantly SaaS companies, whereas Esker has been operating a SaaS business model for more than a decade. The US SaaS companies in Exhibit 9 on average are growing faster than Esker, although they are generating operating margins below the level of Esker. The typical growth path for US SaaS companies involves investing heavily in sales and marketing to gain market share as fast as possible, with little focus on achieving profitability in the short term. Esker’s model sits somewhere between low-growth, high-profitability on-premise software businesses and US SaaS companies’ high-growth operating model, aiming for a happy medium of double-digit revenue growth while achieving mid-teen operating margins. Esker has the added advantage of a strong balance sheet that does not require additional funding to support growth.
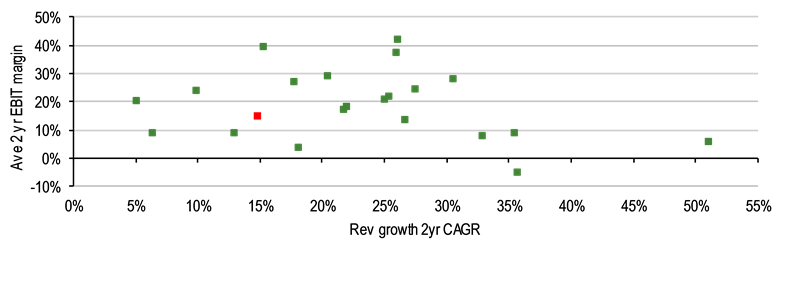
In Exhibit 10, we show how Esker (marked in red) compares to its US SaaS peers when considering average revenue growth and average EBIT margins over the next two years. Exhibits 11 and 12 show how the peer group is trading on a P/E basis compared to revenue forecasts this year and next (we have excluded any companies trading on a P/E above 150 for either year).
Exhibit 8: Peer financial and valuation metrics
Company |
Share price |
Market cap m |
Rev growth |
EBIT margin |
EBITDA margin |
EV/Sales |
P/E |
|||||
CY |
NY |
CY |
NY |
CY |
NY |
CY |
NY |
CY |
NY |
|||
Esker |
€81.0 |
€452 |
15.9% |
13.9% |
13.6% |
15.1% |
20.8% |
21.8% |
4.3 |
3.8 |
46.6 |
38.3 |
Software companies with DPA software offerings |
||||||||||||
Basware |
€20.35 |
€293 |
3.6% |
7.8% |
-10.0% |
0.6% |
2.0% |
10.5% |
2.3 |
2.1 |
N/A |
N/A |
Bottomline |
$41.34 |
€1,813 |
10.1% |
14.4% |
18.6% |
19.5% |
23.7% |
23.7% |
3.7 |
3.2 |
26.3 |
21.9 |
Coupa |
$131.72 |
€8,278 |
42.9% |
28.6% |
3.4% |
6.7% |
7.1% |
10.1% |
22.0 |
17.1 |
829.4 |
339.7 |
ITESoft |
€2.95 |
€18 |
-4.3% |
1.3% |
1.3% |
2.1% |
4.3% |
5.2% |
0.8 |
0.8 |
49.2 |
36.9 |
OpenText |
$54.35 |
€14,675 |
3.6% |
2.7% |
35.6% |
36.2% |
38.7% |
39.2% |
4.3 |
4.2 |
18.8 |
17.9 |
Proactis |
£0.57 |
€54 |
2.4% |
0.0% |
16.6% |
19.1% |
29.0% |
33.6% |
1.9 |
1.9 |
8.1 |
6.9 |
Tungsten Corp |
£0.44 |
€54 |
5.4% |
7.9% |
1.3% |
5.4% |
10.5% |
19.5% |
1.4 |
1.3 |
N/A |
21.1 |
Average |
9.1% |
9.0% |
9.5% |
12.8% |
16.5% |
20.3% |
5.2 |
4.4 |
25.6* |
20.9* |
||
Median |
3.6% |
7.8% |
3.4% |
6.7% |
10.5% |
19.5% |
2.3 |
2.1 |
18.8* |
21.1* |
||
French small-cap software companies |
||||||||||||
Axway Software |
€10.90 |
€226 |
0.5% |
1.1% |
6.5% |
9.2% |
9.8% |
12.5% |
0.9 |
0.9 |
21.0 |
13.9 |
Claranova |
€7.51 |
€296 |
60.8% |
18.4% |
6.5% |
7.3% |
7.0% |
8.3% |
0.6 |
0.5 |
14.8 |
11.0 |
ESI Group |
€32.10 |
€191 |
1.8% |
8.0% |
6.1% |
6.9% |
8.5% |
9.7% |
1.5 |
1.4 |
38.7 |
29.1 |
Lectra |
€17.84 |
€568 |
-1.1% |
5.1% |
12.8% |
13.5% |
17.3% |
17.7% |
1.7 |
1.6 |
20.7 |
18.8 |
Linedata Service |
€31.30 |
€225 |
-1.5% |
2.5% |
16.5% |
16.0% |
25.3% |
25.3% |
1.8 |
1.7 |
11.6 |
11.5 |
Sidetrade |
€66.40 |
€93 |
7.6% |
17.0% |
7.7% |
11.2% |
10.8% |
14.5% |
3.4 |
2.9 |
54.0 |
30.9 |
Average |
11.4% |
8.7% |
9.3% |
10.7% |
13.1% |
14.7% |
1.7 |
1.5 |
26.8 |
19.2 |
||
Median |
1.2% |
6.6% |
7.1% |
10.2% |
10.3% |
13.5% |
1.6 |
1.5 |
20.9 |
16.4 |
||
Source: Edison Investment Research, Refinitiv. Note: Priced at 16 September. *Excludes Basware and Coupa.
Exhibit 9: US SaaS software company financial and valuation metrics
Company |
Market cap ($m) |
EV in rep. ccy (m) |
Sales LY (m) |
Sales growth |
EBITDA margin |
EBIT margin |
EV/sales |
P/E |
|||||
CY (%) |
NY (%) |
CY (%) |
NY (%) |
CY (%) |
NY (%) |
CY (x) |
NY (x) |
CY (x) |
NY (x) |
||||
Salesforce.Com |
134,163 |
131,506 |
13,282 |
27.0 |
24.0 |
22.6 |
21.3 |
16.4 |
17.9 |
7.8 |
6.3 |
53.7 |
49.4 |
ServiceNow |
47,243 |
46,267 |
2,609 |
32.6 |
28.7 |
27.7 |
28.6 |
21.1 |
22.9 |
13.4 |
10.4 |
78.2 |
58.7 |
Workday |
38,211 |
37,517 |
2,822 |
27.3 |
22.9 |
19.7 |
21.4 |
12.4 |
14.3 |
10.4 |
8.5 |
98.9 |
75.4 |
Atlassian |
30,895 |
30,035 |
1,210 |
28.4 |
26.7 |
23.9 |
24.3 |
20.2 |
21.4 |
19.3 |
15.3 |
125.2 |
97.8 |
Twilio |
14,892 |
13,474 |
650 |
71.9 |
33.0 |
4.7 |
6.9 |
0.7 |
2.8 |
12.1 |
9.1 |
646.5 |
353.2 |
Paycom Software |
12,248 |
12,187 |
566 |
28.8 |
23.6 |
42.1 |
42.0 |
36.3 |
36.6 |
16.7 |
13.5 |
61.8 |
49.8 |
Okta |
11,919 |
11,641 |
399 |
41.0 |
30.8 |
-8.7 |
-2.1 |
-11.1 |
-3.8 |
20.7 |
15.8 |
N/A |
N/A |
Coupa Software |
8,278 |
8,194 |
260 |
42.9 |
28.6 |
7.1 |
10.1 |
3.4 |
6.7 |
22.0 |
17.1 |
829.4 |
339.7 |
Zendesk |
8,153 |
8,196 |
599 |
35.3 |
30.6 |
6.3 |
9.2 |
2.2 |
5.7 |
10.1 |
7.7 |
289.9 |
133.0 |
Proofpoint |
7,051 |
6,868 |
717 |
22.7 |
20.8 |
16.7 |
17.9 |
12.7 |
14.4 |
7.8 |
6.5 |
77.1 |
59.2 |
HubSpot |
6,975 |
6,349 |
513 |
29.6 |
24.0 |
12.8 |
13.8 |
8.2 |
9.3 |
9.6 |
7.7 |
116.8 |
96.7 |
Paylocity |
5,022 |
4,860 |
468 |
21.0 |
20.0 |
28.8 |
29.6 |
21.8 |
23.3 |
8.6 |
7.2 |
57.6 |
45.3 |
Blackbaud |
4,551 |
5,078 |
849 |
5.4 |
4.9 |
20.6 |
20.1 |
17.0 |
17.2 |
5.7 |
5.4 |
41.7 |
38.5 |
Cornerstone OnDemand |
3,418 |
3,306 |
538 |
6.0 |
14.0 |
21.9 |
26.0 |
14.5 |
17.9 |
5.8 |
5.1 |
54.1 |
37.9 |
Qualys |
3,136 |
2,838 |
279 |
15.4 |
15.4 |
39.5 |
39.4 |
31.7 |
31.7 |
8.8 |
7.6 |
38.7 |
34.8 |
FireEye |
2,992 |
2,990 |
831 |
4.9 |
8.0 |
6.7 |
10.5 |
0.8 |
4.9 |
3.4 |
3.2 |
914.6 |
82.9 |
Box |
2,645 |
2,582 |
608 |
13.6 |
12.6 |
7.4 |
10.5 |
0.5 |
5.3 |
3.7 |
3.3 |
3833 |
80.2 |
LivePerson |
2,397 |
2,346 |
250 |
16.3 |
20.1 |
0.8 |
6.3 |
-4.8 |
0.8 |
8.1 |
6.7 |
N/A |
N/A |
Mimecast |
2,394 |
2,296 |
340 |
23.3 |
20.9 |
17.3 |
19.0 |
9.9 |
12.6 |
5.5 |
4.5 |
88.2 |
58.8 |
Kinaxis |
2,167 |
1,442 |
151 |
23.3 |
12.7 |
27.1 |
26.2 |
21.6 |
21.1 |
7.8 |
6.9 |
51.9 |
46.7 |
Upland Software |
897 |
1,094 |
150 |
43.0 |
11.0 |
36.9 |
37.8 |
35.3 |
34.8 |
5.1 |
4.6 |
14.4 |
14.5 |
Average |
26.6 |
20.6 |
18.2 |
19.9 |
12.9 |
15.1 |
10.1 |
8.2 |
202.2 |
92.9 |
|||
Median |
27.0 |
20.9 |
19.7 |
20.1 |
12.7 |
14.4 |
8.6 |
7.2 |
77.1 |
58.7 |
|||
Source: Refinitiv. Note: Priced at 16 September.
|
Exhibit 10: Two-year revenue growth and EBIT margins: US peers versus Esker |
|
|
Source: Edison Investment Research, Refinitiv |
|
Exhibit 11: Revenue growth (%) and P/E – current year forecasts: US peers versus Esker |
|
|
Source: Edison Investment Research, Refinitiv |
|
Exhibit 12: Revenue growth (%) and P/E – next year forecasts: US peers versus Esker |
|
|
Source: Edison Investment Research, Refinitiv |
Exhibit 13: Financial summary
€000s |
2014 |
2015 |
2016 |
2017 |
2018 |
2019e |
2020e |
||
Year end 31 December |
French GAAP |
French GAAP |
French GAAP |
French GAAP |
French GAAP |
French GAAP |
French GAAP |
||
PROFIT & LOSS |
|||||||||
Revenue |
|
|
46,061 |
58,457 |
65,990 |
76,064 |
86,871 |
100,649 |
114,596 |
EBITDA |
|
|
8,979 |
13,405 |
14,871 |
16,399 |
18,237 |
20,889 |
24,951 |
Operating Profit (before amort and except) |
5,700 |
9,257 |
9,934 |
10,547 |
11,913 |
13,683 |
17,295 |
||
Amortisation of acquired intangibles |
0 |
(302) |
(200) |
(300) |
(344) |
(344) |
(344) |
||
Exceptionals and other income |
53 |
(245) |
(474) |
(456) |
(88) |
139 |
0 |
||
Other income |
0 |
0 |
0 |
0 |
0 |
0 |
0 |
||
Operating Profit |
5,753 |
8,710 |
9,260 |
9,791 |
11,481 |
13,478 |
16,951 |
||
Net Interest |
220 |
(6) |
(108) |
(110) |
(57) |
250 |
100 |
||
Profit Before Tax (norm) |
|
|
5,920 |
9,312 |
9,949 |
10,669 |
12,173 |
14,433 |
17,995 |
Profit Before Tax (FRS 3) |
|
|
5,973 |
8,765 |
9,275 |
9,913 |
11,741 |
14,228 |
17,651 |
Tax |
(1,323) |
(2,292) |
(2,950) |
(3,148) |
(2,940) |
(4,411) |
(5,472) |
||
Profit After Tax (norm) |
4,609 |
6,877 |
6,785 |
7,281 |
9,125 |
9,959 |
12,417 |
||
Profit After Tax (FRS 3) |
4,650 |
6,473 |
6,325 |
6,765 |
8,801 |
9,818 |
12,179 |
||
Average Number of Shares Outstanding (m) |
4.8 |
5.0 |
5.3 |
5.3 |
5.4 |
5.5 |
5.7 |
||
EPS - normalised (c) |
|
|
97 |
138 |
128 |
138 |
169 |
180 |
219 |
EPS - normalised fully diluted (c) |
|
|
90 |
131 |
122 |
132 |
164 |
174 |
212 |
EPS - (GAAP) (c) |
|
|
97 |
130 |
120 |
128 |
163 |
177 |
215 |
Dividend per share (c) |
24 |
30 |
30 |
32 |
41 |
45 |
50 |
||
Gross margin (%) |
N/A |
N/A |
N/A |
N/A |
N/A |
N/A |
N/A |
||
EBITDA Margin (%) |
19.5 |
22.9 |
22.5 |
21.6 |
21.0 |
20.8 |
21.8 |
||
Operating Margin (before GW and except) (%) |
12.4 |
15.8 |
15.1 |
13.9 |
13.7 |
13.6 |
15.1 |
||
BALANCE SHEET |
|||||||||
Fixed Assets |
|
|
12,552 |
25,184 |
28,324 |
37,912 |
39,635 |
42,285 |
43,985 |
Intangible Assets |
7,709 |
19,603 |
22,381 |
26,673 |
28,096 |
29,796 |
31,496 |
||
Tangible Assets |
4,470 |
4,985 |
5,158 |
7,115 |
7,050 |
8,000 |
8,000 |
||
Other |
373 |
596 |
785 |
4,124 |
4,489 |
4,489 |
4,489 |
||
Current Assets |
|
|
33,894 |
36,110 |
42,024 |
42,823 |
49,016 |
56,101 |
63,338 |
Stocks |
93 |
161 |
101 |
176 |
147 |
147 |
147 |
||
Debtors |
15,110 |
18,073 |
19,523 |
21,253 |
25,551 |
28,127 |
32,024 |
||
Cash |
17,559 |
16,295 |
21,338 |
20,632 |
22,794 |
27,304 |
30,643 |
||
Other |
1,132 |
1,581 |
1,062 |
762 |
524 |
524 |
524 |
||
Current Liabilities |
|
|
(19,827) |
(24,789) |
(28,299) |
(26,206) |
(30,072) |
(32,555) |
(35,069) |
Creditors |
(19,827) |
(24,789) |
(28,299) |
(26,206) |
(30,072) |
(32,555) |
(35,069) |
||
Short term borrowings |
0 |
0 |
0 |
0 |
0 |
0 |
0 |
||
Long Term Liabilities |
|
|
(5,113) |
(7,317) |
(7,657) |
(14,909) |
(10,810) |
(8,310) |
(5,810) |
Long term borrowings |
(5,113) |
(7,317) |
(7,657) |
(13,716) |
(9,318) |
(6,818) |
(4,318) |
||
Other long term liabilities |
0 |
0 |
0 |
(1,193) |
(1,492) |
(1,492) |
(1,492) |
||
Net Assets |
|
|
21,506 |
29,188 |
34,392 |
39,620 |
47,769 |
57,521 |
66,444 |
CASH FLOW |
|||||||||
Operating Cash Flow |
|
|
9,245 |
14,307 |
15,331 |
17,311 |
18,324 |
20,797 |
23,568 |
Net Interest |
310 |
(27) |
(127) |
(75) |
63 |
250 |
100 |
||
Tax |
(1,075) |
(1,165) |
(1,456) |
(2,053) |
(2,795) |
(4,411) |
(5,472) |
||
Capex |
(4,028) |
(3,909) |
(7,021) |
(9,304) |
(7,789) |
(10,200) |
(9,700) |
||
Acquisitions/disposals |
22 |
(11,700) |
(335) |
(7,551) |
(225) |
0 |
0 |
||
Financing |
(694) |
1,324 |
480 |
(345) |
785 |
0 |
0 |
||
Dividends |
(877) |
(1,208) |
(1,550) |
(1,633) |
(1,756) |
(2,237) |
(2,656) |
||
Net Cash Flow |
2,903 |
(2,378) |
5,322 |
(3,650) |
6,607 |
4,199 |
5,839 |
||
Opening net debt/(cash) |
|
|
(11,961) |
(12,446) |
(8,978) |
(13,681) |
(10,011) |
(16,576) |
(20,775) |
HP finance leases initiated |
(2,293) |
(1,090) |
(645) |
0 |
0 |
0 |
0 |
||
Other |
(125) |
0 |
26 |
(20) |
(43) |
(0) |
0 |
||
Closing net debt/(cash) |
|
|
(12,446) |
(8,978) |
(13,681) |
(10,011) |
(16,576) |
(20,775) |
(26,614) |
Source: Esker accounts, Edison Investment Research
|
|||||||||||||||||||||||||||||||||||||||
|
|
Research: Industrials
Mytilineos reported solid revenue and EBITDA growth in H1, boosted by the power & gas business. Mytilineos is trading on low short-term multiples (c 8x FY19 P/E and 5x EV/EBITDA), but we believe the stock is even more attractive for investors focused on the strong growth potential driven by long-term projects, which, in our view, the company can finance mostly with its robust cash flow generation. We forecast a 15% net income CAGR in FY19e–22e with the new gas-fired power plant as key driver.