Last close As at 05/08/2026
—
— 0.00 (0.00%)
Market capitalisation
—
Research: Investment Companies
Seneca Global Income & Growth Trust
Seneca Global Income & Growth Trust |
Diverse income from multi-asset investment |
Investment trusts |
15 June 2016 |
Share price/discount performance
Three-year cumulative perf. graph
Gearing
Analysts
|
|||||||||||||||||||||||||||||||||||||||||||||||||||||||||||||||||||||||||||||||||||||
Seneca Global Income & Growth Trust (SIGT) is an actively managed, multi-asset global income fund. Investments are made in equities (strategic asset allocation of 60%), fixed income (15%) and specialist assets (25%) with the manager taking a long-term perspective. Since the investment mandate change in January 2012, SIGT’s NAV total return has significantly outperformed its benchmark three-month Libor +3% and its NAV has exhibited much lower volatility than the FTSE All-Share index. Dividends have increased each year since FY13; in the last two financial years the dividend was increased by 4.6% per year. SIGT’s prospective dividend yield is 4.2%. The board has announced its intention to introduce a discount control mechanism, which will commence on 1 August 2016.
12 months ending |
Total share price return (%) |
Total NAV return (%) |
Benchmark (%) |
FTSE All-Sh TR GBP (%) |
FTSE WMA Balanced (%) |
FTSE AW World (%) |
31/05/12 |
(4.7) |
(6.1) |
6.6 |
(8.0) |
(1.8) |
(5.9) |
31/05/13 |
33.3 |
27.7 |
3.6 |
30.1 |
20.4 |
28.8 |
31/05/14 |
10.8 |
7.5 |
3.5 |
8.9 |
5.9 |
6.4 |
31/05/15 |
10.0 |
10.3 |
3.6 |
7.5 |
10.5 |
16.3 |
31/05/16 |
5.6 |
(0.4) |
3.6 |
(6.3) |
(0.9) |
(0.2) |
Source: Thomson Datastream. Note: 12-month discrete total returns. Benchmark is an absolute return of 8% per year until January 2012 and three-month Libor +3% thereafter.
Investment strategy: Diversity of income streams
SIGT employs a clearly defined investment process, with a strategic allocation to different assets classes designed to meet the trust’s objectives. This is varied by a tactical asset allocation based on the relative attractiveness of the yield and capital appreciation potential of each asset class. The trust invests in UK and overseas equities, fixed income and specialist assets, including property and private equity, and its performance is assessed against three-month Libor +3%. UK equity exposure is via direct investment, while the majority of other holdings are investments in dedicated funds. Typically, SIGT holds 60-65 positions.
Market outlook: Stock price volatility may continue
The forward equity earnings multiples of companies in both developed and emerging markets have come down from the high levels seen in mid-2015 as investors have focused on slowing global growth and other macroeconomic issues. While there has been high volatility in individual stock prices particularly those of commodity-producing companies and recent quarterly earnings reports have generally been lacklustre, equities still look relatively attractive on a yield valuation basis, particularly in comparison with government bonds. SIGT’s low volatility, multi-asset approach may appeal to investors concerned by market volatility.
Valuation: Narrowing trend in the discount
SIGT’s share price is currently trading in line with cum-income NAV. This compares to a range of a 5.3% premium to a 5.6% discount over the last 12 months (average 1.0% discount) and the average discounts of the last three and five years (4.5% and 7.1% respectively).
Exhibit 1: Trust at a glance
Investment objective and fund background |
Recent developments |
|||||||||||||||||||||||||||||||||||||||||||||||||||||||||
SIGT’s objective is to outperform three-month Libor plus 3.0% over the longer term, with low volatility and the prospect of income and capital growth, through investment in a multi-asset portfolio including UK and overseas equities, fixed-income securities, property and specialist assets. The trust changed its name from Midas Income & Growth in October 2014. |
■ 10 June 2016: Annual results for 12 months to 30 April. NAV TR +0.8% versus benchmark +3.7%. Share price TR +9.3%. ■ 12 May 2016: Fourth interim dividend 1.52p (+3.4% vs prior year). ■ 1 March 2016: Peter Elston appointed named manager alongside Alan Borrows. |
|||||||||||||||||||||||||||||||||||||||||||||||||||||||||
Forthcoming |
Capital structure |
Fund details |
||||||||||||||||||||||||||||||||||||||||||||||||||||||||
AGM |
July 2016 |
Ongoing charges |
1.51% |
Group |
Seneca Investment Managers |
|||||||||||||||||||||||||||||||||||||||||||||||||||||
Interim results |
December 2016 |
Net gearing |
10.8% |
Managers |
Alan Borrows, Peter Elston |
|||||||||||||||||||||||||||||||||||||||||||||||||||||
Year end |
30 April |
Annual mgmt fee |
0.90% of market cap up to £50m, 0.65% above £50m |
Address |
10th Floor Horton House, Exchange Flags, Liverpool L2 3YL |
|||||||||||||||||||||||||||||||||||||||||||||||||||||
Dividend paid |
Sep, Dec, Mar, Jun |
Performance fee |
None |
|||||||||||||||||||||||||||||||||||||||||||||||||||||||
Launch date |
August 2005 |
Trust life |
Indefinite |
Phone |
+44 (0)151 906 2461/2475 |
|||||||||||||||||||||||||||||||||||||||||||||||||||||
Continuation vote |
Annual – see page 7 |
Loan facilities |
£7m two-year rolling |
Website |
||||||||||||||||||||||||||||||||||||||||||||||||||||||
Dividend policy and history |
Share buyback policy and history |
|||||||||||||||||||||||||||||||||||||||||||||||||||||||||
Dividends are paid quarterly in September, December, March and June. |
Note: Discount control mechanism to be introduced at July 2016 AGM. |
|||||||||||||||||||||||||||||||||||||||||||||||||||||||||
|
|
|||||||||||||||||||||||||||||||||||||||||||||||||||||||||
Shareholder base (at 30 April 2016) |
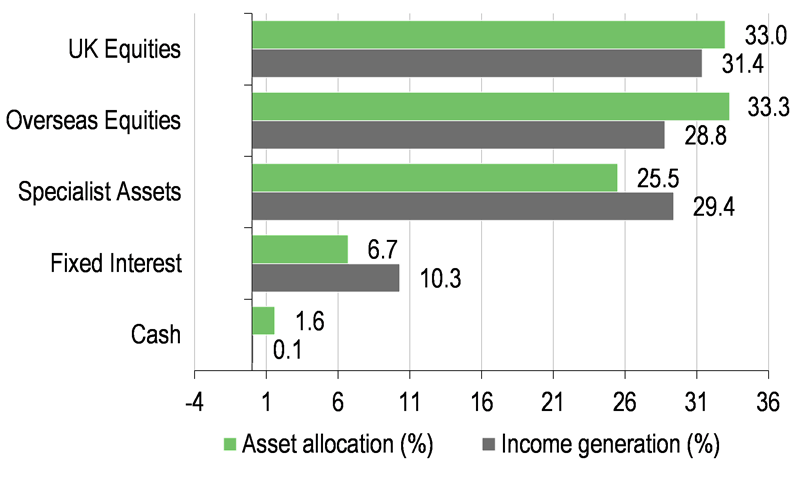
Portfolio distribution by capital and income generation (at 31 May 2016) |
|||||||||||||||||||||||||||||||||||||||||||||||||||||||||
|
|
|||||||||||||||||||||||||||||||||||||||||||||||||||||||||
Top five holdings by asset category (at 31 May 2016) |
||||||||||||||||||||||||||||||||||||||||||||||||||||||||||
|
||||||||||||||||||||||||||||||||||||||||||||||||||||||||||
Source for charts and tables above: SIGT, Edison Investment Research, Morningstar, Bloomberg
Market outlook: Stock market volatility may continue
As shown in Exhibit 2 (left-hand side) equity forward-earnings multiples in both developed and emerging markets have pulled back from the levels seen in mid-2015. This is a result of market declines driven by investor concerns including slowing global growth (particularly in China), lower commodity prices, divergence in central banks’ monetary policy and the upcoming Brexit referendum. The year to date has seen volatility and changing market leadership on a sector basis; for example in the US, the largest global stock market, defensive utilities and telecoms have led the market, while the longstanding outperforming healthcare sector has been one of the laggards. Materials sector stocks fell by over 10% in January 2016, before rallying by more than 20% during the next three months. Global markets have rallied since mid-February when the European Central Bank’s president Mario Draghi announced there would be further easing in European monetary policy. The rally is despite estimates for global growth being revised down by the International Monetary Fund and companies generally reporting lacklustre Q116 earnings. However, as illustrated in Exhibit 2 (right-hand side), the spread between UK equity and bond yields is towards the top end of the historical range suggesting that equities remain a relatively attractive asset class. In an uncertain investment environment, an actively managed, multi-asset fund with diverse income streams from equities, bonds and specialist assets, with relatively low volatility, may hold appeal.
|
Exhibit 2: Datastream developed and emerging markets valuation metrics over 10 years |
|
DS developed and emerging markets forward P/E ratios |
Ratio of UK equity and 10-year government bond yields (DS indices) |
|
|
|
Source: Thomson Datastream, Edison Investment Research |
|
Fund profile: ‘Multi-Asset Value Investing’
Founded as the Taverners Trust and managed by Aberdeen Asset Management, the trust became the Midas Income & Growth Trust in August 2005. In March 2014, the trust’s investment manager was purchased by Seneca Asset Managers Limited with the fund management business being renamed Seneca Investment Managers Limited (SIML); the trust itself was renamed Seneca Global Income & Growth Trust, highlighting its global mandate. SIGT aims to generate income and capital growth with low volatility by investing in a multi-asset portfolio of equities, fixed income and specialist assets. In January 2012, the board made a number of changes with a view to improving the trust’s future total returns. Strategic asset allocation to overseas equities was increased by 10% to 25%, while the allocation to fixed income was reduced by 10% to 15%. The dividend was rebased to what was deemed a sustainable level and the benchmark was changed from an absolute return of 8% per year to three-month Libor +3%.
SIGT’s manager SIML is a value investor focusing on ‘Multi-Asset Value Investing’. SIML invests both directly and in funds; derivatives are not used, ensuring that the trust is both transparent and easy to understand. Valuation of assets is primarily based on a yield consideration, both absolute and relative. For collective investments, only value-oriented managers are considered. Alan Borrows has served as portfolio manager since 2005; Peter Elston, the chief investment officer at Seneca, was appointed co-manager in March 2016. SIGT differentiates itself versus its peers in the AIC Global Equity Income sector through diversification of its income stream across multi-asset investments rather than just via investment in equities.
The fund managers: Alan Borrows and Peter Elston
The managers’ view: Value opportunities across asset classes
The managers explain that yield is the key measure of value across all segments of the portfolio, both in absolute terms and versus history; currently yields are higher than the historical average across asset classes, (with the exception of developed market government bonds). Within equities, UK dividend yields are higher than the historical average, while return on equity and operating margins are below average. As a result, they do not view the overall current level of dividends as at risk and feel the current market yield represents good value, particularly in the mid-cap area in which SIGT mainly invests. There are some areas of the market deemed higher risk and as a result SIGT does not hold any large pharmaceutical companies or banks and has been reducing exposure to the mining sector. The portfolio has underweight exposure to North American equities as low yields versus history indicate that the market is expensive relative to other markets. The managers favour European equities where the dividend yield is above the historical average. Looking at the business cycle with regards to unemployment, Continental Europe started to improve three or four years ago, having lagged improvement in the UK and US. Until monetary policy is tightened, which the managers deem to be some years off, corporate profits are expected to continue to grow. SIGT’s exposure to Japan is above the benchmark weight. Although the macro background is tough as a result of severe demographic headwinds, which are seen as constraining growth, the Japanese government is seeking to implement reforms such as company restructurings and a focus on shareholders, which is creating attractive investment opportunities. Overall, the managers are moderately positive on equities as yields are above historical averages. That said, if markets continue to decline, SIGT is in a position to take advantage of such weakness.
Within fixed income, government bonds are considered extremely expensive, as evidenced by very low yields in inflation-linked bonds in the US and negative yields in the UK, Europe and Japan. SIGT has no exposure to developed market government bonds, which the managers suggest is a significant statement. They do not expect a rise in interest rates any time soon; however, they believe the bull market in government bonds is coming to an end. Opportunities are seen elsewhere in fixed income such as high yield and emerging market debt.
The managers highlight that investment in specialist assets including property provides an attractive diversification of the income stream within the portfolio. They suggest that specialist assets can offer a significant uplift to yields available from bonds as well as providing more robust income and lower price volatility than equities. Favoured areas include renewable energy and primary healthcare assets, where pricing structures are index linked or government mandated. Rather than investing in hard assets, exposure to property is gained via real estate investment trusts (REITs). These also tend to have stable and growing income streams, as well as offering decent yields. Many specialist asset classes have performed better than equities over the last three years.
Asset allocation
Investment process: Diverse sources of income
SIGT has a long-term investment horizon investing in assets with diverse income streams. The starting point of the process is the strategic asset allocation (SAA), designed to meet the fund’s objective. As shown in Exhibit 3, within the SAA there is an allocation to equities of 60%, UK (35%) and overseas equities (25%). Investment in UK equities is direct, whereas investment in overseas equities is via third-party funds. The UK market is seen as a source of higher equity income versus overseas markets; SIGT primarily invests in mid-cap stocks rather than in mega caps where the manager suggests there are question marks over the ability of some companies to maintain their dividends. The balance of the SAA is split between fixed income (15%), specialist assets (15%) and property (10%). Within the long-term SAA there is a tactical asset allocation (TAA) where the chief investment officer seeks to optimise portfolio performance based on his view about the medium-term relative attractiveness of the different asset classes.
The two managers are assisted by three other colleagues; each team member has primary responsibility for one of the asset classes. Peter Elston, the chief investment officer specialises in asset allocation, Alan Borrows focuses on fixed income, Richard Parfect on specialist assets, Mark Wright on UK equities and Tom Delic on overseas equities and investment themes. All changes to the portfolio are discussed at weekly meetings, or more frequently if necessary and a majority approval is required before individual changes to the portfolio are implemented. To gain approval for a holding change the team ascertains if enough research has been undertaken on the idea (this varies by asset class) and whether the idea fits in with the fund’s investment style. The majority approval process ensures that responsibility for a position in the portfolio is shared, which acts as an important risk control. Some deviation from target weights is permitted to enable the managers to run a successful position or to allow income to be captured.
Exhibit 3: Asset allocation ranges, long-term core allocation and recent position
% |
Asset allocation range |
Core asset allocation |
Allocation end-May 2016* |
UK equities |
15-60 |
35 |
33.0 |
Overseas equities |
10-40 |
25 |
33.3 |
Total equities |
25-85 |
60 |
66.3 |
Fixed income |
0-40 |
15 |
6.7 |
Specialist (ex-property) |
0-25 |
15 |
20.3 |
Property |
0-25 |
10 |
5.2 |
Cash |
1.6 |
||
100 |
100 |
100 |
Source: Seneca Global Income & Growth Trust. Note: *Numbers subject to rounding differences.
Current portfolio positioning
SIGT tends to hold 60-65 positions, although the manager suggests there is a general move to reduce the number of funds in the portfolio. As shown in Exhibit 4, at the end of April 2016 the fund was broadly split two-thirds, one-third between equities and non-equity investments. The UK TAA was increased earlier in 2016 to accommodate new ideas and to take advantage of market weakness. There has been some recent turnover in UK equity holdings such as the sale of media company UBM where the manager considered the valuation was no longer attractive and had concerns about its exposure to China. The manager waited to collect the final dividend before selling the position. Proceeds were reinvested into Arrow Global, International Personal Finance (both financials) and Marks & Spencer (retail).
|
Exhibit 4: Distribution of equity and non-equity investments at 31 May 2016* |
|
Geographic distribution of equity investments (66% of portfolio) |
Analysis of non-equity investments (34% of portfolio) |
|
|
|
Source: Seneca Global Income & Growth Trust, Edison Investment Research. Note: *Numbers subject to rounding differences. |
|
Performance: Outperformance with lower volatility
SIGT’s share price and NAV total returns have outperformed its benchmark over three and five years and since the change in mandate. The share price has also outperformed the benchmark over one year, as the discount to NAV has narrowed. Strong near-term relative performance has been helped by positions in Ashmore Group, BHP Billiton and BlackRock World Mining Trust, which have all outperformed the benchmark by more than 30% over the three months to the end of April 2016. SIGT’s NAV total return has also outperformed the FTSE All-Share index and the FTSE WMA Balanced index over one, three and five years and since the change in mandate.
SIGT’s NAV volatility from the mandate change to the end of April 2016 is significantly lower than the FTSE All-Share index (10.6% versus 17.8%).
|
Exhibit 5: Investment trust performance to end-May 2016 |
|||||||||
Price, NAV and benchmark total return performance, one-year rebased |
Price, NAV and benchmark total return performance (%) |
||||||||
|
|
||||||||
|
Source: Thomson Datastream, Edison Investment Research. Note: Since change of mandate (SC) is from 18 January 2012. Benchmark is an absolute return of 8% per year until 18 January 2012 and three-month Libor +3% thereafter. Performance figures for periods of more than one year are annualised. |
|||||||||
|
Exhibit 6: Share price and NAV total return relative performance |
|||||||||
|
Three months |
Six months |
One year |
Three years |
Since change of mandate |
Five years |
10 years |
||
Price relative to benchmark |
6.7 |
3.5 |
2.0 |
16.0 |
47.8 |
33.4 |
(20.4) |
||
NAV relative to benchmark |
4.8 |
0.7 |
(3.9) |
6.3 |
27.7 |
15.5 |
(16.6) |
||
Price relative to FTSE All-Share TR GBP |
3.7 |
5.2 |
12.7 |
17.5 |
26.3 |
24.7 |
(14.2) |
||
NAV relative to FTSE All-Share TR GBP |
1.8 |
2.3 |
6.3 |
7.7 |
9.1 |
7.9 |
(10.2) |
||
Price relative to FTSE WMA Balanced |
4.6 |
3.2 |
6.6 |
11.1 |
26.0 |
19.2 |
(18.1) |
||
NAV relative to FTSE WMA Balanced |
2.7 |
0.4 |
0.5 |
1.8 |
8.8 |
3.2 |
(14.3) |
||
|
Source: Thomson Datastream, Edison Investment Research. Note: Data to end-May 2016. Geometric calculation. Benchmark is an absolute return of 8% per year until 18 January 2012 and three-month Libor +3% thereafter. |
|||||||||
|
Exhibit 7: SIGT NAV total return vs benchmark, FTSE All-Share and FTSE WMA Balanced total return since change of mandate, rebased |
|||||||||
|
|||||||||
|
Source: Thomson Datastream, Edison Investment Research |
|||||||||
Discount: Adoption of discount control mechanism
The board has announced its intention to introduce a discount control mechanism, which will commence on 1 August 2016. The aim is to ensure that the share price trades very close to NAV by buying shares when they trade at a small discount to NAV and issuing shares when they trade at a marginal premium. Shareholder permission will be sought at the July 2016 AGM to issue up to 20% of new shares. The non-dilutive enlargement of the company through issuing shares at a price higher than NAV should improve liquidity in the shares and spread fixed costs over a larger base.
As shown in Exhibit 8, over the last three years the discount has contracted, and the shares are currently trading in line with cum-income NAV. Over the last 12 months the shares have traded between a 5.3% premium and a 5.6% discount, with an average discount of 1.0%. This compares to the three-year average discount of 4.5%.
|
Exhibit 8: Share price premium/discount to NAV (including income) over three years (%) |
|
|
Source: Thomson Datastream, Edison Investment Research. Note: Negative values indicate a discount, positive values a premium. |
Capital structure and fees
SIGT is a conventional investment trust with one class of share; there are currently 39.9m shares outstanding. The trust has authority to purchase up to 14.99% and allot up to 10% of issued share capital, but no shares have been repurchased or issued since May 2011. On 31 October 2015, the existing short-term rolling debt facility of £7m expired and was replaced with a two-year rolling facility on improved terms. At the end of May 2016, net gearing was 10.3%.
SIGT’s investment manager is Seneca Investment Managers, which is paid 0.9% of SIGT’s market cap per year up to £50m and 0.65% per year above £50m. The management fee is allocated 50:50 to capital and income; there is no performance fee. Ongoing charges for FY15 were 1.51% versus 1.54% in the prior year.
Dividend policy and record
SIGT pays quarterly dividends in September, December, March and June. Since 2012, when the dividend was rebased, the interim dividend paid has been stable for the first three quarters of the financial year with an increase in the fourth interim dividend serving as an indicator of the quarterly dividends to be paid in the following year. While there is no formal income target, when the dividend was rebased the board stated that it wanted to pursue a progressive dividend policy.
In financial year 2015, the dividend increased by 4.6% to 5.67p, it was fully covered and there was a small increase to revenue reserves. For 2016, three interim dividends of 1.47p have been paid followed by a fourth interim dividend of 1.52p. This is another 4.6% increase in the annual dividend to 5.93p. Barring unforeseen circumstances, the board intends to at least maintain a quarterly dividend of 1.52p for the 2017 financial year, giving a prospective yield of 4.2%.
Peer group comparison
Exhibit 9 shows a comparison of SIGT versus the trusts in the AIC global equity income sector. Although it has a multi-asset approach while most of the peers invest purely in equities, SIGT has a roughly two-thirds exposure to equities, which adds relevance to the comparison.
SIGT’s NAV total return has outperformed the average of the peer group over one and three years, although it has lagged over five and 10 years. In terms of risk-adjusted returns as measured by the Sharpe ratio, SIGT has performed in line over one year and better than the peer group average over three years. Along with two other peers, SIGT’s shares are trading at a premium to ex-income NAV compared to the average 3.0% discount. Given recent share price appreciation, SIGT’s dividend yield is modestly below the average; its gearing is broadly in line.
Exhibit 9: Selected peer group at 3 June 2016
% unless stated |
Market cap £m |
NAV TR 1 Year |
NAV TR 3 Year |
NAV TR 5 Year |
NAV TR 10 Year |
Sharpe 1y (NAV) |
Sharpe 3y (NAV) |
Discount (ex-par) |
Ongoing charge |
Net gearing |
Dividend yield (%) |
Seneca Global Income & Growth |
58.4 |
(0.4) |
19.1 |
42.1 |
52.3 |
(0.5) |
0.4 |
0.3 |
1.5 |
111 |
4.0 |
BlackRock Income Strategies |
333.6 |
(4.9) |
3.5 |
21.0 |
43.0 |
(0.8) |
(0.0) |
(6.2) |
0.7 |
103 |
5.3 |
Blue Planet Investment |
18.1 |
(20.3) |
7.0 |
|
|
(1.4) |
0.1 |
(17.9) |
3.8 |
150 |
7.7 |
F&C Managed Portfolio Income |
47.0 |
(5.5) |
11.3 |
39.0 |
|
(0.9) |
0.2 |
(0.3) |
1.2 |
96 |
4.5 |
Henderson International Income |
199.8 |
4.0 |
25.0 |
59.2 |
|
(0.1) |
0.6 |
2.4 |
1.1 |
100 |
3.5 |
Invesco Perp Select Glo Eq Inc |
51.1 |
(0.9) |
26.3 |
53.6 |
|
(0.3) |
0.6 |
(1.9) |
1.0 |
108 |
3.2 |
London & St Lawrence |
98.6 |
(3.4) |
16.4 |
48.0 |
86.8 |
(0.6) |
0.4 |
(4.8) |
0.9 |
99 |
4.2 |
Murray International |
1,190.6 |
0.2 |
(1.6) |
25.3 |
128.6 |
(0.4) |
(0.2) |
2.5 |
0.7 |
115 |
4.9 |
Scottish American |
357.1 |
2.9 |
18.9 |
34.8 |
61.1 |
(0.2) |
0.4 |
(1.0) |
0.9 |
122 |
4.0 |
Securities Trust of Scotland |
149.7 |
0.9 |
13.4 |
44.7 |
67.8 |
(0.3) |
0.3 |
(6.4) |
0.9 |
107 |
4.1 |
Average |
241.1 |
(2.5) |
15.1 |
43.3 |
79.3 |
(0.5) |
0.3 |
(3.0) |
1.3 |
112 |
4.5 |
Source: Morningstar, Edison Investment Research. Note: TR=total return. Sharpe ratio is a measure of risk-adjusted return. The ratios shown are calculated by Morningstar for the past 12- and 36-month periods by dividing a fund’s annualised excess returns over the risk-free rate by its annualised standard deviation. Net gearing is total assets less cash and equivalents as a percentage of net assets.
The board
There are three directors on the board of SIGT; all are independent. Richard Ramsay was appointed as a director in April 2013; he became chairman in September 2013. Ian Davis has been chairman of the audit committee since December 2004, following his appointment to the board in the prior month. The newest board member is James McCulloch, appointed in January 2015.
Glossary
Discount control mechanism
A discount control mechanism (DCM) will usually involve a trust buying back its own shares in the market, and either cancelling them or holding them in treasury to be reissued when demand is stronger.
Gearing
Investment companies frequently employ a moderate level of borrowing to buy additional investments to increase returns when they appreciate. The risk is that gearing magnifies losses if the investments fall in value.
LIBOR
The London Interbank Offered Rate is a reference interest rate widely used in financial markets as a basis for lending rates or an indication of the return available on cash.
Multi-asset fund
Multi-asset funds have a mandate to invest across different asset classes such as equities, fixed income, property and other specialist areas. The fund manager will vary exposures according to market conditions, seeking to optimise the balance of risk and reward.
Premium/discount to net asset value (NAV)
The net asset value of a company, including an investment company, is the value of its assets less liabilities. Depending on a range of factors, including the market’s assessment of the prospects for a company or appetite for yield, its shares may trade at a price above the NAV, at a premium, or at a discount.
Ongoing charge
This is a measure of the regular, recurring costs of running an investment company expressed as a percentage of the NAV.
Strategic asset allocation
Strategic asset allocation can be thought of as the broad allocation to each asset class that would be expected to achieve the investment performance objective over time. For example, a simple multi-asset fund might have a strategic asset allocation of 60% global equities and 40% global bonds. Given an understanding of how global equities and global bonds would be expected to behave over the longer term, one would have an understanding of how the fund should behave over the longer term as a result of exposure to bonds and equities in the proportions mentioned.
Tactical asset allocation
Tactical asset allocation is generally used in conjunction with strategic asset allocation. Tactical asset allocation refers to decisions to deviate from time to time from strategic asset allocation. Using the example cited, this might mean a decision to have only 50% in equities rather than the strategic allocation of 60% because one might have a slightly negative view on the outlook for equities.
Volatility
This is a term used to describe the frequency and severity with which the price of an investment goes up and down.
Yield (income)
The amount of income you receive in monetary terms will be equivalent to the dividend per share multiplied by the number of shares you own. This is usually expressed annually as a percentage based on the investment’s market value.
|
Investment Companies
Research: Investment Companies
Invesco Asia Trust