Last close As at 05/08/2026
GBP1.87
— 0.00 (0.00%)
Market capitalisation
GBP409m
Research: Investment Companies
Lowland Investment Company (LWI) invests for income and capital growth in a diversified portfolio of mainly UK stocks of all sizes, from high-risk early-stage intellectual property plays to household-name FTSE 100 banks. With the overriding theme being that managers James Henderson and Laura Foll believe their current share price does not reflect the value of the business. The managers have been finding opportunities in stocks that are largely exposed to the domestic market, an area that has been very out of favour with investors, who are preoccupied with low wage growth, higher inflation and the potential impact of Brexit negotiations. This has arguably led to a degree of recent underperformance and discount widening, but LWI’s impressive track record of c 12.5% annualised share price and NAV total returns over Henderson’s 28-year tenure remains intact.
Written by
Lowland Investment Company |
Seeking opportunities in unloved UK stocks |
Investment trusts |
26 June 2018 |
Share price/discount performance
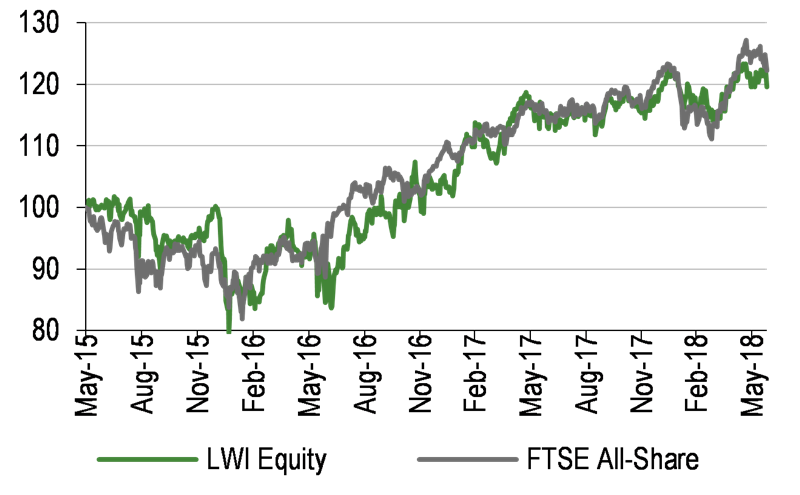
Three-year performance vs index
Gearing
Analysts
|
|||||||||||||||||||||||||||||||||||||||||||||||||||||||||||||||||||||||||||||||||||||||||||||
Lowland Investment Company (LWI) invests for income and capital growth in a diversified portfolio of mainly UK stocks of all sizes, from high-risk early-stage intellectual property plays to household-name FTSE 100 banks. With the overriding theme being that managers James Henderson and Laura Foll believe their current share price does not reflect the value of the business. The managers have been finding opportunities in stocks that are largely exposed to the domestic market, an area that has been very out of favour with investors, who are preoccupied with low wage growth, higher inflation and the potential impact of Brexit negotiations. This has arguably led to a degree of recent underperformance and discount widening, but LWI’s impressive track record of c 12.5% annualised share price and NAV total returns over Henderson’s 28-year tenure remains intact.
12 months ending |
Share price |
NAV |
FTSE All-Share (%) |
FTSE 350 HY (%) |
FTSE 250 |
FTSE Small Cap (%) |
31/05/14 |
19.5 |
19.6 |
8.9 |
8.5 |
14.4 |
23.9 |
31/05/15 |
(0.1) |
8.2 |
7.5 |
2.6 |
16.5 |
8.6 |
31/05/16 |
(6.0) |
(8.1) |
(6.3) |
(8.5) |
(2.8) |
0.2 |
31/05/17 |
24.7 |
26.9 |
24.5 |
28.4 |
19.5 |
24.0 |
31/05/18 |
2.0 |
4.5 |
6.5 |
5.9 |
7.2 |
5.6 |
Source: Thomson Datastream. Note all % on a total return basis in GBP.
Investment strategy: Focus on value and recovery
Managers James Henderson and Laura Foll aim to hold a diversified portfolio of mainly UK companies, with typically 100+ stocks chosen from across the market capitalisation spectrum. They favour value and recovery situations and have tended to have a bias towards smaller and mid-cap companies, although the FTSE 100 weighting is above LWI’s neutral level of one-third of assets. The managers will only buy companies they believe have real sales and earnings growth potential, to avoid ‘value traps’ that look cheap but have poor recovery prospects.
Market outlook: Balance of positive and negative
Although volatility has increased this year from the historic lows of 2017, with significant market reversals in February and March UK stock market indices have reached new all-time highs in 2018. Forward P/E valuations have also fallen somewhat since the early part of the year, suggesting there is still value in the market, although investors should not lose sight of the potential risks from macro factors such as Brexit negotiations and a possible global trade war.
Valuation: Wider-than-average discount
At 25 June 2018, LWI’s shares traded at a 7.7% discount to cum-income NAV. This was wider than both short- and long-term averages, although narrower than a 12-month high of 9.2% seen in early June. The five-year average discount is 2.8%, and in the past LWI has frequently traded at a premium; a reversal of the short-term underperformance could see the discount narrow again. LWI yields 3.3%, slightly below the 3.6% dividend yield on the FTSE All-Share index.
Exhibit 1: Trust at a glance
Investment objective and fund background |
Recent developments |
|||||||||||||||||||||||||||||||||||||||||||||||||||||||||||||||||||||||||||||||||||
Lowland Investment Company (LWI) aims to give investors a higher-than-average return with growth of both capital and income over the medium to long term by investing in a broad spread of predominantly UK companies. LWI measures its performance against the FTSE All-Share index total return. |
■ 11 June 2018: Results for the half-year ended 31 March. NAV TR -3.6% and share price TR +0.4% versus -2.3% for the FTSE All-Share index. Change to cost allocation with effect from 1 October 2018 will boost revenues. ■ 6 June 2018: Second interim dividend of 13.0p per share declared for the year ending 30 September 2018, payable on 31 July. ■ 27 March 2018: First interim dividend of 13.0p declared for the year ending 30 September 2018, payable on 30 April. |
|||||||||||||||||||||||||||||||||||||||||||||||||||||||||||||||||||||||||||||||||||
Forthcoming |
Capital structure |
Fund details |
||||||||||||||||||||||||||||||||||||||||||||||||||||||||||||||||||||||||||||||||||
AGM |
January 2019 |
Ongoing charges |
0.58% |
Group |
Janus Henderson Investors |
|||||||||||||||||||||||||||||||||||||||||||||||||||||||||||||||||||||||||||||||
Annual results |
December 2018 |
Net gearing |
13.0% |
Managers |
James Henderson, Laura Foll |
|||||||||||||||||||||||||||||||||||||||||||||||||||||||||||||||||||||||||||||||
Year end |
30 September |
Annual mgmt fee |
Tiered (see page 7) |
Address |
201 Bishopsgate, |
|||||||||||||||||||||||||||||||||||||||||||||||||||||||||||||||||||||||||||||||
Dividend paid |
Quarterly |
Performance fee |
Yes (see page 7) |
|||||||||||||||||||||||||||||||||||||||||||||||||||||||||||||||||||||||||||||||||
Launch date |
October 1963 |
Trust life |
Indefinite |
Phone |
+44 (0) 20 7818 1818 |
|||||||||||||||||||||||||||||||||||||||||||||||||||||||||||||||||||||||||||||||
Continuation vote |
None |
Loan facilities |
Up to £90m |
Website |
||||||||||||||||||||||||||||||||||||||||||||||||||||||||||||||||||||||||||||||||
Dividend policy and history (financial years) |
Share buyback policy and history (calendar years) |
|||||||||||||||||||||||||||||||||||||||||||||||||||||||||||||||||||||||||||||||||||
Dividends are paid quarterly in April, July, October and January. LWI aims to achieve a growing income for investors and has maintained or increased its dividend each year for more than 40 years. |
LWI’s board has the authority to buy back up to 14.99% of shares, but in practice this is not used. It may also issue new shares at a premium to NAV in response to investor demand. |
|||||||||||||||||||||||||||||||||||||||||||||||||||||||||||||||||||||||||||||||||||
|
|
|||||||||||||||||||||||||||||||||||||||||||||||||||||||||||||||||||||||||||||||||||
Shareholder base (as at 6 June 2018) |
Portfolio exposure by geography (as at 31 May 2018) |
|||||||||||||||||||||||||||||||||||||||||||||||||||||||||||||||||||||||||||||||||||
|
|
|||||||||||||||||||||||||||||||||||||||||||||||||||||||||||||||||||||||||||||||||||
Top 10 holdings (as at 31 May 2018) |
||||||||||||||||||||||||||||||||||||||||||||||||||||||||||||||||||||||||||||||||||||
|
||||||||||||||||||||||||||||||||||||||||||||||||||||||||||||||||||||||||||||||||||||
Source: Lowland Investment Company, Edison Investment Research, Bloomberg, Morningstar. Note: *N/A where not in end-May 2017 top 10.
Market outlook: Good in parts
In spite of an increase in volatility from the historically low levels seen in 2017, equity markets have continued to make good progress so far this year, with UK indices breaking through all-time highs. As shown in Exhibit 2 (left-hand chart), small- and mid-cap companies have performed significantly better over the past 10 years than the blue-chip FTSE 100 index, although the FTSE AIM index, which contains many smaller companies, has struggled in comparison with the other indices. Aggregate valuations remain reasonable (right-hand chart), with the FTSE All-Share index on a 2018 forward P/E of 14.2x, although consumer sectors, healthcare and technology are trading on above-average valuations. Given ongoing uncertainty over the outcome of Brexit negotiations and the impact of a potential global trade war, there is scope for continued volatility as the year progresses, which may be exacerbated in the summer months when trading volumes tend to be low. Against such a backdrop, dividends may continue to be an important element of total returns, and investors may prefer to focus on well-run companies trading on undemanding valuations.
|
Exhibit 2: Market performance and valuation |
|
UK index total return performance over 10 years |
Forward P/E valuations by FTSE All-Share index sector |
|
|
|
Source: Thomson Datastream, Bloomberg, Edison Investment Research |
|
Fund profile: Focus on value and growing income
Launched in 1963, LWI invests mainly in UK-listed companies, with the aim of achieving above-average returns with growth in both capital and income. While it is a member of the AIC UK Equity Income sector, LWI’s focus is on total return rather than a high starting yield, with the managers seeing income growth primarily as an outcome of capital appreciation. LWI has been managed since 1990 by James Henderson at Janus Henderson Investors, assisted since 2013 by Laura Foll, who was appointed joint fund manager in 2016. Foll is on maternity leave until September 2018.
The portfolio is managed with a focus on value and recovery situations, and the managers maintain a relatively long stock list (c 120 companies) to limit stock-specific risk. They seek to invest in companies whose quality and growth potential are underappreciated by the market, regardless of company size or industry sector. Up to 20% of assets (currently 3.3%) may be invested in companies listed outside the UK. LWI uses the FTSE All-Share index as a benchmark, but tends to have a much higher weighting in mid- and small-cap stocks than the benchmark, which is dominated by the largest 100 stocks (80% of the FTSE All-Share index market capitalisation at 31 May 2018). The trust may also hold UK stocks that are outside the benchmark, for example those listed on the Alternative Investment Market (AIM).
LWI is structurally geared through £30m of loan notes maturing in 2037, and also has a flexible short-term borrowing facility of £60m, equating to available gearing of c 20% of NAV.
The fund managers: James Henderson and Laura Foll
The managers’ view: Better value opportunities emerging
James Henderson comments that investors are once again beginning to take notice of UK equities, which he says were the least favoured of all investment areas in a fund manager survey early in 2018. Given fears over the impact of higher price inflation coupled with a lack of wage growth, companies whose earnings are largely domestic have been more out of favour than those UK companies with a high proportion of overseas earnings, and Henderson says this presents interesting opportunities for a contrarian investor, with opportunities to refresh the LWI portfolio. From the market highs seen in January, P/E valuations fell back to levels more in line with historical averages as share prices declined, leading to better value opportunities.
While pressure on the UK consumer has led LWI’s managers to reduce exposure to retailers of big-ticket items such as cars and furniture (see page 5), they have added consumer stocks in other areas, such as brewery and pub operator Greene King, which Henderson describes as having a quality product in its ale Old Speckled Hen, as well as a good pub estate with genuine asset value. Greene King’s premises include the oldest pub in England, Nottingham’s Ye Olde Trip to Jerusalem (established 1189). Henderson notes that companies such as Greene King have seen a modest bear market, reflecting concerns over the property sector, but that this means he has been able to find good companies trading at very attractive valuations. “Given how difficult the retail sector is, it shouldn’t be a surprise if we get some write-downs, but there is also room for positive surprises,” he adds.
Political risk is another reason why some companies have been downgraded, such as in the regulated utility sector, where a general move away from areas seen as bond proxies (driven by the expectation of rising interest rates) has been compounded by concerns over the potential for re-nationalisation under a Labour government. Recent purchases Severn Trent and HICL Infrastructure play into this trend, but Henderson sees the political risk as overdone, given the size of parliamentary majority (particularly in England) that would be necessary to push through such reforms.
Asset allocation
Investment process: Buy good companies that fall from favour
LWI’s investment process remains essentially unchanged since its launch in 1963, and has four main pillars:
■
the UK is home to many world-class companies with sustainable long-term growth potential;
■
the superior growth potential of small- and mid-cap companies makes them better long-term investments;
■
capital growth and dividend growth go hand-in-hand as drivers of investment performance; and
■
long-term investment returns have tended to exceed the cost of borrowing, therefore it is appropriate to employ gearing within the portfolio.
The managers filter their investment universe of c 1,500 companies using a range of valuation criteria to identify those companies that can generate a growing income alongside capital appreciation. Henderson and Foll prefer companies whose prospects are underappreciated by the market and have the potential to recover and grow. The managers meet hundreds of firms each year and may also pick up investment ideas from colleagues in Janus Henderson’s UK and global equities teams. They look for companies they believe have real potential for sales and earnings growth, and although technically LWI is an income fund, they are happy to invest in companies that are not currently paying a dividend, as long as there is fairly near-term potential for them to do so. The trust has a relatively long list of stocks, which the managers say is an appropriate risk-reduction measure given the focus on recovery situations and the high weighting in small-cap and AIM-listed companies. Positions are built gradually (usually starting at c 30bp) and exited gradually, often to crystallise the benefits of strong performance and guard against reversals of sentiment in stocks where the valuation may not be justified by the fundamentals.
Henderson and Foll seek to build a diversified portfolio spanning the whole range of market capitalisations, from household-name blue-chips to early-stage small-caps. While historically the portfolio has been invested broadly one-third each in large-, mid- and small-caps, Henderson and Foll have found fewer opportunities recently in the FTSE 250, where strong performance has seen valuations become stretched. Conversely, they have found better value among large-caps, with the FTSE 100 weighting now approaching 50% of the portfolio. Portfolio construction is unconstrained by the FTSE All-Share index benchmark, although LWI’s managers will normally have exposure to each industry sector to reduce the risk of relative underperformance in periods of strong returns in a sector in which they are not invested.
Current portfolio positioning
At 31 May 2018, there were 123 stocks in the LWI portfolio, a slight reduction from 126 a year earlier. The top 10 stocks made up 27.3% of the total, an increase in concentration from 25.8% at 31 May 2017, mainly because of a 2.1pp increase in the largest position, Royal Dutch Shell. As a bottom-up portfolio, sector weightings can diverge markedly from the FTSE All-Share index benchmark, as shown in Exhibit 3. Financials and industrials are the two largest weightings in absolute terms and are both also significantly above the benchmark weighting. Consumer goods, meanwhile, is a large underweight. The largest changes in exposure over the year to 31 May were a 3.4pp increase in financials, a 2.4pp increase in utilities, a 2.4pp reduction in consumer goods and a 2.2pp fall in consumer services, as the managers feel less optimistic for UK consumer spending on big-ticket items such as furniture and cars. Positions in furniture retailer DFS and car dealership Marshall Motors were fully exited in H118.
Exhibit 3: Portfolio sector exposure vs FTSE All-Share index (% unless stated)
Portfolio end- |
Portfolio end- |
Change |
Index |
Active weight |
Trust weight/ |
|
Financials |
34.6 |
31.2 |
3.4 |
26.0 |
8.7 |
1.3 |
Industrials |
27.6 |
28.4 |
(0.8) |
11.3 |
16.3 |
2.4 |
Oil & gas |
10.3 |
9.6 |
0.7 |
14.0 |
(3.6) |
0.7 |
Consumer services |
9.9 |
12.1 |
(2.2) |
11.7 |
(1.8) |
0.8 |
Basic materials |
4.9 |
6.0 |
(1.0) |
7.9 |
(3.0) |
0.6 |
Utilities |
3.8 |
1.4 |
2.4 |
2.6 |
1.1 |
1.4 |
Healthcare |
3.6 |
4.1 |
(0.5) |
8.8 |
(5.2) |
0.4 |
Consumer goods |
3.3 |
5.7 |
(2.4) |
13.8 |
(10.5) |
0.2 |
Telecommunications |
1.8 |
1.4 |
0.4 |
2.9 |
(1.1) |
0.6 |
Technology |
0.2 |
0.1 |
0.0 |
1.0 |
(0.8) |
0.2 |
Cash |
0.0 |
0.0 |
0.0 |
0.0 |
0.0 |
N/A |
100.0 |
100.0 |
100.0 |
Source: Lowland Investment Company, FTSE Russell, Edison Investment Research
The managers have been net buyers of stocks in recent months, using LWI’s low-cost gearing to take positions in companies such as Greene King and Severn Trent, both of which have dividend yields above the cost of the borrowing. The proportion of the portfolio in large-cap FTSE 100 stocks has increased, with new positions in Land Securities (bought H217) as well as Severn Trent (bought H118), and an increase in the Vodafone position in H217 and the Royal Mail holding (bought H117) in H118. In line with LWI’s all-cap approach, however, new positions have also been taken in smaller stocks, including three bought at IPO in H217 – kettle safety switch maker Strix; non-standard motor insurer Sabre Insurance; and Bolton-based investment bank K3 Capital, which specialises in small-ticket corporate deals in the North of England, such as buying smaller pub chains or portfolios of shops. Another small stock added to the portfolio is AIM-listed Finnish pharmaceutical company Faron Pharmaceutical, part of a c 3.5% allocation to early-stage companies. Better-known larger names have also been added, such as HICL Infrastructure Fund and retail property owner Hammerson, which was bought at a c 40% discount to asset value, sold after a takeover bid pushed up the price, and was subsequently repurchased after the failure of the bid saw the discount re-emerge.
Exits or reductions in holdings are most often the result of profit-taking in companies where valuations look stretched (all of the biggest contributors to performance in FY17 were reduced before the year-end, with Scapa being completely exited). Industrial companies Senior and GKN were both reduced on these grounds in H217, with GKN subsequently fully exited after a takeover bid in H118. However, recent sales have been concentrated in the consumer area (DFS and Marshall Motors, as noted above), with convenience store chain McColl’s also reduced in H217.
Performance: Long-term outperformance record intact
|
Exhibit 4: Investment trust performance to 31 May 2018 |
|
Price, NAV and benchmark total return performance, one-year rebased |
Price, NAV and benchmark total return performance (%) |
|
|
|
Source: Thomson Datastream, Edison Investment Research. Note: Three, five and 10-year performance figures and performance under James Henderson (JH, since 30 October 1990) annualised. |
|
While LWI’s long-term performance record is impressive (annualised share price and NAV total returns of c 10% over 10 years and c 12.5% over James Henderson’s near 28-year tenure), recent share price and NAV returns – although positive over all periods shown – have been behind the FTSE All-Share index benchmark. Leading contributors to outperformance in FY17, for which the NAV total return was 17.0% compared with 11.9% for the benchmark, included Conviviality, Scapa, Stobart Group, Irish Continental Group and Marshalls. All of these were reduced and Scapa was fully exited on the back of strong performance; however, Conviviality was still held at the time of its collapse in March 2018, and became the biggest detractor in H118. Other detractors in the half-year included Renold, Low & Bonar, 4D Pharma, Carclo and Carillion (which was only c 0.2% of the portfolio when it went into liquidation in January), while the largest positive contributions came from K3 Capital, Royal Mail, GKN (taken over by Melrose Industries in H118), Hiscox and Avon Rubber.
|
Exhibit 5: Share price and NAV total return performance, relative to indices (%) |
||||||||
|
One month |
Three months |
Six months |
One year |
Three years |
Five years |
10 years |
JH* |
Price relative to FTSE All-Share |
(2.4) |
(4.5) |
(2.8) |
(4.2) |
(3.8) |
(1.7) |
37.8 |
135.5 |
NAV relative to FTSE All-Share |
(1.9) |
(3.1) |
(2.2) |
(2.0) |
(1.5) |
8.9 |
38.9 |
130.6 |
Price relative to FTSE 350 HY |
(1.9) |
(5.2) |
(2.9) |
(3.6) |
(3.8) |
3.3 |
47.3 |
96.3 |
NAV relative to FTSE 350 HY |
(1.3) |
(3.8) |
(2.2) |
(1.4) |
(1.5) |
14.5 |
48.6 |
92.2 |
Price relative to FTSE 250 |
(2.7) |
(4.1) |
(2.0) |
(4.8) |
(3.9) |
(13.9) |
(1.2) |
11.8 |
NAV relative to FTSE 250 |
(2.1) |
(2.7) |
(1.4) |
(2.6) |
(1.6) |
(4.6) |
(0.4) |
9.5 |
Price relative to FTSE Small Cap |
(1.0) |
(3.6) |
(0.5) |
(3.4) |
(8.9) |
(19.1) |
6.7 |
169.3 |
NAV relative to FTSE Small Cap |
(0.4) |
(2.1) |
0.2 |
(1.2) |
(6.7) |
(10.3) |
7.6 |
163.7 |
|
Source: Thomson Datastream, Edison Investment Research. Note: *JH is performance under James Henderson, since 30 October 1990. Data to end-May 2018. Geometric calculation. |
||||||||
Discount: Wider than short- and long-term averages
At 25 June 2018, LWI’s shares traded at a 7.7% discount to cum-income NAV. This was narrower than the widest discount in the past 12 months (9.2%) but represents a substantial widening from the 12-month low of 1.5% reached in February. It is also higher than both short- and longer-term averages (6.3%, 4.8%, 2.8% and 4.0% respectively over one, three, five and 10 years). While LWI’s board has the authority to repurchase up to 14.99% of shares annually to manage a discount, in practice this power is not used, with no buybacks having taken place in any of the last 10 years.
|
Exhibit 6: Share price premium/discount to NAV (including income) over three years (%) |
|
|
Source: Thomson Datastream, Edison Investment Research |
Capital structure and fees
LWI has one class of share, with 27.0m shares in issue at 25 June 2018. Gearing of up to £90m is available through a £30m issue of 20-year loan notes and a three-year £60m borrowing facility with Scotiabank. If fully drawn, these would represent gearing of c 20% of net assets; actual net gearing was 14% at 30 April 2018, up from 6.3% at end-FY17.
Following a change to the management fee in 2017, Janus Henderson is paid 0.5% pa of the first £375m of net assets and 0.4% pa thereafter. Previously the fee was a flat 0.5% pa. A further change with effect from 1 October 2018 will see the management fee and finance costs split 50/50 between the capital and revenue accounts. Previously all costs except the performance fee were charged to the revenue account. A performance fee may be paid if the NAV total return is more than 10% ahead of the FTSE All-Share index return. This fee is capped at 0.25% of net chargeable assets, meaning total fees are a maximum of 0.75% up to £375m of assets and 0.65% thereafter. Ongoing charges for FY17 were 0.58% (FY16: 0.63%), or 0.68% including the performance fee.
Dividend policy and record
LWI pays dividends quarterly, with interims in April, July and October, and a final dividend in January. The interim dividends have tended to be at the same level as the prior year’s final dividend, with a 1p increase at the final stage. FY17 saw three interim dividends of 12p and a final dividend of 13p. So far in FY18, two interim dividends of 13p have been declared, and the board has guided that, barring unforeseen circumstances, dividends will total 53p for the year, an increase of 8.2% on FY17. The total dividend has been maintained or increased every year since 1975, growing at 9.9% pa compound over the past five years. Dividends were fully covered by income in eight of the last 10 financial years, and the move to charging half of management fees and finance costs to capital will boost the revenue account; had the policy been in place in FY17, revenue returns would have been 54.5p instead of 49.1p. LWI had revenue reserves of 49.9p per share at end-FY17. After deducting the FY17 final dividend this falls to 36.9p per share, or 75% of the total dividend. Based on the current share price and the last 12 months’ dividends, LWI has a dividend yield of 3.3%.
Peer group comparison
The AIC UK Equity Income peer group is one of the larger AIC sectors, with 24 constituents. Exhibit 7 shows the 12 largest, all of which have a market cap above £350m. LWI is towards the smaller end of this group. Its NAV total returns are broadly in line with or above average for the group over one, three, five and 10 years. Ongoing charges are below average, although LWI is the only fund in the group to charge a performance fee. The discount to NAV and the level of gearing are both higher than average. LWI’s dividend yield is a little below average, in line with its focus on sustainable dividend growth rather than a high headline yield.
Exhibit 7: AIC UK Equity Income investment trusts with market cap over £350m as at 14 June 2018*
% unless stated |
Market cap |
NAV TR |
NAV TR |
NAV TR |
NAV TR |
Ongoing |
Perf. |
Discount |
Net |
Dividend |
Lowland |
418.8 |
7.5 |
26.2 |
68.2 |
194.2 |
0.6 |
Yes |
(7.2) |
113 |
3.3 |
City of London |
1,553.6 |
4.0 |
22.7 |
54.2 |
136.4 |
0.4 |
No |
1.8 |
108 |
4.0 |
Diverse Income Trust |
407.9 |
9.1 |
32.9 |
93.7 |
|
1.2 |
No |
1.7 |
100 |
3.1 |
Dunedin Income Growth |
386.2 |
1.5 |
21.3 |
40.3 |
97.7 |
0.6 |
No |
(10.9) |
105 |
4.7 |
Edinburgh Investment |
1,393.1 |
(2.7) |
19.6 |
57.3 |
144.9 |
0.6 |
No |
(7.0) |
110 |
3.7 |
Finsbury Growth & Income |
1,379.3 |
14.1 |
48.6 |
103.0 |
328.6 |
0.7 |
No |
0.7 |
102 |
1.8 |
JPMorgan Claverhouse |
429.4 |
11.6 |
33.7 |
71.0 |
128.4 |
0.8 |
No |
(3.2) |
111 |
3.5 |
Merchants Trust |
578.4 |
13.1 |
27.9 |
51.5 |
117.0 |
0.6 |
No |
(6.9) |
116 |
4.7 |
Murray Income Trust |
529.9 |
1.6 |
24.5 |
44.3 |
110.6 |
0.7 |
No |
(7.0) |
105 |
4.1 |
Perpetual Income & Growth |
876.4 |
(2.3) |
10.4 |
49.9 |
147.5 |
0.7 |
No |
(11.7) |
112 |
3.8 |
Temple Bar |
893.4 |
7.7 |
26.2 |
48.9 |
193.7 |
0.5 |
No |
(6.1) |
101 |
3.2 |
Average |
804.2 |
5.9 |
26.7 |
62.0 |
159.9 |
0.7 |
(5.1) |
108 |
3.6 |
|
LWI rank in peer group |
9 |
6 |
6 |
4 |
2 |
7 |
9 |
2 |
8 |
Source: Morningstar, Edison Investment Research. Note: *Performance to 13 June 2018. TR=total return. Net gearing is total assets less cash and equivalents as a percentage of net assets (100 = ungeared).
The board
LWI has five independent, non-executive directors. Robert Robertson was appointed to the board in 2011 and became chairman in January 2017. Karl Sternberg and Kevin Carter both joined the board in 2009. Duncan Budge was appointed in 2014, while Gaynor Coley became a director in 2016 and was appointed chairman of the audit committee in 2017. The directors’ professional backgrounds are in industry, investment management and accountancy.
|
|
Research: Investment Companies
Martin Currie Global Portfolio Trust (MNP) aims to generate long-term capital growth and real dividend growth from a diversified portfolio of high-quality global equities. With a view to succession planning, effective from 30 June 2018, the trust will be co-managed by Zehrid Osmani, working alongside the incumbent manager, Tom Walker. Osmani previously worked at BlackRock and is now head of Martin Currie’s global long-term unconstrained team. He has 21 years’ investment experience. Data from Morningstar show that MNP’s historical investment returns have been achieved with lower volatility compared with the average of its peers in the AIC Global sector. The trust operates a zero discount policy and has a progressive dividend strategy. Its current yield is 1.7%. Changes to MNP’s fee structure will see the annual management charge reduced from 0.5% to 0.4% of NAV with effect from FY19.