Last close As at 05/08/2026
GBP3.50
— 0.00 (0.00%)
Market capitalisation
—
Research: Investment Companies
Martin Currie Global Portfolio Trust (MNP) aims to generate long-term capital growth and real dividend growth from a diversified portfolio of high-quality global equities. With a view to succession planning, effective from 30 June 2018, the trust will be co-managed by Zehrid Osmani, working alongside the incumbent manager, Tom Walker. Osmani previously worked at BlackRock and is now head of Martin Currie’s global long-term unconstrained team. He has 21 years’ investment experience. Data from Morningstar show that MNP’s historical investment returns have been achieved with lower volatility compared with the average of its peers in the AIC Global sector. The trust operates a zero discount policy and has a progressive dividend strategy. Its current yield is 1.7%. Changes to MNP’s fee structure will see the annual management charge reduced from 0.5% to 0.4% of NAV with effect from FY19.
Martin Currie Global Portfolio Trust |
Co-manager appointed as part of succession plan |
Investment trusts |
26 June 2018 |
Share price/discount performance
Three-year performance vs index
Gearing
Analysts
|
|||||||||||||||||||||||||||||||||||||||||||||||||||||||||||||||||||||||||||||||||||||||||||||
Martin Currie Global Portfolio Trust (MNP) aims to generate long-term capital growth and real dividend growth from a diversified portfolio of high-quality global equities. With a view to succession planning, effective from 30 June 2018, the trust will be co-managed by Zehrid Osmani, working alongside the incumbent manager, Tom Walker. Osmani previously worked at BlackRock and is now head of Martin Currie’s global long-term unconstrained team. He has 21 years’ investment experience. Data from Morningstar show that MNP’s historical investment returns have been achieved with lower volatility compared with the average of its peers in the AIC Global sector. The trust operates a zero discount policy and has a progressive dividend strategy. Its current yield is 1.7%. Changes to MNP’s fee structure will see the annual management charge reduced from 0.5% to 0.4% of NAV with effect from FY19.
12 months ending |
Share price |
NAV |
FTSE World |
FTSE All-Share |
31/05/14 |
7.4 |
5.3 |
7.0 |
8.9 |
31/05/15 |
15.3 |
15.9 |
15.8 |
7.5 |
31/05/16 |
(3.5) |
(2.1) |
0.6 |
(6.3) |
31/05/17 |
32.9 |
32.2 |
33.0 |
24.5 |
31/05/18 |
7.0 |
7.7 |
8.7 |
6.5 |
Source: Thomson Datastream. Note: All % on a total return basis in pounds sterling.
Investment strategy: Seeking high ROIC
Walker believes that companies generating high and sustainable returns on invested capital (ROIC) will outperform the broader market over the long term. He and his team undertake thorough fundamental research on potential investee companies, which includes a five-year price target and environmental, social and governance (ESG) analysis. While gearing of up to 20% of NAV is permitted, the trust runs a net cash balance; at end-May 2015, it was 1.3%.
Market outlook: Time to be more selective
In recent years, investors have enjoyed above-average returns from global equities as a result of synchronised economic growth, but also due to a re-rating in share prices. While robust corporate earnings growth remains supportive for further stock market appreciation, above-average equity valuations and ongoing macroeconomic issues, such as a potential trade war, may encourage investors to seek high-quality companies with strong market positions that are generating strong returns on invested capital.
Valuation: Shares trade close to NAV
As a result of MNP’s zero discount policy, which was adopted in 2013, its shares always trade close to NAV (in normal market conditions). The current 2.2% share price discount to cum-income NAV compares with the range of averages over the last one, three, and five years of 0.6% to 0.8%. MNP’s board has a progressive dividend policy; annual distributions have been increased or maintained every year since the fund was launched. Its current dividend yield is 1.7%.
Exhibit 1: Trust at a glance
Investment objective and fund background |
Recent developments |
||||||||||||||||||||||||||||||||||||||||||||||||||||||||||||||||||||||
Martin Currie Global Portfolio Trust’s objective is to achieve long-term capital growth in excess of the capital return of the benchmark FTSE World Index by investing in a diversified portfolio of international quoted investments. The benchmark was changed on 1 June 2011 from the FTSE All-Share Index to the FTSE World Index when the trust adopted a more global focus. |
■ 20 June 2018: Appointment of Zehrid Osmani as co-manager with effect from 30 June 2018. ■ 5 April 2018: Announcement of reduction in the fee structure (see page 7). ■ 5 April 2018: Annual report to 31 January 2018. NAV TR +11.9% versus benchmark TR +12.7%. Share price TR +12.4%. ■ 27 March 2018: Announcement of 1.5p fourth interim dividend for FY18 (flat year-on-year). |
||||||||||||||||||||||||||||||||||||||||||||||||||||||||||||||||||||||
Forthcoming |
Capital structure |
Fund details |
|||||||||||||||||||||||||||||||||||||||||||||||||||||||||||||||||||||
AGM |
June 2019 |
Ongoing charges |
0.68% (as at January 2018) |
Group |
Martin Currie Investment Mgmt. (UK) |
||||||||||||||||||||||||||||||||||||||||||||||||||||||||||||||||||
Interim results |
September 2018 |
Net cash |
1.3% |
Manager |
Tom Walker |
||||||||||||||||||||||||||||||||||||||||||||||||||||||||||||||||||
Year end |
31 January |
Annual mgmt fee |
0.4% |
Address |
Saltire Court, 20 Castle Terrace, Edinburgh EH1 2ES |
||||||||||||||||||||||||||||||||||||||||||||||||||||||||||||||||||
Dividend paid |
Jul, Oct, Jan, Apr |
Performance fee |
See page 7 |
||||||||||||||||||||||||||||||||||||||||||||||||||||||||||||||||||||
Launch date |
March 1999 |
Trust life |
Indefinite |
Phone |
+44 (0)131 229 5252 |
||||||||||||||||||||||||||||||||||||||||||||||||||||||||||||||||||
Continuation vote |
None |
Loan facilities |
None |
Website |
|||||||||||||||||||||||||||||||||||||||||||||||||||||||||||||||||||
Dividend policy and history (financial years) |
Share buyback policy and history (financial years) |
||||||||||||||||||||||||||||||||||||||||||||||||||||||||||||||||||||||
MNP moved to paying quarterly dividends from FY14 (previously semi-annual). Dividends are paid in July, October, January and April. The board is committed to a progressive dividend policy over the longer term. |
Renewed annually, the trust has authority to purchase up to 14.99%, and allot up to 10% of issued share capital. |
||||||||||||||||||||||||||||||||||||||||||||||||||||||||||||||||||||||
|
|
||||||||||||||||||||||||||||||||||||||||||||||||||||||||||||||||||||||
Shareholder base (as at 31 May 2018) |
Portfolio exposure by geography (as at 31 May 2018) |
||||||||||||||||||||||||||||||||||||||||||||||||||||||||||||||||||||||
|
|
||||||||||||||||||||||||||||||||||||||||||||||||||||||||||||||||||||||
Top 10 holdings (as at 31 May 2018) |
|||||||||||||||||||||||||||||||||||||||||||||||||||||||||||||||||||||||
|
|||||||||||||||||||||||||||||||||||||||||||||||||||||||||||||||||||||||
Source: Martin Currie Global Portfolio Trust, Edison Investment Research, Morningstar. Note: *N/A where not in end-May 2017 top 10.
Market outlook: Further upside likely more modest
Exhibit 2 (LHS) shows the performance of global and UK equities, in sterling terms, over the last five years. Returns for investors in overseas assets have meaningfully exceeded those of UK assets over the period, which has been helped by sterling weakness. Since early 2016, equities have delivered strong returns due to synchronised global economic growth and an upward revaluation in share prices. While both US and world equity valuations are above average (Exhibit 2, RHS), corporate earnings growth remains robust, which is supportive for further – albeit likely more modest – equity gains. With ongoing macroeconomic issues, such as trade tensions between the US and its overseas partners, investors seeking global equity exposure may be interested in a fund comprising high-quality companies generating strong returns on invested capital.
|
Exhibit 2: Market performance and valuation |
|||||||||||||||||||||||||||||||||||||||||||||||||||||||||||||||||||
FTSE World and FTSE All-Share indices (£ total return) last five years |
Valuation metrics of Datastream indices (25 June 2018) |
||||||||||||||||||||||||||||||||||||||||||||||||||||||||||||||||||
|
|
||||||||||||||||||||||||||||||||||||||||||||||||||||||||||||||||||
|
Source: Thomson Datastream, Edison Investment Research |
|||||||||||||||||||||||||||||||||||||||||||||||||||||||||||||||||||
Fund profile: Unconstrained global equity portfolio
MNP was launched in March 1999, originally investing in UK and global equities, along with an allocation to private equity. In 2007, the maximum permitted overseas equity allocation was increased from 25% to 50%. This limit was removed altogether in June 2011, when the trust adopted a more global focus, changing its name from Martin Currie Portfolio to Martin Currie Global Portfolio. Manager Tom Walker aims to generate long-term capital growth and real dividend growth from a diversified portfolio of 40-50 high-quality, primarily large-cap global equities. MNP is unconstrained in terms of market cap, geography or sector. Gearing of up to 20% of net assets is permitted, but the manager has not employed gearing since 2008. At end-May 2018, the trust had a net cash balance of 1.3%.
The board measures MNP via three key performance indicators: NAV total return performance versus the total return on the FTSE World index (over a rolling three-year period); the performance versus all peers in the AIC Global sector (over a rolling three-year period); and maintaining ongoing charges at less than 0.75%. Data from Martin Currie show that since launch to end-FY18, MNP’s NAV and share price total returns of 367.4% and 271.1% respectively have outpaced the 250.6% total return of the blended benchmark. Walker notes that the trust has lower volatility of returns than the average of the AIC Global sector, which he describes as “our niche in a crowded sector”.
With a view to succession planning, MNP recently announced the appointment of Zehrid Osmani as co-portfolio manager, who will work alongside Walker. Osmani has 21 years’ investment experience, most recently as head of European equities research at BlackRock, where he had a specific focus on unconstrained, high-conviction, long-term portfolios. He joined Martin Currie in May 2018 and is head of its global long-term unconstrained team.
The fund manager: Tom Walker
The manager’s view: Low interest rates supportive for equities
Regarding the current macroeconomic environment, Walker says there has not been much change in recent months. He believes that interest rates will remain low, which is supportive for global equities, but that total returns will be lower than investors have enjoyed in recent years. He notes geopolitical noise – such as the risk to global trade due to US protectionism and the discord at the recent G7 summit – which suggests that the higher levels of stock market volatility experienced in 2018, compared to the benign levels in 2017, may well continue.
Walker says that the key US economy is “trundling along”, noting that economic data are mixed and there are no inflation concerns. As a result, he expects a continuation in the moderate pace of US interest rate increases. Within Europe, the manager notes an economic deceleration, such as in Germany, which is an important driver for growth in the region, as well as the UK, where Brexit negotiations remain an overhang. However, this uncertainty should mean that sterling remains weak, which has positive currency translation effects for investors holding overseas equities. Walker believes that the majority of emerging market economies are “in good shape”. However, in the longer term, he remains concerned about the large build-up of debt, which he says has reached levels in the Western world last seen during the global financial crisis.
At the corporate level, the manager says companies are still generating good earnings growth, which in aggregate has been helped by lower US corporate tax rates, providing further support for equity returns. In Asia, the manager notes that positive earnings revisions continue. He notes the return of the Chinese consumer, in the form of higher demand for luxury goods, as concerns about a crackdown on conspicuous consumption appear to be waning. While global stock markets have taken a pause, the manager can still see mid- to high single-digit total returns on a 12-month view.
Asset allocation
Investment process: In-depth fundamental research
Walker aims to generate long-term capital growth from a diversified portfolio of high-quality global equities. He believes that companies with high and sustainable returns on invested capital (ROIC) outperform global indices over the long term. The manager says that focusing only on a company’s earnings does not take into account its returns on capital investment. He believes that high ROIC businesses are: sustainable over the long term; need less capex to sustain their growth; have higher cash available; and warrant higher valuation multiples. In conducting thorough fundamental research, which includes a five-year share price target, the manager is able to draw on the broad resources of Martin Currie’s 54-strong investment team. Team members have an average 14 years’ industry experience, and in aggregate meet with more than 1,100 companies each year. An analysis of a company’s environmental, social and governance (ESG) record is an increasingly important part of the investment process. Martin Currie is a signatory to the UN Principles for Responsible Investment. In 2017, for the first time, the company received an A+ rating in all three components: strategy and governance in the investment process; integration of ESG factors into its analytical work; and active ownership through engagement with investee company managements.
Current portfolio positioning
Comparing MNP’s portfolio against the index, it is similarly valued on a variety of metrics, has higher historic and forecast earnings growth, and is higher quality, based on measures such as return on equity, interest cover and balance sheet strength. The portfolio has a high active share of 90% (0% is full index replication and 100% means no commonality with the benchmark). Over time, the number of holdings has been reduced from c 70 to c 40. Portfolio turnover is typically 20-30% pa, but is currently running above 50%, as the manager is finding a number of attractive investment opportunities to replace lower-conviction positions. In terms of geographic exposure, over the last 12 months MNP’s North American exposure has reduced by 7.0pp and the trust is now underweight versus the benchmark. The largest increase over the period is in emerging markets (+5.9pp).
Exhibit 3: Portfolio geographic exposure vs FTSE World index (% unless stated)
Portfolio end- |
Portfolio end- |
Change |
Index |
Active weight |
Trust weight/ |
|
North America |
49.9 |
56.9 |
(7.0) |
58.5 |
(8.6) |
0.9 |
Europe (inc UK) |
26.0 |
22.0 |
4.0 |
21.5 |
4.5 |
1.2 |
Emerging markets |
9.3 |
3.5 |
5.9 |
4.5 |
4.8 |
2.1 |
Asia Pacific ex-Japan |
7.9 |
10.1 |
(2.2) |
6.2 |
1.7 |
1.3 |
Japan |
3.9 |
5.4 |
(1.4) |
9.1 |
(5.2) |
0.4 |
Israel |
2.9 |
2.2 |
0.7 |
0.2 |
2.7 |
14.7 |
Total |
100.0 |
100.0 |
100.0 |
Source: Martin Currie Global Portfolio Trust, Edison Investment Research. Note: Adjusted for cash.
On a sector basis (Exhibit 4), over the last 12 months the largest increase is industrials (+6.0pp), while the largest decrease is consumer services (-4.8pp). The manager notes that MNP has more technology exposure than the data suggest, as FTSE Russell categorises US companies Accenture and Automatic Data Processing as industrials and Visa as a financial, while Walker considers them all to be technology companies. Together, these three positions make up c 10% of the portfolio.
Exhibit 4: Portfolio sector exposure vs FTSE World index (% unless stated)
Portfolio end- |
Portfolio end- |
Change |
Index |
Active weight |
Trust weight/ |
|
Financials |
17.8 |
21.7 |
(3.9) |
21.4 |
(3.6) |
0.8 |
Technology |
17.5 |
14.5 |
3.0 |
14.5 |
3.0 |
1.2 |
Industrials |
17.1 |
11.2 |
6.0 |
13.3 |
3.8 |
1.3 |
Consumer goods |
11.2 |
12.7 |
(1.4) |
12.4 |
(1.2) |
0.9 |
Healthcare |
10.9 |
10.9 |
0.1 |
10.7 |
0.2 |
1.0 |
Consumer services |
9.9 |
14.7 |
(4.8) |
11.1 |
(1.2) |
0.9 |
Basic materials |
5.6 |
2.7 |
2.8 |
4.7 |
0.9 |
1.2 |
Telecommunications |
5.1 |
5.2 |
(0.1) |
2.6 |
2.5 |
1.9 |
Oil & gas |
3.1 |
4.6 |
(1.4) |
6.4 |
(3.3) |
0.5 |
Utilities |
1.6 |
1.8 |
(0.2) |
2.9 |
(1.3) |
0.6 |
Total |
100.0 |
100.0 |
100.0 |
Source: Martin Currie Global Portfolio Trust, Edison Investment Research. Note: Adjusted for cash.
New holdings in recent months include:
■
US-listed, global management consultant Accenture, which has a high-quality, end-to-end business model delivering a ROIC of c 55%;
■
UK innovative chemical company Croda, which has developed a range of environmentally friendly products for the personal care industry, which are plant- rather than hydrocarbon-based. It has a ROIC in excess of 20%;
■
Spanish apparel retailer Inditex (owner of Zara), which has a strong and differentiated business model in an industry that is experiencing a tough operating environment. It has the potential to increase its presence in the US and is generating a ROIC of more than 25%;
■
US precision instrument manufacturer Mettler Toledo, which has a ROIC of c 25%, with potential for even higher returns, led by an attractive organic growth profile; and
■
US coffee chain Starbucks, which is experiencing a turnaround in its domestic same-store sales and has a ROIC above 25%. The manager was able to initiate the position at a very attractive valuation.
Walker has taken significant profits in UK equipment rental company Ashtead. He is concerned that the company’s results will be materially affected if there is a period of lower demand. US insurer AIG was sold, as an anticipated business turnaround has not materialised. The manager has also taken profits in UK mining company, BHP, Chinese energy firm CNOOC, and Italian energy company Eni; all three have seen their share prices rally in response to higher commodity prices.
Performance: Benefiting from a global approach
Over the year to end-May 2018, MNP’s NAV and share price total returns of 7.7% and 7.0% respectively are behind the benchmark’s 8.7% total return. The main positive contributors to performance were Chinese multinational e-commerce company Alibaba (+1.19pp) and US financial services firm Visa (+0.76pp). The largest detractors were UK consumer goods manufacturer Reckitt Benckiser (-0.74pp) and US apparel retailer L Brands (-0.67pp).
|
Exhibit 5: Investment trust performance to 31 May 2018 |
||||||||
Price, NAV and benchmark total return performance, one-year rebased |
Price, NAV and benchmark total return performance (%) |
|||||||
|
|
|||||||
|
Source: Thomson Datastream, Edison Investment Research. Note: Three-, five- and 10-year performance figures annualised. Benchmark changed from FTSE All-Share to FTSE World on 1 June 2011. |
||||||||
|
Exhibit 6: Share price and NAV total return performance, relative to indices (%) |
||||||||
|
One month |
Three months |
Six months |
One year |
Three years |
Five years |
10 years |
|
Price relative to FTSE World |
(0.3) |
0.1 |
(0.1) |
(1.6) |
(5.6) |
(5.7) |
(7.4) |
|
NAV relative to FTSE World |
(0.2) |
0.0 |
(0.0) |
(0.9) |
(4.1) |
(5.5) |
(14.5) |
|
Price relative to FTSE All-Share |
0.5 |
(4.3) |
(3.0) |
0.4 |
10.4 |
16.9 |
21.9 |
|
NAV relative to FTSE All-Share |
0.6 |
(4.4) |
(2.9) |
1.1 |
12.2 |
17.1 |
12.5 |
|
|
Source: Thomson Datastream, Edison Investment Research. Note: Data to end-May 2018. Geometric calculation. |
||||||||
While MNP has lagged the FTSE World in most of the periods shown in Exhibit 6, it has meaningfully outperformed the FTSE All-Share index over three, five and 10 years, illustrating the potential benefits of investing in overseas rather than solely in UK equities.
|
Exhibit 7: NAV total return performance relative to blended benchmark over 10 years |
|
|
Source: Thomson Datastream, Edison Investment Research |
Discount: Trades close to par
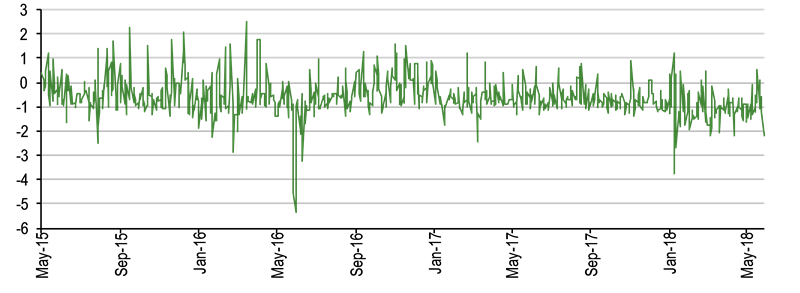
MNP has a zero discount policy, which was adopted in July 2013, ensuring that its shares trade at, or around NAV, in normal market conditions. So far in FY19, 3.2m shares (3.4% of the share count at end-FY18) have been repurchased at a cost of £7.5m. The current 2.2% share price discount to cum-income NAV compares with the range over the last 12 months of a 1.2% premium to a 3.8% discount. It compares with the average discounts of 0.8%, 0.6% and 0.6% over the last one, three and five years respectively.
|
Exhibit 8: Share price premium/discount to NAV (including income) over three years (%) |
|
|
Source: Thomson Datastream, Edison Investment Research |
Capital structure and fees
MNP is a conventional investment trust with one class of share. There are currently 89.2m ordinary shares in issue. Renewed annually, the trust has authority to repurchase up to 14.99% of its shares and allot up to 10% of its issued share capital in order to manage a discount or premium. Gearing has not been employed since 2008, although up to 20% of net assets is permitted. At end-May 2018, MNP had a net cash position of 1.3%.
On 5 April 2018, the board announced a new fee structure. Effective from 1 February 2018, the annual management fee will be reduced from 0.5% to 0.4% of NAV. Historically, a performance fee was payable if the increase in NAV per share exceeded the capital return of the benchmark FTSE World Index by more than one percentage point over the period since a performance fee was last earned. If the NAV had risen over the period, the performance fee was 15% of the outperformance, or 7.5% if the NAV had fallen, and was capped at 1% of net assets. No performance fee has been paid since FY12.
A new performance fee is effective from 1 February 2018. If MNP’s cumulative NAV outperformance versus the capital return of the FTSE World Index over the period to 31 January 2020 is greater than 1%, a performance fee is payable, which is 12.5% of the cumulative outperformance during the period. The percentage is not reduced if MNP’s NAV has fallen over that period. The performance fee remains capped at 1% of net assets. For subsequent periods, the performance period runs from 1 February following the last financial year end when a performance fee was paid to the end of the current financial year.
In FY18, MNP’s ongoing charges were 0.68%, which was 6bp lower than 0.74% in FY17, and well below the board’s 0.75% target.
Dividend policy and record
Since FY14, dividends are paid quarterly in July, October, January and April. The board has a progressive dividend policy; total annual distributions have been increased or maintained every year since the trust was launched in March 1999. Since launch, annual distributions have compounded at an annual rate of 6.4%. The total FY18 dividend of 4.2p was in line with FY17 and was 0.9x covered by income. At end-FY18, MNP had revenue reserves (before the final dividend payment) equivalent to c 1.4x the last annual dividend. MNP’s current dividend yield is 1.7%, which compares favourably to its peers in the AIC Global sector (Exhibit 9).
Peer group comparison
In Exhibit 9 we show the nine members of the AIC Global sector with more than 30% North American and less than 30% UK exposure. While MNP’s NAV total returns are below the averages over the periods shown, the manager notes that these have been achieved with lower than average volatility of returns. The majority of peers may also have benefited from the use of gearing in a rising stock market. Due to the trust’s zero discount policy, its shares continue to trade close to NAV. MNP’s dividend yield is the third-highest in the selected peer group.
Exhibit 9: Selected peer group as at 19 June 2018*
% unless stated |
Market |
NAV TR |
NAV TR |
NAV TR |
NAV TR |
Discount |
Ongoing |
Perf. |
Net |
Dividend |
Martin Currie Global Portfolio |
226.7 |
8.8 |
49.1 |
78.5 |
132.6 |
0.9 |
0.7 |
Yes |
100 |
1.7 |
Alliance Trust |
2,555.3 |
9.7 |
55.5 |
80.8 |
148.8 |
(6.7) |
0.6 |
No |
104 |
1.8 |
Brunner |
344.1 |
9.7 |
42.3 |
70.4 |
115.2 |
(9.2) |
0.7 |
Yes |
107 |
2.3 |
Edinburgh Worldwide |
496.4 |
38.5 |
80.9 |
153.8 |
225.2 |
1.3 |
0.9 |
No |
103 |
0.0 |
F&C Global Smaller Cos |
845.2 |
12.2 |
52.7 |
99.6 |
275.3 |
(2.0) |
0.5 |
No |
103 |
0.9 |
Foreign & Colonial Inv Trust |
3,773.6 |
11.7 |
57.3 |
93.7 |
161.0 |
(0.2) |
0.5 |
No |
105 |
1.5 |
Mid Wynd Int’l Inv Trust |
192.8 |
13.7 |
61.5 |
111.9 |
183.8 |
3.7 |
0.8 |
No |
100 |
1.0 |
Monks |
1,840.5 |
18.9 |
79.5 |
111.6 |
128.0 |
2.6 |
0.6 |
No |
101 |
0.2 |
Scottish Mortgage |
7,723.0 |
36.1 |
109.8 |
218.8 |
327.8 |
2.7 |
0.5 |
No |
101 |
0.6 |
Average (9 trusts) |
1,999.7 |
17.7 |
65.4 |
113.2 |
188.6 |
(0.8) |
0.6 |
103 |
1.1 |
|
MNP rank in peer group |
8 |
9 |
8 |
8 |
7 |
5 |
4 |
8 |
3 |
Source: Morningstar, Edison Investment Research. Note: *Performance data to 18 June 2018. TR = total return. Net gearing is total assets less cash and equivalents as a percentage of net assets (100 = ungeared).
The board
There are five directors on the board of MNP, all of whom are non-executive and independent of the manager. Chairman Neil Gaskell was appointed as a director in November 2011 and assumed his current role in May 2012. The other four board members and their dates of appointment are: Mike Balfour (senior independent director, January 2010), Gillian Watson (April 2013), and Marian Glen and Gary Le Sueur (both December 2016).
|
|
Research: Industrials
Medserv has announced the signature of a second contract for Shore Base Logistics for offshore Cyprus for an international oil company (IOC). Cyprus is a key growth driver for the company’s Integrated Logistic Support Services business. Overall, FY18 has started well for Medserv with contract wins establishing the company now in eight countries as tendering activity continues.