Sealegs Corporation
Written by
Sealegs Corporation |
Sea change |
H1 results |
Industrial engineering |
25 November 2015 |
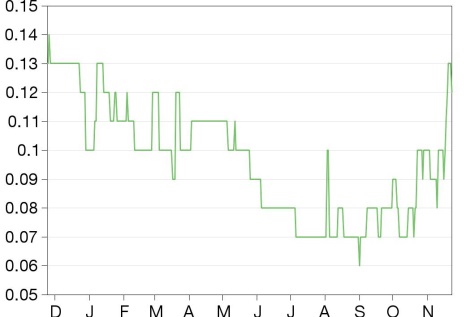
Share price performance
Business description
Next event
Analysts
Sealegs Corporation is a research client of Edison Investment Research Limited |
|||||||||||||||||||||||||||||||||||||||||||||||
Sealegs (SLG) reported better than expected H1 results, driven by tighter cost management and increased sales from the higher-margin amphibious enablement systems (AES) and B2B sales to hull manufacturers. Since reappointing founder David McKee Wright as CEO in November 2014, the Auckland-based company has focused on developing a licensing strategy for its amphibious enablement systems, which we see as a significant game-changer for Sealegs. The company has recently passed a number of milestones including producing its 1,000th amphibious boat, the launch of its nine-metre Interceptor and the IKA11 aimed at the international military market.
Year end |
Revenue (NZ$m) |
PBT* |
EPS* |
DPS |
P/E |
Yield |
03/14 |
16.8 |
(0.7) |
(0.6) |
0.0 |
N/A |
N/A |
03/15 |
17.3 |
(1.7) |
(1.4) |
0.0 |
N/A |
N/A |
03/16e |
18.4 |
0.2 |
0.1 |
0.0 |
N/A |
N/A |
03/17e |
20.3 |
0.9 |
0.6 |
0.0 |
20.0 |
N/A |
Note: *PBT and EPS are normalised, excluding intangible amortisation, exceptional items and share-based payments.
H1 update
Sealegs reported H1 net profit after tax of NZ$0.37m, up from NZ$0.03m year-on-year. Revenues were 3.5% lower at NZ$9.3m due to the shift in product mix to higher-margin OEM and amphibious enablement systems. As a consequence, the company’s gross margin increased 588bp to 28.9% in the six months to 30 September. Sealegs reported gross profit of NZ$2.7m vs NZ$2.2m y-o-y. The results also demonstrated good cost containment. Costs increased just 2.6% for the half year, with distribution declining 16% and marketing expenses falling 11% against a 13% increase in administrative costs.
Changing business mix
Since re-appointing founder David McKee Wright as CEO, Sealegs has focused on developing a licensing strategy for its AES. This change in strategy is expected to have a significant impact on the company’s profitability and capital requirements. The company noted in late-October that its strategy was already yielding results, with more than NZ$2.5m in orders from boat manufacturers in the first six months of FY16, compared with orders of NZ$0.5m for the same period in FY15. We anticipate that the higher-margin OEM strategy will gradually usurp boat sales, enabling Sealegs to reduce its cost base and capital tied up in boat manufacturing.
Valuation: New focus improves valuation
We value Sealegs at NZ$0.20/share using the DCF methodology (WACC of 17.3%, terminal rate of 2.0%). The company’s expansion into the hull manufacturer network and move away from boat manufacturing positions it to significantly improve operating margins and, therefore, cash flows. We are forecasting that operations will be fully cash generative from FY16 onwards.
H1 results
The numbers
Sealegs’ H1 results demonstrated improved margins as a result of good costs containment and a shift in the business mix to the higher-margin AES and B2B product offering. While revenues declined 3.5% due to higher sales of the lower-priced AES, Sealegs’ gross margin increased to 28.9% as a result of the higher margin it books on its AES. First half to September 2015 EBIT was NZ$0.4m vs NZ$0.04m for the same period in FY14/15 and a loss of NZ$0.57m in the first half of FY13/14. The company produced its best ever interim NPAT of NZ$0.37m with costs growth contained to 2.6%.
Exhibit 1: Sealegs H116 vs H115 and H114
Six months ending (in NZ$m) |
30 Sept 2013 |
30 Sept 2014 |
30 Sept 2015 |
Sale of goods |
7.86 |
9.04 |
8.90 |
Total revenue |
8.38 |
9.67 |
9.33 |
Cost of sales |
(6.32) |
(7.44) |
(6.63) |
Gross profit |
2.06 |
2.23 |
2.70 |
Gross profit margin (%) |
24.6 |
23.1 |
28.9 |
EBIT |
(0.57) |
0.04 |
0.40 |
Finance costs |
(0.02) |
(0.01) |
(0.04) |
PBT and impairment of assets |
(0.58) |
0.03 |
0.37 |
Share options expense (non-cash) |
(0.02) |
0.00 |
0.00 |
Tax expense |
0.00 |
0.00 |
0.00 |
Profit/loss attributable to shareholders |
(0.60) |
0.03 |
0.37 |
Diluted EPS (c/share) |
(0.51) |
0.05 |
0.02 |
Source: Company data
Distribution costs declined 16% for the period while marketing costs fell almost 11%. These declines helped offset an increase in administrative costs and occupancy costs, the latter brought about by the expansion of US warehousing. As shown in Exhibit 2, overall cost growth for the half year was contained to 2.6%.
Exhibit 2: Operating costs comparison
Six months ending September (in NZ$m) |
H115 |
H116 |
% chg |
Distribution |
0.242 |
0.203 |
(16.1) |
Marketing |
0.434 |
0.387 |
(10.8) |
Occupancy |
0.089 |
0.131 |
47.2 |
Administrative |
1.327 |
1.497 |
12.8 |
Research |
0.091 |
0.021 |
(77) |
Other |
0.014 |
0.085 |
N/A |
Total operating costs |
2.183 |
2.239 |
2.6 |
Source: Company data
Changing business mix
Sealegs’ improved operating margins are largely attributable to the change in business focus brought by CEO and co-founder David McKee Wright, who was re-appointed in November 2014. He has focused on improving the business mix and targeting the potentially lucrative emergency and armed services markets.
As a consequence, at the Auckland International Boat Show in September 2015, Sealegs launched two new models aimed at the international military market, the world’s largest amphibious rigid inflatable boat (RIB) and the nine-metre Interceptor-9000.
Sealegs has also been focused on developing a licensing strategy for its amphibious enablement systems. The company noted in late October that its strategy, still in its early stages, was yielding results with more than NZ$2.5m in orders from boat manufacturers in the first six months of FY16, compared with orders of NZ$0.5m for the same period in FY15. The company’s first OEM partners are Stabicraft and Smuggler Boats in New Zealand and ASIS Boats in the United Arab Emirates. Having successfully introduced its amphibious enablement systems to these hull manufacturers, Sealegs plans to seek out additional OEM partners for commercial and recreational applications.
Sealegs now has two amphibious enablement systems available to hull manufacturers: System 100, which is designed for craft up to 6t, and System 60, which is designed for craft up to 3t.
In FY15, Sealegs sold nine kits. In H116, the company sold eight systems comprising 5 OEM systems and 3 OEM hulls. The OEM systems retail at an average NZ$75,000 and a gross margin of ~40%, while the OEM hulls each generate around $230,000 in revenue for Sealegs and a gross margin of 35%. This compares with the average boat price of NZ$153,000, which in FY15 had a gross margin of 21.4%.
We view this change in strategy as significant. Sealegs has for the past 10 years been predominantly a boat manufacturer with capital tied up in stock, research and development and plant and equipment. The margins generated from boat sales were also lower than those that can be generated from the OEM systems.
Financials
We have incorporated the changing business mix into our forecasts for FY16 and beyond. Based on discussions with management, we anticipate that Sealegs will sell 10 OEM systems, 20 OEM hulls and 85 boats in FY16. We expect the focus on OEM to eventually overtake boat sales and have factored this into our forecasts. We anticipate that the higher-margin OEM hulls and systems will help drive profitability in FY16 and beyond. We are forecasting a significant lift in OEM hull sales from FY16 to FY17 as a result of Sealegs relationships with its OEM partners. Conversely, we are forecasting a drop in boat sales to 30 in FY17 compared with 85 in FY16, as part of the changing business mix. As previously noted, OEM hulls each generate an average of NZ$230,000 in sales for Sealegs, compared with the average NZ$153,000 boat sale. Margins on OEM hulls are also higher at 35%, compared with boat margins of 21.4%. As Exhibit 3 shows, we anticipate that Sealegs will post NPAT normalised of NZ$0.12m in FY16 and for profitability to strengthen in FY17 and FY18.
Exhibit 3: Edison P&L forecasts for FY16-18 vs FY15
NZ$m |
FY15 |
FY16e |
FY17e |
FY18e |
Number of boats sold |
101 |
85 |
30 |
15 |
Number of OEM hulls sold |
20 |
80 |
110 |
|
Number of OEm systems sold |
9 |
10 |
15 |
30 |
Sales revenue from boats |
15.5 |
13.0 |
4.4 |
2.2 |
Sales revenue from OEM hulls |
4.6 |
14.8 |
20.8 |
|
Sales revenue from OEM systems |
0.7 |
0.8 |
1.1 |
2.3 |
Sales from services rendered |
1.2 |
0.0 |
0.0 |
0.0 |
Total revenue |
17.33 |
18.36 |
20.28 |
25.22 |
Gross profit |
3.59 |
4.77 |
4.96 |
6.43 |
EBITDA |
(1.27) |
0.43 |
1.16 |
1.90 |
EBIT |
(1.67) |
0.09 |
0.81 |
1.56 |
PBT* |
(1.69) |
0.17 |
0.88 |
1.64 |
NPAT* |
(1.75) |
0.12 |
0.83 |
1.59 |
EPS* (c/share) |
(1.37) |
0.09 |
0.62 |
1.19 |
Source: Edison Investment Research. Note: *PBT, profit after tax and EPS are normalised, excluding intangible amortisation, exceptional items and share-based payments.
We also anticipate that the company has sufficient cash to execute its strategy. Sealegs last raised equity capital in November 2014, securing NZ$1.57m from the raise. At September 30, 2015, the company had NZ$0.8m cash in the bank. We are forecasting the company to end FY16 with NZ$1.46m cash, as its investment in the development of the IKA11 and Interceptor largely come to an end. We anticipate cash generation into FY17 and FY18 as Exhibit 4 demonstrates.
Exhibit 4: Cash flow forecasts for FY16-18 vs FY15
FY15 |
FY16e |
FY17e |
FY18e |
|
Operating cash flow |
1.1 |
0.5 |
1.2 |
1.9 |
Investing cash flow |
(1.5) |
(1.1) |
(0.4) |
(0.4) |
Cash flow from financing activities |
1.6 |
0.0 |
0.0 |
0.0 |
Net cash flows |
1.1 |
(0.7) |
0.7 |
1.5 |
Opening cash |
1.0 |
2.1 |
1.5 |
2.2 |
Closing cash |
2.1 |
1.5 |
2.2 |
3.7 |
Source: Edison Investment Research
Valuation
Our DCF valuation of Sealegs reflects the changing business mix and the potential to secure higher gross profit margins longer term. This in turn lowers the company’s risk profile with less capital, over time, required to be tied up in the manufacturing of boats as more of its business comes from its kits and deploying its intellectual capital.
That said, this strategy is still in its infancy and we see it prudent to continue to apply a conservative risk weighting to our valuation. As a consequence, we have used a WACC of 17.3% and a terminal growth rate of 2.0%. This, applied to our free cash flow forecasts, gives us a per share value of NZ$0.20 for the company, which represents a significant premium to the current share price of NZ$0.12.
Exhibit 5: DCF valuation
Valuation parameters |
|
WACC |
17.3% |
Terminal growth rate |
2.0% |
PV of free cash flows (in NZ$m) |
$6,345 |
Term val |
$17,596 |
NPV |
$23,942 |
Plus cash |
$1,457 |
Value (NZ$m) |
$25,398 |
Value per share (c/share) |
$0.20 |
Valuation parameters |
WACC |
Terminal growth rate |
PV of free cash flows (in NZ$m) |
Term val |
NPV |
Plus cash |
Value (NZ$m) |
Value per share (c/share) |
17.3% |
2.0% |
$6,345 |
$17,596 |
$23,942 |
$1,457 |
$25,398 |
$0.20 |
Source: Edison Investment Research
Exhibit 6: Financial summary
NZ$000s |
2012 |
2013 |
2014 |
2015 |
2016e |
2017e |
2018e |
||
Year-end 31 March |
IFRS |
IFRS |
IFRS |
IFRS |
|||||
PROFIT & LOSS |
|||||||||
Revenue |
|
|
13,830 |
16,407 |
16,783 |
17,330 |
18,355 |
20,275 |
25,223 |
Cost of Sales |
(10,360) |
(11,576) |
(12,639) |
(13,738) |
(13,584) |
(15,311) |
(18,797) |
||
Gross Profit |
3,470 |
4,831 |
4,144 |
3,592 |
4,771 |
4,964 |
6,426 |
||
EBITDA |
|
|
(1,206) |
804 |
(319) |
(1,269) |
434 |
1,155 |
1,899 |
Operating Profit (before amort. and except.) |
(1,559) |
445 |
(684) |
(1,616) |
(3) |
371 |
143 |
||
Intangible Amortisation |
(80) |
(93) |
(79) |
(56) |
(56) |
(56) |
(56) |
||
Operating Profit |
(1,639) |
352 |
(763) |
(1,672) |
87 |
807 |
1,559 |
||
Share based payments |
(182) |
(180) |
(42) |
(50) |
0 |
0 |
0 |
||
Exceptionals |
0 |
0 |
0 |
(598) |
0 |
0 |
0 |
||
Net Interest |
1 |
32 |
(28) |
(75) |
28 |
19 |
29 |
||
Profit Before Tax (norm) |
|
|
(1,558) |
476 |
(712) |
(1,691) |
172 |
882 |
1,645 |
Profit Before Tax (FRS 3) |
|
|
(1,820) |
204 |
(833) |
(2,396) |
115 |
826 |
1,589 |
Tax |
0 |
0 |
0 |
0 |
0 |
0 |
0 |
||
Profit After Tax (norm) |
(1,558) |
476 |
(791) |
(1,748) |
115 |
826 |
1,589 |
||
Profit After Tax (FRS 3) |
(1,820) |
204 |
(833) |
(2,396) |
115 |
826 |
1,589 |
||
Average Number of Shares Outstanding (m) |
124.3 |
122.9 |
121.7 |
127.8 |
133.5 |
133.5 |
133.5 |
||
EPS - normalised (c) |
|
|
(1.3) |
0.4 |
(0.6) |
(1.4) |
0.1 |
0.6 |
1.2 |
EPS - normalised fully diluted (c) |
|
|
(1.3) |
0.4 |
(0.6) |
(1.4) |
0.1 |
0.6 |
1.2 |
EPS - (IFRS) (c) |
|
|
(1.5) |
0.2 |
(0.7) |
(1.9) |
0.1 |
0.6 |
1.2 |
Dividend per share (c) |
0.0 |
0.0 |
0.0 |
0.0 |
0.0 |
0.0 |
0.0 |
||
Gross Margin (%) |
25.1 |
29.4 |
24.7 |
20.7 |
26.0 |
24.5 |
25.5 |
||
EBITDA Margin (%) |
-8.7 |
4.9 |
-1.9 |
-7.3 |
2.4 |
5.7 |
7.5 |
||
Operating Margin (before GW and except.) (%) |
-11.3 |
2.7 |
-4.1 |
-9.3 |
0.0 |
0.8 |
4.3 |
||
BALANCE SHEET |
|||||||||
Fixed Assets |
|
|
2,679 |
2,657 |
3,542 |
3,484 |
4,793 |
5,438 |
4,693 |
Intangible Assets |
474 |
612 |
1,826 |
2,058 |
2,472 |
2,343 |
2,334 |
||
Tangible Assets |
2,205 |
2,045 |
1,715 |
1,426 |
2,321 |
3,095 |
2,359 |
||
Investments |
0 |
0 |
0 |
0 |
0 |
0 |
0 |
||
Current Assets |
|
|
9,025 |
9,122 |
7,747 |
8,085 |
6,848 |
7,119 |
9,763 |
Stocks |
4,207 |
4,572 |
5,886 |
5,126 |
4,512 |
3,970 |
4,939 |
||
Debtors |
359 |
453 |
685 |
609 |
654 |
722 |
898 |
||
Cash |
4,322 |
3,909 |
997 |
2,123 |
1,457 |
2,201 |
3,700 |
||
Other |
137 |
187 |
179 |
226 |
226 |
226 |
226 |
||
Current Liabilities |
|
|
(2,232) |
(2,619) |
(2,788) |
(3,775) |
(3,733) |
(3,821) |
(4,132) |
Creditors |
(2,091) |
(2,619) |
(2,788) |
(3,775) |
(3,733) |
(3,821) |
(4,132) |
||
Short term borrowings |
(142) |
0 |
0 |
0 |
0 |
0 |
0 |
||
Long Term Liabilities |
|
|
(99) |
0 |
0 |
0 |
0 |
0 |
0 |
Long term borrowings |
(99) |
0 |
0 |
0 |
0 |
0 |
0 |
||
Other long term liabilities |
0 |
0 |
0 |
0 |
0 |
0 |
0 |
||
Net Assets |
|
|
9,373 |
9,160 |
8,501 |
7,794 |
7,909 |
8,736 |
10,324 |
CASH FLOW |
|||||||||
Operating Cash Flow |
|
|
(237) |
899 |
(1,300) |
1,080 |
462 |
1,175 |
1,929 |
Net Interest |
0 |
0 |
0 |
0 |
0 |
0 |
0 |
||
Tax |
0 |
0 |
0 |
0 |
0 |
0 |
0 |
||
Capex |
(748) |
(692) |
(1,734) |
(1,536) |
(1,133) |
(430) |
(430) |
||
Acquisitions/disposals |
621 |
5 |
55 |
0 |
4 |
0 |
0 |
||
Financing |
20 |
(296) |
68 |
1,570 |
0 |
0 |
0 |
||
Dividends |
0 |
0 |
0 |
0 |
0 |
0 |
0 |
||
Net Cash Flow |
(344) |
(84) |
(2,912) |
1,114 |
(666) |
744 |
1,499 |
||
Opening net debt/(cash) |
|
|
(4,410) |
(4,082) |
(3,909) |
(997) |
(2,123) |
(1,457) |
(2,201) |
HP finance leases initiated |
0 |
0 |
0 |
0 |
0 |
0 |
0 |
||
Other |
17 |
(90) |
0 |
12 |
(0) |
0 |
0 |
||
Closing net debt/(cash) |
|
|
(4,082) |
(3,909) |
(997) |
(2,123) |
(1,457) |
(2,201) |
(3,700) |
Source: Sealegs accounts, Edison Investment Research
|