Martin Currie Asia Unconstrained Trust (MCP) aims to generate returns at least in-line with Asia ex-Japan nominal GDP growth. It follows a bottom-up approach to stock-picking and uses detailed ‘forensic accounting’ assessments to build a high-conviction portfolio of 20 to 30 stocks, with a long-term view. The trust has persistently traded at a deep discount, but there is scope for this to narrow following a recent change in the dividend policy, which has lifted its yield to 4.0%, while maintaining the investment strategy. MCP’s yield now compares favourably against peers and could attract new interest from income focused investors.
Written by
Martin Currie Asia Unconstrained Trust |
Scope for narrower discount |
Investment trusts |
23 November 2017 |
Share price/discount performance
Three-year performance vs index
Gearing
Analysts
|
|||||||||||||||||||||||||||||||||||||||||||||||||||||||||||||||||||||||||||||||||||||||||||||
Martin Currie Asia Unconstrained Trust (MCP) aims to generate returns at least in-line with Asia ex-Japan nominal GDP growth. It follows a bottom-up approach to stock-picking and uses detailed ‘forensic accounting’ assessments to build a high-conviction portfolio of 20 to 30 stocks, with a long-term view. The trust has persistently traded at a deep discount, but there is scope for this to narrow following a recent change in the dividend policy, which has lifted its yield to 4.0%, while maintaining the investment strategy. MCP’s yield now compares favourably against peers and could attract new interest from income focused investors.
12 months ending |
Share price |
NAV |
Blended |
MSCI AC Asia ex-Japan (%) |
3Y GDP growth Asia ex-Japan (%) |
31/10/13 |
18.7 |
14.1 |
17.9 |
10.8 |
13.9 |
31/10/14 |
(1.5) |
0.0 |
1.6 |
6.4 |
10.1 |
31/10/15 |
(6.9) |
(8.4) |
7.7 |
(3.6) |
7.7 |
31/10/16 |
32.9 |
34.9 |
8.6 |
35.2 |
8.6 |
31/10/17 |
19.0 |
16.3 |
10.8 |
20.3 |
10.8 |
Source: Thomson Datastream, IMF, Edison Investment Research. Note: All % on a total return basis in GBP. *Blended benchmark is MSCI AC Asia Pacific Index (Japan fixed at 40%) until 30 June 2008, MSCI AC Asia Pacific Index from 1 July 2008 to 30 June 2011, MSCI AC Asia Pacific Index (Japan fixed at 25%) from 1 July 2011 to 10 July 2014, and three-year rolling nominal Asian GDP growth from 11 July 2014.
Investment strategy: Forensic, bottom-up approach
Lead manager, Andrew Graham and his team seek to identify 20 to 30 high-conviction stocks, across a broad range of sectors, which exhibit financial strength, sound management and good corporate governance. Stocks are purchased with a ‘buy and hold’ view, which is reflected in MCP’s low turnover, typically 12-13% pa. To support this high-conviction approach, the investment process involves rigorous bottom-up analysis by a team of experienced specialists, involving ‘forensic accounting’ assessments.
Market outlook: Favourable outlook for Asia
The economic backdrop of synchronous global growth and easy monetary conditions is favourable for Asian equities. Asian GDP growth is expected to continue to outpace global growth, underpinned by favourable demographic and urbanisation trends, and a rapidly growing middle-class driving consumption. Meanwhile, strong and reform-minded leaders are driving higher public spending trends across the region. Together, these factors augur well for a continued earnings recovery in the region.
Valuation: Attractive dividend may narrow discount
MCP currently trades at a 13.0% discount to cum-income NAV. The board is committed to narrowing the trust’s discount and implemented a change in dividend policy in April 2017, allowing an additional payment from capital. This has effectively increased the FY17 dividend by 110% over the previous year, bringing MCP’s yield to 4.0%, which compares favourably against the peer group. This change and the board’s ongoing activities to promote the trust could lead to a narrowing of MCP’s discount.
Exhibit 1: Trust at a glance
Investment objective and fund background |
Recent developments |
||||||||||||||||||||||||||||||||||||||||||||||||||||||||||||||||||||||
Martin Currie Asia Unconstrained Trust aims to achieve returns commensurate with Asia ex-Japan nominal GDP growth, unconstrained by an equity benchmark, over a long-term time horizon from a concentrated portfolio of 20-30 stocks. Before its change of investment objective in July 2014, it invested in a pan-Asian portfolio with a benchmark of MSCI AC Asia Pacific (Japan fixed at 25%). |
■ 5 July 2017: AGM – shareholders approved proposed changes to the dividend policy, allowing additional payments from capital. ■ 25 May 2017: Annual report for 12 months ending 31 March 2017. NAV TR +33.5% versus benchmark TR+9.3%. Share price TR +33.5%. ■ 4 April 2017: Proposed change in dividend policy, subject to shareholder approval at July 2017 AGM. |
||||||||||||||||||||||||||||||||||||||||||||||||||||||||||||||||||||||
Forthcoming |
Capital structure |
Fund details |
|||||||||||||||||||||||||||||||||||||||||||||||||||||||||||||||||||||
AGM |
July 2018 |
Ongoing charges |
FY17 1.1% (see page 7) |
Group |
Martin Currie Investment Management |
||||||||||||||||||||||||||||||||||||||||||||||||||||||||||||||||||
Interim results |
November 2017 |
Net gearing |
1.3% |
Manager |
Andrew Graham |
||||||||||||||||||||||||||||||||||||||||||||||||||||||||||||||||||
Year end |
31 March |
Annual mgmt fee |
Tiered, 0.60-0.75% of net assets |
Address |
Saltire Court, 20 Castle Terrace, Edinburgh EH1 2ES |
||||||||||||||||||||||||||||||||||||||||||||||||||||||||||||||||||
Dividend paid |
December and August |
Performance fee |
None |
||||||||||||||||||||||||||||||||||||||||||||||||||||||||||||||||||||
Launch date |
1985 |
Trust life |
Indefinite |
Phone |
0131 229 5252 |
||||||||||||||||||||||||||||||||||||||||||||||||||||||||||||||||||
Continuation vote |
Three-year, next in 2018 |
Loan facilities |
£15m (see page 7) |
Website |
|||||||||||||||||||||||||||||||||||||||||||||||||||||||||||||||||||
Dividend policy and history (financial years) |
Share buyback policy and history (financial years) |
||||||||||||||||||||||||||||||||||||||||||||||||||||||||||||||||||||||
MCP pays dividends twice a year in December and August. MCP has recently changed its dividend policy (see details on page 7). |
MCP is authorised to repurchase up to 14.99% and allot up to 5% of its ordinary shares. A tender offer for 10% of the issued shares was made in July 2014. |
||||||||||||||||||||||||||||||||||||||||||||||||||||||||||||||||||||||
|
|
||||||||||||||||||||||||||||||||||||||||||||||||||||||||||||||||||||||
Shareholder base (as at 31 October 2017) |
Portfolio exposure by sector (as at 31 October 2017) |
||||||||||||||||||||||||||||||||||||||||||||||||||||||||||||||||||||||
|
|
||||||||||||||||||||||||||||||||||||||||||||||||||||||||||||||||||||||
Top 10 holdings (as at 31 October 2017) |
|||||||||||||||||||||||||||||||||||||||||||||||||||||||||||||||||||||||
|
|||||||||||||||||||||||||||||||||||||||||||||||||||||||||||||||||||||||
Source: Martin Currie Asia Unconstrained Trust, Edison Investment Research, Bloomberg, Thomson Reuters. Note: *N/A where not in October 2016 top 10.
Market outlook: Good environment for Asian equities
The economic backdrop has been favourable for Asian equities, with synchronous global growth, abundant liquidity and low interest rates. Central banks around the world have started, or are poised, to raise interest rates and reduce the size of their balance sheets; however, this should happen gradually and cautiously, leaving monetary conditions relatively benign for the time being.
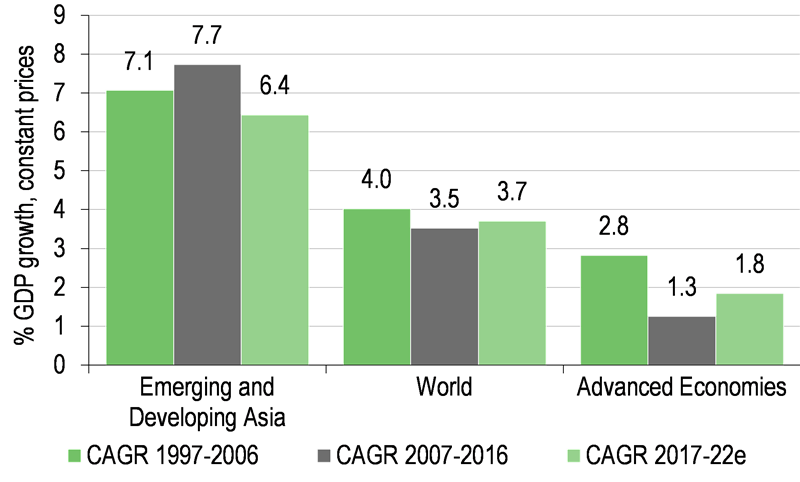
As shown in Exhibit 2 (LHS), the IMF expects economic growth in Asia for the five years 2017-22 to moderate to 6.4% pa from 7.7% pa between 2007 and 2016. Nevertheless, this level of growth is significantly greater than is forecast for global GDP, and more than triple the level expected for advanced economies. Asian growth continues to be supported by a number of secular factors, including favourable demographics, urbanisation trends and a rising middle-class. Meanwhile, the political backdrop is also relatively favourable with strong and reform-minded leaders supportive of higher public spending. Examples include Xi Jinping in China and Narendra Modi in India, who lead the two fastest growing and most populous countries. Both countries benefit from well-consolidated political mandates, which will help support the implementation of ambitious economic and reform plans for their respective nations.
Asian stock markets have performed strongly since the beginning of 2016 and are now at valuations that are no longer cheap, approaching a forward P/E multiple of 14x. However, as shown in the right hand chart of Exhibit 2, Asia represents relative value when compared to global equities, trading at steep 15.7% discount to the World index.
|
Exhibit 2: Emerging Asia vs advanced and world markets – GDP growth and valuation metrics |
|
GDP growth rates – emerging Asia vs advanced economies and world |
DS Asia ex-Japan vs DS World valuation comparison |
|
|
|
Source: IMF WEO October 2017, Thomson Datastream, Edison Investment Research |
|
Fund profile: Unconstrained, high-conviction
MCP is not constrained by a benchmark; instead, its objective is to generate returns that are at least in-line with Asia ex-Japan’s nominal GDP growth (on a rolling three-year basis). MCP adopted Martin Currie’s successful Asia Long-Term Unconstrained (ALTU) mandate, managed by Andrew Graham, in July 2014. The ALTU strategy aims to achieve its objective through investing, with a long-term horizon, in a concentrated, high-conviction portfolio of c 20 to 30 companies with high and sustainable returns. The managers follow a rigorous bottom-up strategy led by Graham, and a team of six Asia investment specialists based in Edinburgh and Asia. All ALTU strategies are managed in essentially the same way and by the same team, accommodating for mandate specific variations, which in the case of MCP as an investment trust, allows for gearing and dividend payments. The combined assets of the ALTU strategies are c £2bn.
The fund manager: Andrew Graham and team
The manager’s view: Positive prospects for earnings recovery
Andrew Graham believes the environment is favourable for Asian equities and, in particular, for the ALTU strategy. A global bias for tightening notwithstanding, companies should still benefit from “benign growth” in economies and low interest rates. While there will be companies with weaker businesses and balance sheets that could suffer as interest rates rise, these are not the types of companies that are investment candidates for MCP. Meanwhile, the manager believes the earnings recovery in Asia will likely continue and observes the ratio of earnings upgrades to downgrades is at its most favourable in the past seven to eight years. Nine of twelve countries observed are showing a positive earnings revision trend. Furthermore, the improvement in earnings is getting more broad-based, having initially been polarised among several large names in the technology sector. MSCI consensus earnings expectations for 2017 are around +22% and just +12% for 2018. However, Graham believes Asia’s earnings recovery cycle is far from mature and expects consensus estimates to be revised upwards over the coming quarters. This should be positive for Asian equities.
The manager notes Asia is benefitting from reform-minded leaders. Public spending in the region has been rising in many countries including China, India, Thailand, Indonesia and Malaysia, but he believes the positive economic impact from these investments are yet to be felt. Most of the investment has been in infrastructure, which augurs well for future economic growth and corporate earnings. Graham is particularly excited about rising consumption in Asia, underpinned by urbanisation, rising incomes and the rapid expansion of a populous middle-class. He believes rising Asian consumption is a secular, multi-decade investment theme and a significant engine of global growth.
Valuations have recovered from the depressed levels seen some 18 months ago, however, the manager thinks Asia offers good value compared with many other asset classes, in particular US and Japan equities. Measured on a prospective P/E basis, Asian markets appear in-line with to slightly more expensive than their long-term averages, but not to an extent that causes Graham to worry. On other valuation metrics, such as P/BV and EV/EBITDA, Asia appears less stretched. Earnings prospects are attractive, while returns on equity (ROE) have been improving and are now comparable with those of global equities, after a prolonged period of sub-par returns.
Asset allocation
Investment process: Forensic approach to analysis
With less than 30 holdings in the portfolio against a universe of stocks of around 1,200 names, the investment process is highly selective and based on fundamentals. The manager aims to find companies that have the potential for long-term cash generation, can deliver returns above their cost of capital, and are allocating capital efficiently. Visiting companies and meeting managements are an important part of the investment process. Around 200 companies pass the manager’s initial screening to form the investible universe. These are subject to rigorous fundamental assessment and around 10 to 25 companies a year undergo a further ‘forensic analysis’ to be considered for the portfolio. This exercise involves a detailed review of five years of financial statements, focusing on the quality of earnings and health of balance sheets to generate an ‘accounting diagnostic report’. The manager estimates around 250 man-hours of specialist analysts’ time is expended on this process, reflecting the resources available to MCP. Integrated into this analysis is a deep understanding of a company’s fundamental growth drivers and its management’s approach to corporate governance and alignment of interests with minority shareholders. This in-depth process allows the manager to construct a portfolio of 20 to 30 high-conviction investments in which it takes a long-term ‘buy and hold’ position. Risk is mitigated through the in-depth understanding of each company, ongoing monitoring of the companies and portfolio diversification. Although the portfolio is concentrated, correlation between stocks is low.
Current portfolio positioning
As at end October 2017, MCP held 26 stocks with the top 10 positions accounting for 54.5% of the portfolio. Consistent with the manager’s long-term investment horizon and stock selection discipline, there has been little portfolio activity over the past six months, although there are several investment candidates under consideration. MCP’s portfolio turnover is typically 12-13% pa.
The most recent purchase was Hong Kong-listed Guangdong Investment (GDI) in April 2017. GDI is a conglomerate whose main business is supplying natural water to Hong Kong. The company has predictable and strong cash flow, supporting a generous dividend yield, which the manager believes will likely increase over time. Management exhibits good capital deployment discipline, requiring investments to meet a minimum rate of return. The purchase was funded through the sale of Hong Kong energy utility, Hong Kong & China Gas on the grounds of expensive valuation, and Macau casino operator SJM Holdings (SJM). SJM’s business environment has been more challenging than anticipated over recent years due to China policy changes, while risks are rising as the company embarks on a large, multi-year construction commitment.
The largest sector within the portfolio is information technology at 29.3% and the two largest holdings are Tencent Holdings and Samsung Electronics. As shown in Exhibit 1, together they account for 14.8% of the portfolio, up from 11.7% a year ago, largely due to strong performance. Although these technology companies (alongside the portfolio’s fourth largest holding, Taiwan Semiconductor Manufacturing) have performed strongly, and are now very large, the manager believes their economies of scale significantly enhances their long-term potential and profitability. Reflecting Graham’s positive views for rising Asian consumption trends, the second largest exposure in the portfolio is to the consumer discretionary sector, at 21.8% of the portfolio.
Compared to the MSCI Asia ex-Japan index, as shown in Exhibit 4, the MCP portfolio is more expensively valued than the index in forward P/E and EV/EBITDA terms, although it has a lower price-to-book ratio. It also exhibits higher ‘quality’ characteristics, including stronger balance sheets with aggregate net cash, and higher returns on equity and dividend yield.
|
Exhibit 3: Geographical exposure at 31 October 2017 |
Exhibit 4: Portfolio characteristics |
||||||||||||||||||||||||
|
|
||||||||||||||||||||||||
|
Source: Martin Currie Asia Unconstrained Trust, Edison Investment Research. Note: Net of gearing. |
Source: Martin Currie and UBS PAS, as at 31 October 2017. Note: *Indicates consensus. |
|
Exhibit 3: Geographical exposure at 31 October 2017 |
||||||||||||||||||||||||
|
||||||||||||||||||||||||
|
Source: Martin Currie Asia Unconstrained Trust, Edison Investment Research. Note: Net of gearing. |
||||||||||||||||||||||||
|
Exhibit 4: Portfolio characteristics |
||||||||||||||||||||||||
|
||||||||||||||||||||||||
|
Source: Martin Currie and UBS PAS, as at 31 October 2017. Note: *Indicates consensus. |
Performance: Lower-risk returns
MCP’s objective is to achieve returns commensurate to Asia ex-Japan nominal GDP growth. Its NAV total return has meaningfully outperformed its blended benchmark for all periods shown in Exhibit 7, with the exception of three months, however, it has lagged the MSCI AC Asia ex-Japan index. Annual volatility, though, is lower compared to the index. Exhibit 5 shows data for the ALTU strategy since its inception in October 2008, which MCP adopted in July 2014. The chart shows annual volatility for the ALTU strategy over this period at 12.9%, versus the index at 17.3%. It has participated in much of the market gains in months when returns were positive, and participating in a smaller proportion of market losses in months with negative returns.
|
Exhibit 5: ALTU NAV volatility and upside/downside participation to 31 October 2017 |
Exhibit 6: Price, NAV and blended benchmark total return performance (%) |
|||||||
|
|
|||||||
|
Source: Martin Currie Asia Unconstrained Trust. Note: ALTU strategy inception date is 31 October 2008. |
Source: Thomson Datastream, Martin Currie Asia Unconstrained Trust. Note: Three- and five-year and since change of strategy (SC) performance is annualised. Data to 31 October 2017. |
|||||||
|
Exhibit 7: Share price and NAV total return performance, relative to indices (%) |
||||||||
|
One month |
Three months |
Six months |
One year |
SC |
Three years |
Five years |
|
Price relative to blended benchmark |
2.4 |
(3.6) |
1.5 |
7.4 |
17.3 |
13.6 |
10.9 |
|
NAV relative to blended benchmark |
3.7 |
(1.9) |
3.7 |
4.9 |
17.0 |
10.8 |
5.6 |
|
Price relative to MSCI AC Asia ex-Japan |
(2.2) |
(5.7) |
(7.0) |
(1.0) |
(5.9) |
(6.0) |
(6.9) |
|
NAV relative to MSCI AC Asia ex-Japan |
(1.0) |
(4.1) |
(5.1) |
(3.3) |
(6.2) |
(8.3) |
(11.3) |
|
Price relative to MSCI World |
0.4 |
(4.2) |
0.4 |
4.9 |
(4.9) |
(4.9) |
(20.1) |
|
NAV relative to MSCI World |
1.8 |
(2.6) |
2.5 |
2.4 |
(5.2) |
(7.3) |
(23.9) |
|
|
Source: Thomson Datastream, Edison Investment Research. Note: Data to 31 October 2017. Geometric calculation. SC = since change of investment objective on 11 July 2014. |
||||||||
Discount: Policy change may lead to a lower discount
MCP currently trades on a discount to cum-income NAV of 13.0%, close to the three-year average of 13.6%, and well within the range of 7.6% to 20.9%. The board is committed to managing the trust’s discount and in April 2017, in response to investors’ appetite for yield, proposed a new dividend policy to pay a distribution of capital of 2% of year-end NAV in addition to the existing distribution from revenue income. This effectively more than doubled the dividend yield, with no change to the investment strategy. MCP now has one of the highest yields amongst its peers (see Exhibit 9), which may attract new investors with a focus on income without alienating its existing shareholder base, and lead to a narrowing of the discount over time. The board also has the ability to repurchase and cancel shares to help manage the discount; however, no repurchases have taken place since June 2016.
|
Exhibit 8: Share price discount to NAV (including income) over three years (%) |
|
|
Source: Thomson Datastream, Edison Investment Research |
Capital structure and fees
MCP is a conventional investment trust with one class of share; there are currently 36.1m ordinary shares outstanding and a further 3.4m shares held in treasury. The trust has the authority (renewable annually) to buy back up to 14.99% of shares in issue, although the last repurchases were in June 2016 (see Exhibit 1). MCP has a £15m loan facility with RBS and as at end-September 2017, the company had gross gearing of 3.2% and net gearing of 1.3%.
Martin Currie is paid an annual management fee, which is calculated quarterly, of 0.75% of net assets up to £150m and 0.60% on net assets above £150m. This is allocated one-third to revenue and two-thirds to capital to reflect the board’s expected long-term split of returns in terms of income and capital gains. For the FY17 ended March 2017, the ongoing charge was 1.1%.
Dividend policy and record
MCP pays dividends twice a year in December and August. A new dividend policy was approved at the July 2017 AGM to make payments from capital, set at 2% of the company’s year-end ex-income NAV. The dividend from capital is payable in August and will be in addition to dividends from revenue income, payable in December and August. There is no change to the investment policy and the manager will retain all elements of the ALTU strategy without shifting focus to meet higher income needs. The effect of the new policy has been to increase the FY17 dividend to 16.28p from 7.75p in FY16, doubling the yield to around 4%. The board intends for this new policy to endure, however, it is subject to review in the event of changes in market conditions or shareholder expectations, and in the event the trust incurs a financial year capital loss.
Peer group comparison
MCP adopted the ALTU strategy, managed by Andrew Graham, in July 2014, therefore the most relevant peer group comparison periods shown in Exhibit 9 are one and three years. The trust’s NAV total return over one year is slightly above the peer group average, ranking seventh out of 15 trusts. MCP’s dividend yield of 4.0% ranks fifth among peers, although it is broadly comparable with the income focused funds, which yield between 3.6% and 5.5%. Although narrowing since April 2017, the trust’s discount to NAV remains wider than the rest of its peers.
Exhibit 9: AIC Asia Pacific ex-Japan peer group as at 22 November 2017*
% unless stated |
Market cap £m |
NAV TR |
NAV TR |
NAV TR |
NAV TR 10 year |
Discount (ex-par) |
Ongoing charge |
Perf. |
Net gearing |
Dividend yield (%) |
Martin Currie Asia Unconstrained |
148.5 |
27.3 |
46.0 |
68.4 |
76.0 |
(11.6) |
1.1 |
No |
101 |
4.0 |
Aberdeen Asian Income |
399.0 |
17.1 |
32.8 |
48.0 |
212.2 |
(6.9) |
1.2 |
No |
108 |
4.3 |
Aberdeen Asian Smaller |
366.2 |
11.3 |
27.8 |
55.4 |
296.0 |
(11.2) |
1.7 |
No |
110 |
1.1 |
Aberdeen New Dawn |
280.2 |
27.4 |
42.7 |
60.3 |
158.3 |
(11.5) |
0.9 |
No |
109 |
1.8 |
Edinburgh Dragon |
711.8 |
22.8 |
41.0 |
58.7 |
169.1 |
(12.5) |
1.0 |
No |
104 |
0.9 |
Fidelity Asian Values |
261.3 |
11.9 |
61.7 |
107.9 |
160.8 |
(6.0) |
1.3 |
No |
100 |
1.2 |
Henderson Far East Income |
447.7 |
17.9 |
39.5 |
61.3 |
128.1 |
2.3 |
1.1 |
No |
105 |
5.5 |
Invesco Asia |
216.1 |
31.8 |
67.8 |
120.5 |
212.7 |
(9.3) |
1.0 |
No |
100 |
1.4 |
JPMorgan Asian |
355.6 |
41.5 |
80.5 |
112.3 |
106.3 |
(11.8) |
0.8 |
No |
100 |
4.5 |
Pacific Assets |
303.3 |
12.7 |
39.5 |
90.0 |
101.0 |
(4.8) |
1.3 |
No |
100 |
0.9 |
Pacific Horizon |
179.9 |
52.2 |
75.0 |
113.2 |
124.0 |
(9.3) |
1.1 |
No |
108 |
0.0 |
Schroder Asia Pacific |
792.8 |
38.2 |
74.2 |
107.1 |
198.0 |
(9.9) |
1.1 |
No |
107 |
1.0 |
Schroder Asian Total Return Inv. Co |
291.6 |
38.8 |
81.6 |
107.0 |
148.0 |
1.2 |
1.0 |
Yes |
110 |
1.6 |
Schroder Oriental Income |
647.9 |
15.5 |
48.4 |
84.3 |
201.4 |
2.9 |
0.9 |
Yes |
100 |
3.6 |
Scottish Oriental Smaller Cos |
327.2 |
15.7 |
37.5 |
79.4 |
295.3 |
(11.5) |
1.2 |
Yes |
100 |
1.1 |
Average |
381.9 |
25.5 |
53.1 |
84.9 |
172.5 |
(7.3) |
1.1 |
104 |
2.1 |
|
Rank in sector (out of 15 trusts) |
15 |
7 |
8 |
10 |
15 |
13 |
6 |
9 |
5 |
Source: Morningstar, Edison Investment Research. Note: *Performance data to 20 November 2017. TR=total return. Net gearing is total assets less cash and equivalents as a percentage of net assets.
The board
MCP’s board consists of five independent non-executive directors. Harry Wells, chairman, was appointed to the board in 2003 and assumed his current role in 2014. Gregory Shenkman, appointed in 2007, is the senior independent director. Peter Edwards was appointed in 2007 and Anja Balfour in 2012. The most recent appointment in 2015 is Martin Shenfield. The directors have backgrounds in asset management, finance and law.
|
|
Sarine’s ytd (Jan to Sep) profitability was relatively subdued, with lower equipment sales due to excess midstream inventories in Q2 and Q3, as well as the illicit actions of competitors. Simultaneously, Sarine incurred considerable R&D costs related to the development of Clarity and Colour grading technology and Sarine Profile. This was further exacerbated by the strengthening of the Israeli shekel. However, downstream demand remains strong (according to the company), while new products and lower R&D expenses should support earnings going forward. Sarine trades on a P/E of 16.3x FY17e, a 35% discount to the peer group.