Share’s first half results were marked by higher revenues and costs than expected, while assets under administration have continued to grow and the digital transformation programme has progressed further both behind the scenes and in the client interface. Share’s credibility as a partner or purchaser of books of business is underlined by agreements to three further transactions that are set to scale the business significantly. This in turn should help underpin the geared improvement in profits required to drive the value of the business.
Written by
Share |
Scaling up |
H118 results |
Financial services |
3 September 2018 |
Share price performance
Business description
Next events
Analysts
Share is a research client of Edison Investment Research Limited |
|||||||||||||||||||||||||||||||||||||||||||||||
Share’s first half results were marked by higher revenues and costs than expected, while assets under administration have continued to grow and the digital transformation programme has progressed further both behind the scenes and in the client interface. Share’s credibility as a partner or purchaser of books of business is underlined by agreements to three further transactions that are set to scale the business significantly. This in turn should help underpin the geared improvement in profits required to drive the value of the business.
Year end |
Revenue (£m) |
PBT* |
EPS* |
DPS |
P/E |
Yield |
12/16 |
14.6 |
0.0 |
0.00 |
0.25 |
N/A |
1.0 |
12/17 |
18.7 |
0.4 |
0.27 |
0.40 |
92.8 |
1.6 |
12/18e |
20.5 |
0.8 |
0.44 |
0.55 |
57.9 |
2.2 |
12/19e |
21.6 |
1.1 |
0.63 |
0.70 |
40.8 |
2.7 |
Note: *PBT and EPS are normalised, excluding amortisation of acquired intangibles, exceptional items and share-based payments.
H118 results
Assets under administration (AUA) increased by 18% to £5bn and revenue by 15% compared with the same period last year. The largest contributor to revenue growth was commission income against a somewhat mixed market background, but with the benefit of higher AUA and a full contribution from Computershare services, which began during the first half last year. Interest income earned on client cash balances rose sharply from a depressed level. Costs were affected by the need to deal with costs associated with regulatory changes, including MiFID II particularly. As a result, normalised post-tax profit was reduced from £0.255m to £0.05m, but measures have been taken to mitigate the increase in costs, and service levels for customers have returned to normal levels so the starting point for the second half would seem to be much more promising.
Outlook
As ever, the equity market background remains uncertain, but Share’s focus on its core business and improving services provided to self-directed retail investors should leave it well placed to continue to increase scale through market cycles. The value of individual share ownership in the UK market has recorded respectable growth over the long term in absolute terms and has even shown signs of bottoming out as a percentage of the market. Looking ahead, the pressure for individuals to take greater responsibility for pension saving and asset allocation should help to create a favourable environment for the customer-focused offering of The Share Centre. Growth could be accelerated significantly by acquisitions.
Valuation: Modest increase with estimates
We focus mainly on a DCF valuation, which allows us to capture the expected longer-term improvement in profitability. Reflecting revised estimates, our central valuation nudges up from 30.5p to 31.0p (see pages 9-10).
Investment summary
Online execution-only stockbroker
Share plc operates The Share Centre, a retail stockbroker that offers investors dealing, ISAs, SIPP and investment club accounts. Share has total assets under administration of £5bn and c 285,000 customers. As well as signing up clients individually it has acquired business through partnerships with companies such as Henderson, Barclays and Computershare. With the interim results in August 2018 it announced the signing of heads of terms or agreement for the acquisition of approximately 38,000 accounts with over £1.5bn of AUA through three transactions, including one with the administrator of Beaufort Securities. In the case of Computershare, Share provides a share dealing service for companies which use Computershare’s corporate sponsored nominee dealing service. This is branded as Computershare but uses the Share platform and services. The latest transactions would involve the new clients having standard Share Centre branded accounts.
Share adopted a flat fee structure in 2013 under which account fees do not vary with assets under administration. Income from transaction charges may be on a percentage basis, but can also be fixed per bargain. Share also earns an interest margin on customer money held on deposit. This has begun to rise but interest income is still much lower than in earlier years. Subject to customers withdrawing surplus cash more actively, a rising trend in deposit rates would be a positive factor for prospective earnings.
Since 2016 Share has been undertaking an investment programme with the aim of delivering a digital transformation. Substantial progress has been made, with tasks completed including replacement of underlying database technology, a new mobile app and website update. These measures have helped to improve the customer experience, and create greater flexibility and scalability.
Strong balance sheet
At the half year end Share had cash and cash equivalents of £9.1m and no debt. In terms of regulatory capital the company has substantial headroom with capital resources of £14.5m, 2.9 times the requirement. This gives the company the ability to support investment in its digital transformation and to continue to augment organic growth with purchases of books of business.
Valuation
Share’s profitability is depressed during its current phase of investment in the platform and customer service, making earnings multiples less relevant as a valuation measure. On a comparative basis, its adjusted value to AUA is markedly cheaper than Hargreaves Lansdown but more expensive than Alliance Trust Savings, although Share does earn a higher yield on AUA than the latter.
Our DCF model produces a central value of 31.0p, slightly higher than the value we had previously (30.5p). We note the sensitivity of this calculation to the pace at which profitability improves following the completion of the digital transformation programme and the acquisitions signalled with the H118 results.
Sensitivities
Among the sensitivities for Share are developments in the equity market, changes in competitor behaviour, resilience of the IT systems on which the business depends, and the potential for regulatory changes to increase costs and influence the competitive environment.
Customer-focused retail stockbroker
Business background and profile
The Share Centre, Share’s main business, was established in 1991 by the chairman, Gavin Oldham, to provide execution-only stockbroking services to individual investors. The company’s shares were admitted to trading on AIM and PLUS Market in 2008.
The Share Centre offers accounts for share dealing, ISAs, SIPPs and investment clubs. It has c 285,000 customer accounts and £5bn of assets under administration. Customers are signed up individually and through corporate partnerships such as those with Henderson (ISA service to investment trust investors), Barclays (certificated and investment club dealing services), Computershare (certificated and corporate sponsored nominee dealing and a white-label share trading platform) and Invesco Perpetual (ISA accounts). As part of the Share Centre offering, Share manages three funds of funds (AUM £110m), which provide investors with a diversified entry point to equity investing. Revenue is generated from three sources: account fees, trading commissions and interest income, split 35%, 57% and 8%, respectively, for H118.
In 2013 Share introduced a flat monthly account administration fee, which differentiates it from many peers that have fees based on the value of assets under administration. Transaction commissions are either charged at 1% with a minimum of £7.50 or, for those who deal frequently or in large sizes, on a flat £7.50 per bargain basis with a £20 quarterly fee (a 30% discount for on line deals is offered to holders of 500 or more shares in Share plc). This means that the accounts frequently rank favourably in comparisons of providers (depending on portfolio size and frequency of trading).
Exhibit 1 shows the evolution of assets under administration (AUA) since 2008, with an acceleration evident in more recent years reflecting organic growth augmented by market strength, partnerships and acquisitions. AUA growth has grown at a compound annual rate of 20% over the period compared with 6% for the FTSE 100 index.
|
Exhibit 1: Share plc AUA |
Exhibit 2: Share plc revenue analysis over time |
|
|
|
Source: Share plc |
Source: Share plc |
|
Exhibit 1: Share plc AUA |
|
|
Source: Share plc |
|
Exhibit 2: Share plc revenue analysis over time |
|
|
Source: Share plc |
Share’s revenue growth is analysed in Exhibit 2. Total revenue was broadly maintained between 2013 and 2015 in the face of falling interest rates, the elimination of trail commission and the adoption of the flat fee structure, which reduced the gearing of revenues to AUA. As a result of these developments the contribution of interest income to revenue declined from 35% in 2008 to 5% in 2017 before increasing modestly in H118 to 8%. The contribution from fee income has declined in recent years as commissions have increased from 45% to 57% between 2008 and H118 as the asset base has expanded and with the addition of commission-based business from Computershare.
Strategy
Share sets out its strategy under three headings: (1) putting customers first; (2) focus on the core business; and (3) strategic partnerships and acquisitions.
Putting customers first involves a concentration on providing a high quality of service, not only with the initial interface, as exemplified by the upgrade of the website in April this year and launch of a mobile app last year, but also in other areas such as dealing with corporate transactions, which requires adequate back office resourcing and systems to manage the complexity involved. The flat fee structure remains a feature of the business that many investors are likely to find attractive in comparison to value-based charging structures. Share notes that it has won a number of awards including the Investment Trends award for best overall client satisfaction for the fifth year running. The Share Centre also scores well on Trustpilot with a score of 8.6 out of 10 based on 778 reviews at the time of writing.
Improving the customer experience and investing in IT also play a key role in the second strategic heading: the focus on the core Share Centre business. The business was simplified by withdrawal from the non-core authorised corporate director activity, which was completed in April 2017 through the sale of Sharefunds to Treasury Capital. Share maintained management of the small funds business.
As highlighted earlier, Share continues to pursue additional scale through strategic partnerships and acquisitions. The track record it has in implementing these transactions, together with its customer satisfaction scores, underpins Share’s credibility as a counterparty for financial organisations looking to outsource such services. In addition to the three transactions announced with the first half results (see next section), management has indicated that it continues to have a pipeline of transactions under discussion.
Three new acquisitions announced
With its first half results Share announced that it had reached three agreements for the acquisition of a combined c 38,000 customer accounts and over £1.5bn of assets under administration, equivalent to 13% and 30% of the existing numbers for accounts and AUA respectively. Only one of the transactions has been named at this stage and that is the acquisition from the administrator of Beaufort Securities of c 17,500 clients with reported assets of c £570m and cash of £50m (Financial Times, 9 August). The average combined assets and cash per client is therefore c £35,400, while the administrator has indicated that many clients have assets of less than £10,000. The administrator has also noted that fewer than 10 clients would incur any loss, with the Financial Services Compensation Scheme making good the impact of costs of administration for the rest. It is expected that transfers of assets will begin in September. Share has indicated that the other two transactions are normal client acquisitions, not involving an administration.
In all cases, the actual assets and clients retained following initial transfer can be difficult to forecast and while there is no disclosure of terms it seems probable that there would be a conditional element in the consideration. The experience Share has in handling such transactions and a reputation for service should be positive factors in securing client retention. In Exhibit 3 we show the potential scale of the additions in relation to the existing Share client base. If we apply a purely illustrative retention rate of 50%, then the acquisitions could add c 15% to existing AUA and 7% to the client account number. As shown, the average AUA per account acquired could be more than double that for Share’s existing client base, which is depressed to some extent by Child Trust Fund accounts. While this higher value would not boost account fees per client, as they are calculated on a flat fee basis, it could be positive for commission charges reflecting an element of ad valorem charging and potentially higher activity levels for clients with more assets.
Exhibit 3: Acquisition of three books of business – numbers in context
AUA and client accounts |
% of existing |
|
Existing AUA (£bn) |
5,000 |
|
Existing client accounts |
285,000 |
|
AUA to be added (£bn) |
1,500 |
30% |
Retention rate - illustration |
50% |
|
AUA retained (£bn) |
750 |
15% |
Accounts to be added |
38,000 |
13% |
Retention rate - illustration |
50% |
|
Accounts retained |
19,000 |
7% |
AUA per existing account (£) |
17,544 |
|
AUA per account added (£) |
39,474 |
125% |
Source: Edison Investment Research
Ahead of further details, we have not explicitly factored the acquisitions into our forecasts. However, again as an illustration, if we were to keep our illustrative 50% retention rate and apply a revenue per client of £50 or £70 per annum, then incremental sales would be £1.0m or £1.3m respectively (5% and 11% of estimated FY18 revenues). For comparison, Share’s existing revenue per client is running at c £72. Transactional costs are likely to increase in line with client activity levels and some additional staff may be needed to cater for the increased client base, but there should be a degree of operational leverage were the revenue gain to be in line with the indicated levels. In the next section we discuss the first half results.
Good growth countered by costs in H118
Share’s interim results were marked by strong progress in terms of revenue, AUA and client numbers but, driven by regulatory change, cost growth for this period outpaced revenues, resulting in lower underlying earnings and contributing to a statutory loss rather than profit compared with H117. Key points from the results are highlighted below, and the profit and loss numbers are summarised in Exhibit 4.
■
Assets under administration (AUA) increased by 18% to £5bn. It is also worth noting that this figure does not capture the benefit of services provided for Computershare as end-customer assets here do not count as part of AUA unless users choose to sign up individually with The Share Centre.
■
Group revenue increased by 15% with the largest contributor to growth being dealing commissions (+£0.8m), while in percentage terms interest income (+123%) was sharply higher. The strength of the increase in commission income can be attributed to increased activity levels together with the benefit of the full inclusion of new Computershare services, which launched in May 2017. Interest income benefited from a rise in cash held on behalf of customers (+19% at £426m) and permission from the FCA to increase the duration of up to 60% of client money deposits to up to 95 days.
■
The number of accounts increased by c 14% to 285,000.
■
Share’s three in-house funds of funds, while still relatively small, continued to increase their combined assets under management (from £90m end-H117 to £110m).
■
Costs increased by 18% with contributory factors being the cost of meeting regulatory changes, a rise in the intangible amortisation charge (still only £0.3m out of total costs of £10m) reflecting IT investment and sharing of commission with Computershare, which is included within costs.
■
As a result, normalised post-tax profit was reduced from £0.255m to £0.05m.
■
Period end cash stood at £9.1m versus £7.8m in H117 and £10.5m at the end of 2017. In addition, the group has available for sale investments of £6.8m (£6.0m), primarily holdings in Euroclear and the London Stock Exchange.
Exhibit 4: Interim profit and loss analysis
£000s |
H117 |
H217 |
H118 |
H118 vs H117 % |
Account fees |
3,533 |
3,667 |
3,603 |
2.0 |
Dealing Commissions |
4,992 |
5,608 |
5,791 |
16.0 |
Interest and other income |
350 |
576 |
781 |
123.0 |
Revenue |
8,875 |
9,851 |
10,175 |
14.6 |
Total costs |
(9,074) |
(10,445) |
(10,695) |
17.9 |
Operating profit |
(199) |
(594) |
(520) |
161.3 |
Investment revenues |
207 |
18 |
245 |
|
Other losses and gains |
67 |
(16) |
0 |
|
Non-recurring items |
0 |
900 |
0 |
|
Pre-tax profit |
75 |
308 |
(275) |
|
Other gains and losses |
(67) |
(884) |
0 |
|
Non-recurring items incl. FSCS |
96 |
301 |
171 |
|
One-off/restructuring |
0 |
114 |
13 |
|
Share-based payments |
271 |
242 |
267 |
|
Profit share impact of above |
(65) |
74 |
(94) |
|
Normalised pre-tax profit |
310 |
41 |
69 |
|
Tax |
(62) |
(11) |
(4) |
|
Post-tax profit |
13 |
297 |
(279) |
|
Normalised post-tax profit |
255 |
128 |
50 |
Source: Share plc
Commenting on the rise in costs, management noted that meeting the requirements of MiFID II had increased the level of customer interaction, including collecting national insurance numbers and serving terms of business in durable media prior to dealing. This had required additional staff and initially had an impact on service levels. This has now been resolved and measures have been taken to offset the costs involved, including an increased level of minimum commission for offline dealing calls of £20 compared with £7.50 for online transactions.
Since the results announcement Share has reported its market share compared with a peer group of 15 UK retail stockbrokers, including Hargreaves Lansdown. Excluding interest income, the latest reading for Q218 was 3.88% which compares with 3.54% for Q118 and 4.18% for Q217. Data since Q117 is shown below. On a longer view, market share, ex-interest and excluding Hargreaves Lansdown, increased from 8.76% in H114 to 13.73% for H217.
|
Exhibit 5: Market share |
|
|
Source: Compeer, Share plc |
Background and outlook
By way of background we first show the trend in individual ownership of UK equities. The longer-term decline in individual ownership as a percentage of the total UK equity market value is a well-known trend with a reduction from over 20% to 12% seen over the period shown: indeed, the figure in 1963 was as high as 54%. This decline was accompanied by growing overseas and institutional ownership as individuals invested through funds managed by institutions and also diversified their exposures geographically. More pertinent for the background for Share, however, is the fact that the decline has shown signs of bottoming out and that this, combined with longer-term equity market appreciation, has allowed the absolute value of individual holdings of UK equities to rise (at a compound rate of 4.7% in this period).
Prospectively, the impact of greater flexibility following pension reforms in 2015 and the need for individuals to take greater responsibility for saving and managing their assets in the accumulation and decumulation phases may help increase the population of self-directed investors who would be attracted a platform such as that offered by The Share Centre.
|
Exhibit 6: Evolution of individuals’ UK share ownership 1989-2016 |
|
|
Source: ONS |
The trends in UK equity market performance and volatility are illustrated in the next two charts highlighting the period of strength from early 2016 to end 2017, despite bouts of volatility accompanying events such as the Brexit vote and UK election. This year there was a further spike in volatility and market weakness in February. It remains to be seen whether the subsequent reduction in volatility will be sustained, allowing a return to more favourable conditions for investor confidence and hence for Share.
|
Exhibit 7: FTSE All-Share Index (total return) |
Exhibit 8: FTSE 100 Implied Volatility Index |
|
|
|
Source: Thomson Datastream |
|
Exhibit 7: FTSE All-Share Index (total return) |
|
|
Source: Thomson Datastream |
|
Exhibit 8: FTSE 100 Implied Volatility Index |
|
|
Source: Thomson Datastream |
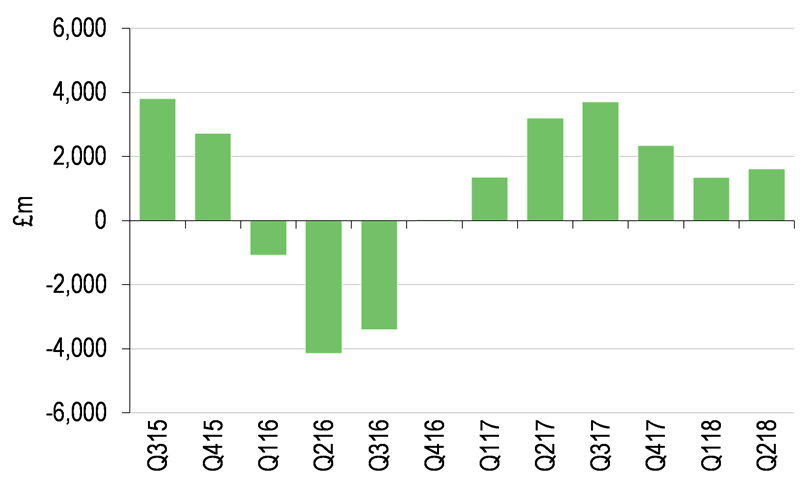
In the next two charts we show the level of retail equity fund sales, as reported by the Investment Association as one indicator of investor confidence. The quarterly series on the left shows a return to positive net flows from Q117 and, although the first two quarters of the current year are running below the level seen in H217, there were still inflows against a mixed market and macro background. The monthly series on the right captures the shorter-term fluctuations with the last two months being essentially neutral.
Share will naturally be sensitive to any significant market setback, but on a longer view the work it has done to improve its customer offering and the success it has had in building revenue market share, AUA and partnership agreements should stand it in good stead through market fluctuations.
|
Exhibit 9: Quarterly retail equity fund net sales |
Exhibit 10: Recent monthly equity fund sales |
|
|
|
Source: Investment Association |
|
Exhibit 9: Quarterly retail equity fund net sales |
|
|
Source: Investment Association |
|
Exhibit 10: Recent monthly equity fund sales |
|
|
Source: Investment Association |
Share saw a significant increase in interest income in the first half of the current year and stands to benefit further from higher rates earned on client money balances to the extent that banking counterparties reflect rising rates in the deposit rates they pay. We expect higher interest income to make a significant contribution to the increase in normalised profits we estimate for 2018 and 2019 (see estimate revisions set out in the next section and financial summary on page 11).
In July the FCA published an interim paper as part of its investment platforms market study with the final report due in the first quarter of 2019. Most commentary following this viewed the interim conclusions as less stringent than expected. However, the findings included the following:
■
Switching between platforms can be difficult and entail exit fees.
■
Shopping around can be difficult.
■
Consumers may miss out by holding out too much cash.
For Share, increased transparency on fees and measures to ease switching could be a positive development, albeit a ban on exit fees could mean some costs associated with client “churn” would not be recouped. In general, the FCA concluded that competition in the direct-to-consumer market was working and that clients who pay more do receive greater functionality. In this respect Share’s work on its IT infrastructure and client interface should provide a stronger competitive position, in turn helping it achieve its goal of a substantial increase in the scale of the business.
Financials
Changes in our estimates are shown in Exhibit 11. As noted earlier, we have not included explicit increases for the three acquisitions announced with the results and these could deliver significant revenues while inevitably entailing some increase in costs. We will adjust for this once more details become available. The main change we have made to revenues has been to increase the assumed interest income following the higher than expected contribution in the first half. Estimated profit for the current year is slightly reduced in absolute terms as a result of the investment in resources to support regulatory change and continued work on the digital transformation. We anticipate that 2019 will demonstrate operational leverage, with the estimate for pre-tax profits rising 10% on a 4% increase in revenue forecast.
Exhibit 11: Estimate revisions
Revenue (£m) |
PBT* (£m) |
EPS* (p) |
Dividend (p) |
||||||||||
Old |
New |
% chg |
Old |
New |
% chg |
Old |
New |
% chg |
Old |
New |
% chg |
||
2018e |
20.1 |
20.5 |
2% |
0.9 |
0.8 |
-11% |
0.52 |
0.44 |
-15% |
0.55 |
0.55 |
0% |
|
2019e |
20.8 |
21.6 |
4% |
1.0 |
1.1 |
10% |
0.57 |
0.63 |
10% |
0.70 |
0.70 |
0% |
|
Source: Edison Investment Research. Note: *PBT and EPS are normalised, excluding exceptional items and share-based payments.
Share’s capital and cash position remains strong. The regulatory capital requirement is £5m for 2018. At end of H118 the group held capital of £14.5m, equivalent to 2.9 times the requirement, comfortably above the company’s own policy of holding twice the regulatory requirement. Share has no debt and at the half year-end had cash of £9.1m and investments valued at £6.8m, providing ample liquidity to meet its investment requirements and support acquisition of books of business on the scale it has been involved in to date.
Sensitivities
The sensitivities for the Share business include:
■
Equity market developments, particularly the level of volatility, are likely to affect the confidence of retail investors positively or negatively and hence their propensity to trade on the Share platform.
■
Competitor behaviour, including marketing and pricing, may help or hinder customer acquisition and retention.
■
Maintaining a robust IT platform is central for the business.
■
Regulatory developments can impose additional costs and may influence the competitive landscape over time but, as noted earlier, Share appears relatively well placed in this regard given its pricing model and range of services.
Valuation
We have updated the comparative table we have used in previous notes. This incorporates selected measures for Share, Alliance Trust Savings and Hargreaves Lansdown. The scale of Hargreaves Lansdown is apparent with its latest reported AUA standing at £91.6bn, a multiple of the £16.2bn and £5bn for Alliance Trust Savings and Share respectively. Reflecting a track record of profitability and growth, it is unsurprising that Hargreaves Lansdown also trades on substantially higher multiples of revenue or as a percentage of AUA. For comparative purposes we have adjusted the valuations for Share and Hargreaves Lansdown for excess capital assuming two times coverage (Share’s target level). There is a near £5m surplus on this basis for Share and a negative item for Hargreaves Lansdown that we deduct from the market capital to calculate an adjusted value. For Alliance Trust Savings we take the valuation reported in the Alliance Trust interim report (unchanged from the year end at £38m). Alliance Trust Savings reported a marginal profit in H118 compared with a £1.5m loss in the prior year period. Following costs and difficulties in launching a new platform, it is perhaps not surprising that the valuation in terms of revenue and AUA remains below that of Share.
Share’s valuation measures are slightly lower than that we reported following the FY17 results (then the adjusted value was 1.7x revenue and 0.7% of AUA), which we would ascribe to the fact that, while Share is delivering continuing revenue and AUA growth, profitability is yet to demonstrate the geared improvement that we expect to become evident during FY19.
Exhibit 12: Peer comparison
£m unless stated |
Share |
Alliance Trust Savings |
Hargreaves Lansdown |
Market capital |
35 |
10,416 |
|
Surplus capital (at 2x requirement) |
5 |
(80) |
|
Adjusted value |
30 |
38 |
10,496 |
Revenue |
20 |
30 |
448 |
Assets under administration (AUA) |
5,000 |
16,200 |
91,600 |
Accounts (number of active clients for HL) |
285,000 |
110,402 |
1,091,000 |
Adjusted value/revenue (x) |
1.5 |
1.3 |
23.5 |
Adjusted value/AUA (%) |
0.6 |
0.2 |
11.5 |
Descriptive metrics |
|||
Revenue/average AUA (bps) |
44 |
19 |
52 |
Market/stated value per account |
124 |
344 |
9,547 |
AUA per account (£) |
17,544 |
146,736 |
83,960 |
Revenue per account (£) |
72 |
268 |
410 |
Adjusted value per account (£) |
107 |
344 |
9,621 |
Source: Edison Investment Research, companies’ disclosure. Note: Valuation, turnover and AUA for Alliance Trust Savings from H118 release. Hargreaves Lansdown AUA and revenue from FY18. Share AUA and revenue H118.
We have also updated our DCF valuation using assumptions that include long-term growth of 4%, a discount rate of 10% and a terminal multiple of 10x. Allowing for changes to our estimates described earlier, our central value (see sensitivity in Exhibit 13) is now 31.0p versus 30.5p previously.
Exhibit 13: Discounted cash flow valuation sensitivity (pence per share)
Discount rate |
|||||
Long-term growth |
8% |
9% |
10% |
11% |
12% |
2% |
32.9 |
31.1 |
29.5 |
28.0 |
26.7 |
3% |
33.7 |
31.9 |
30.2 |
28.7 |
27.3 |
4% |
34.7 |
32.7 |
31.0 |
29.4 |
27.9 |
5% |
35.6 |
33.6 |
31.7 |
30.1 |
28.6 |
Source: Edison Investment Research
Exhibit 14: Financial summary
£000 |
2014 |
2015 |
2016 |
2017 |
2018e |
2019e |
|
Year end 31 December |
|||||||
PROFIT & LOSS |
|||||||
Account fees |
6,610 |
6,400 |
6,784 |
7,200 |
7,358 |
7,653 |
|
Dealing Commissions |
6,610 |
6,400 |
7,040 |
10,600 |
11,395 |
11,737 |
|
Interest and other income |
1,800 |
1,250 |
786 |
926 |
1,753 |
2,227 |
|
Revenue |
|
15,042 |
14,050 |
14,610 |
18,726 |
20,507 |
21,616 |
Cost of Sales (exc amortisation and depreciation) |
(14,579) |
(14,812) |
(15,727) |
(19,169) |
(20,001) |
(20,713) |
|
EBITDA |
|
463 |
(762) |
(1,117) |
(443) |
505 |
904 |
Depreciation |
|
(104) |
(111) |
(121) |
(127) |
(135) |
(140) |
Amortisation |
(11) |
(21) |
(108) |
(223) |
(630) |
(680) |
|
Operating profit (pre exceptional) |
|
348 |
(894) |
(1,346) |
(793) |
(260) |
84 |
Exceptionals |
0 |
0 |
0 |
900 |
0 |
0 |
|
Other |
60 |
1,479 |
2,119 |
51 |
0 |
0 |
|
Investment revenues |
308 |
276 |
248 |
225 |
260 |
230 |
|
Profit Before Tax (FRS 3) |
|
716 |
861 |
1,021 |
383 |
0 |
314 |
Profit Before Tax (norm) |
|
1,615 |
584 |
(46) |
351 |
764 |
1,085 |
Tax |
(109) |
(196) |
(284) |
(73) |
(0) |
(60) |
|
Profit After Tax (FRS 3) |
|
607 |
665 |
737 |
310 |
0 |
254 |
Profit After Tax (norm) |
|
1,416 |
555 |
4 |
383 |
619 |
879 |
Average Number of Shares Outstanding (m) - exc treasury |
143.5 |
139.2 |
139.3 |
139.4 |
140.5 |
140.5 |
|
EPS - normalised (p) |
|
0.99 |
0.40 |
0.00 |
0.27 |
0.44 |
0.63 |
EPS - FRS3 (p) |
|
0.42 |
0.48 |
0.53 |
0.22 |
0.00 |
0.18 |
Dividend per share (p) |
0.62 |
0.74 |
0.25 |
0.40 |
0.55 |
0.70 |
|
EBITDA Margin (%) |
3.1% |
(5.4%) |
(7.6%) |
(2.4%) |
2.5% |
4.2% |
|
Normalised operating margin (%) |
8.3% |
2.2% |
(2.0%) |
0.7% |
2.5% |
4.0% |
|
BALANCE SHEET |
|||||||
Fixed Assets (mainly Investments) |
|
9,405 |
8,083 |
8,341 |
9,986 |
10,531 |
10,411 |
Current Assets |
|
21,316 |
19,716 |
23,883 |
35,300 |
24,460 |
25,452 |
Total Assets |
|
30,721 |
27,799 |
32,224 |
45,286 |
34,991 |
35,863 |
Current Liabilities |
|
(8,450) |
(7,681) |
(13,384) |
(25,942) |
(15,355) |
(16,186) |
Long term Liabilities |
(1,594) |
(1,418) |
(1,096) |
(1,155) |
(1,163) |
(1,163) |
|
Net Assets |
|
20,677 |
18,700 |
17,744 |
18,189 |
18,472 |
18,513 |
CASH FLOW |
|||||||
Operating Cash Flow |
|
199 |
(2,104) |
492 |
1,147 |
111 |
1,423 |
Net cash from investing activities |
(434) |
1,990 |
483 |
(1,293) |
(710) |
(470) |
|
Net cash from (used in) financing |
(736) |
(878) |
(1,217) |
(735) |
(628) |
(773) |
|
Net Cash Flow |
|
(971) |
(992) |
(242) |
(881) |
(1,227) |
180 |
Opening net (debt)/cash |
|
13,626 |
12,655 |
11,663 |
11,421 |
10,540 |
9,313 |
Closing net (debt)/cash |
|
12,655 |
11,663 |
11,421 |
10,540 |
9,313 |
9,493 |
Source: Company accounts, Edison Investment Research
|
|||||||||||||||||||||||||||||||||||||
|
|
Research: Real Estate
After being able to considerably grow its assets under management (AUM) in 2017 (albeit below initial management guidance), publity’s focus in 2018 is on retaining the asset base in line with the prior year. Despite the disposal of several office projects covering 100,000 sqm of lettable office space in H118, AUM remained stable at €4.6bn. publity is confident the current advanced-stage discussions around asset purchases should allow it to maintain the AUM level at the end of 2018 despite another sizeable disposal announced in August. Meanwhile, the FY18 earnings guidance was lowered in June, discussions with bondholders continue and shareholders approved a new share issue.