Last close As at 05/08/2026
GBP0.84
▲ −1.10 (−1.29%)
Market capitalisation
GBP412m
Research: Real Estate
Although key elements of Custodian REIT’s (CREI’s) FY21 results had been previously disclosed, the detailed annual report includes additional details on its robust FY21 performance and prospects. In H221 rent collection strengthened, DPS increased and asset values recovered, delivering positive total returns. We expect these trends to carry over into the current year, with continuing occupier demand improving occupancy. A strong balance sheet provides support for potential accretive acquisitions.
Custodian REIT |
Robust FY21 with improving outlook |
FY21 results |
Real estate |
23 June 2021 |
Share price performance
Business description
Next events
Analyst
Custodian REIT is a research client of Edison Investment Research Limited |
|||||||||||||||||||||||||||||||||||||||||||||||||
Although key elements of Custodian REIT’s (CREI’s) FY21 results had been previously disclosed, the detailed annual report includes additional details on its robust FY21 performance and prospects. In H221 rent collection strengthened, DPS increased and asset values recovered, delivering positive total returns. We expect these trends to carry over into the current year, with continuing occupier demand improving occupancy. A strong balance sheet provides support for potential accretive acquisitions.
Year end |
Net rental |
EPRA |
EPRA |
EPRA NTA/ |
DPS |
P/NTA |
Yield |
||
03/20 |
38.1 |
28.7 |
7.0 |
101.6 |
6.65 |
0.96 |
6.8 |
||
03/21 |
33.1 |
23.7 |
5.6 |
97.6 |
5.00 |
1.00 |
5.1 |
||
03/22e |
35.6 |
25.8 |
6.1 |
98.4 |
5.60 |
1.00 |
5.7 |
||
03/23e |
37.2 |
27.3 |
6.5 |
100.2 |
6.00 |
0.98 |
6.1 |
||
Note: *EPRA earnings excludes revaluation gains/losses and other exceptional items.
Strengthening H221 as previously reported
As previously disclosed, FY21 EPRA were £5.0m lower versus FY20 with EPS of 5.6p. Earnings were negatively affected by c £3.6m of provisions and write-offs and a 5% (£2.1m) decrease in rent roll, mainly driven by tenant failures and partly offset by accretive acquisitions. Rent collection for the year was 91%, including net of contractual rent deferrals (2%), and strengthened during the year to support and increase in H2 DPS to 3.0p versus 2.0p in H1 (an aggregate 5.0p versus 6.65p in FY20). FY21 DPS was 113% covered by EPRA earnings and fully covered on a net cash basis. The board targets FY22 DPS of at least 5.0p while maintaining full cover. We continue to forecast aggregate FY22 DPS of 5.6p, above the targeted minimum. EPRA NTA per share was 97.6p, down on FY20 (101.6p) but up on H121 (95.2p). Including DPS paid, EPRA NTA total return was a positive 0.9%.
No change to our forecast for growth
We have made no material changes to our forecasts and expect an increase in EPRA earnings to support our increase in DPS. Including modest EPRA NTA growth, we forecast a 6.9% total return. While occupancy decreased from 95.9% to 91.6% during FY21 with continuing occupier demand more than half of CREI’s vacant properties are now let or under offer. While uncertainty remains, the economy is forecast to strengthen and, combined with lockdown easing, we continue to expect a further improvement in rent collection, reflected in a reduction in receivables charges to £0.6m. Not in our forecasts, moderate gearing (FY21 net loan to value ratio (LTV) of 24.9%) and undrawn debt provide scope for accretive acquisitions.
Valuation: Consistent income return focus
The minimum 5.0p DPS targeted by CREI for FY22 represents an attractive yield of 5.1%, and our forecast DPS of 5.6p represents a yield of 5.7%. Both are a significant premium to risk-free rates (10-year UK government debt c 0.8%). Despite the pandemic, NTA total return has remained positive on an annual basis, driven by an unbroken pattern of quarterly DPS payments, albeit at a reduced level.
Investment summary
Diversified, smaller lot strategy
CREI seeks to appeal to both retail and institutional investors in the UK real estate investment trust (REIT) sector by targeting attractive and stable dividend returns, with the potential for capital growth, from a well-diversified portfolio of UK commercial real estate with conservative levels of gearing (c 25% target with a maximum 35%). Although diversified, portfolio positioning is actively managed, with the industrial/logistics and retail warehouse sectors favoured by the manager, and an expanding exposure to ‘drive-thru’ restaurants. CREI’s investment strategy is differentiated by a principal focus on properties with smaller individual values (‘lot sizes’) of less than £10m at the point of investment. On average, properties of this size provide a yield premium over larger assets, in part the result of a broader range of potential occupiers while attracting less competition from larger institutional investors. Combined with active asset management and a relatively low cost base (FY21 ongoing cost ratio or OCR of 1.12%), this yield premium has delivered attractive total returns since IPO, consistently positive on an annual basis (including FY21) and driven by dividends paid.
Income returns have proven more predictable
Although UK commercial property market returns have historically shown significant cyclicality, the income component has been much less volatile than capital values. CREI’s income-focused strategy has consistently generated positive annual total returns despite more recent volatility in capital values, first in relation to Brexit and political uncertainty and then the pandemic. From listing in March 2014 to March 2021 (the end of FY21), CREI generated an EPRA net asset value (NAV) total return (without assuming reinvestment of dividends paid) of 41.1%, or a compound annual average return of 5.9% pa. This total return has been entirely generated by the income component, dividends paid to shareholders, and more so in FY21 (income return of 4.8% versus total return of 0.9%). During FY21, although the sharp pandemic-related fall in capital values generated a negative total return in Q121 (4.2%), the subsequent quarters each generated positive returns, reaching 2.5% in Q421.
Our forecasts for growth are unchanged
Our forecasts for FY22 and FY23 are unchanged. The growth that we forecast for FY22 is driven by our expectation of a significant (c £3.0m) decline in net receivables charges, supported by a good level of end-FY21 provisions and the expectation of an improved collection outlook, including a part of the rent outstanding although tenant failures remain a risk. We expect occupancy to improve modestly in FY22 and more so in FY23. FY22e reported rent income is held back by the lower opening rent roll compared with FY21 but increases in FY23e. Our NAV forecasts benefit from relatively low but positive capital return assumptions, driven by modest blended growth in estimated rental values (ERV) with no implied change in valuation yields. The company seeks to leverage its strong balance sheet for accretive acquisitions but these are not included in our forecasts.
Key sensitivities are pandemic and economy
We review the main sensitivities below. The greatest uncertainties relate to the continuing impact of the COVID-19 pandemic on economic growth and the way real estate may be used in future. The commercial property market is cyclical and property values have historically displayed significant volatility across the cycle; income returns have been significantly more stable although the level of income fluctuates with occupier demand and rent levels. Yields on well-let property compare favourably with short-term interest rates and long-term risk-free rates.
Summary of the FY21 results and investor presentation details
Many of the FY21 headline financial numbers contained in the FY21 results release were previously disclosed in the unaudited Q421 release in May and were in line with our forecasts at the time. However, the annual report includes additional details on the robust performance in FY21 and prospects.
As CREI’s rent recovery (91% for the year, adjusted for contractual rent deferrals) and market-wide property valuations steadied in H2, EPRA earnings showed a strong improvement, DPS increased, and EPRA NTA made a partial recovery, generating a positive total return for the year of 0.9%.
Investor presentation
The board has been monitoring whether COVID-19 guidance limiting public gatherings and travel will be in place when the company holds its AGM on 25 August 2021. To provide certainty and encourage interaction and engagement with shareholders, the company has arranged an online investor presentation at 2:00pm on 6 July 2021 at which shareholders will receive updates from the Chairman and Investment Manager with the opportunity for an interactive question and answer session. For those wishing to participate, the registration link is bigmarker.com.
The results
Exhibit 1 provides a summary of the FY21 financial results.
Exhibit 1: FY21 financial summary
£m unless stated otherwise |
FY21 |
FY20 |
FY21/FY20 |
H121 |
H221 |
FY21e* |
EPRA earnings |
||||||
Gross rental income |
38.7 |
40.0 |
-3% |
19.4 |
19.3 |
38.7 |
Non-rechargeable property costs |
(2.0) |
(1.5) |
27% |
(0.9) |
(1.1) |
(1.8) |
Receivables provision/write-off |
(3.6) |
(0.3) |
(2.9) |
(0.7) |
(3.5) |
|
Net rental income |
33.1 |
38.1 |
-13% |
15.6 |
17.5 |
33.4 |
Administrative expenses |
(4.6) |
(4.8) |
-4% |
(2.3) |
(2.3) |
(4.7) |
Operating Profit before revaluations |
28.5 |
33.4 |
-15% |
13.3 |
15.2 |
28.7 |
Net interest |
(4.8) |
(4.7) |
3% |
(2.4) |
(2.4) |
(5.0) |
EPRA earnings |
23.7 |
28.7 |
-17% |
10.9 |
12.8 |
23.7 |
Revaluation of investment properties |
(19.6) |
(25.9) |
(27.4) |
7.8 |
(19.7) |
|
Costs of acquisitions |
(0.7) |
(0.6) |
(0.1) |
(0.6) |
(0.7) |
|
Profit on disposal |
0.4 |
(0.1) |
0.5 |
(0.1) |
0.5 |
|
IFRS earnings |
3.7 |
2.1 |
77% |
(16.1) |
19.8 |
3.8 |
IFRS EPS (p) |
0.9 |
0.5 |
0.9 |
|||
EPRA EPS (p) |
5.6 |
7.0 |
-19% |
2.6 |
3.0 |
5.6 |
DPS (declared) (p) |
5.00 |
6.65 |
-25% |
2.00 |
3.00 |
5.00 |
Dividend cover (%) |
112.7 |
104.4 |
112.8 |
|||
IFRS NAV & EPRA NTA per share (p) |
97.6 |
101.6 |
95.2 |
97.6 |
97.6 |
|
Investment portfolio (£000s) |
551.9 |
559.8 |
-1% |
551.9 |
||
NTA total return |
0.9% |
1.1% |
0.9% |
|||
Net LTV |
24.9% |
22.4% |
24.9% |
Source: Custodian REIT data, *Edison Investment Research FY21 forecast.
The key highlights of the financial performance include:
■
Net rental income of £33.1m (FY20: £38.1m) was negatively affected by:
•
a c £2.7m increase in provisions against rent receivables and a c £0.9m write-off in respect of tenant rent concessions and tenant company voluntary arrangements (CVAs) and administration; and
•
a £2.1m (5.0%) decrease in annual rent roll during the year, due to existing tenants exiting at lease expiry (2.6%), cessation of rents due to CVAs and administration (3.2%), partly offset by acquisitions (0.8%). Continuing rent growth in industrial sector assets offset decreases in other sectors.
■
With administrative expenses well controlled (reduced by £0.2m) and interest expense little changed (up £0.1m) EPRA earnings were £23.7m (FY20: 28.7m) or EPRA EPS of 5.6p.
■
Including both the Q421 DPS of 1.25p and the fifth interim DPS of 0.5p, aggregate DPS declared in respect of FY21 was 5.0p (FY20: 6.65p), 113% covered by EPRA EPS of 5.6p (FY20: 7.0p) and fully covered by net cash receipts.
■
IFRS earnings and IFRS NAV/EPRA NTA included £19.6m of net negative property revaluation movements, comprising a £9.4m uplift from asset management initiatives and £29.0m of general valuation decreases.
■
EPRA NTA per share was 97.6p, down on FY20 (101.6p) but up on H121 (95.2p). Including DPS paid, EPRA NTA total return was a positive 0.9%.
Property revaluation
The £19.6m aggregate valuation decrease comprised a £9.4m uplift from successful asset management initiatives and £29.0m of general valuation decreases, primarily due to decreases in the ERV of high street retail properties, negative market sentiment for retail assets and the impact of the COVID-19 pandemic. Lower valuations in retail, other1 and the office sector were partly offset by a 4.6% (£12.0m) increase in industrial and logistics. Significant net portfolio valuation weakness in Q121 began to stabilise with net gains registered in each of the past two quarters.
Other assets include car showrooms, petrol filling stations, children's day nurseries, restaurants, gyms, hotels, healthcare units, and ‘drive-thru’ restaurants.
Exhibit 2: Quarterly like-for-like valuation movement
Jun-21 |
Sep-21 |
Dec-21 |
Mar-21 |
Mar-21 |
|
£m |
Q121 |
Q221 |
Q321 |
Q421 |
FY21 |
Industrial |
(5.5) |
1.0 |
9.6 |
6.9 |
12.0 |
Retail warehouse |
(5.9) |
(1.4) |
(2.5) |
(1.2) |
(11.0) |
Other |
(6.3) |
(0.8) |
0.7 |
0.9 |
(5.5) |
High St retail |
(4.3) |
(1.0) |
(2.1) |
(1.1) |
(8.5) |
Office |
(2.2) |
(0.9) |
(1.6) |
(1.9) |
(6.6) |
Portfolio total |
(24.2) |
(3.1) |
4.1 |
3.6 |
(19.6) |
Industrial |
-2.2% |
0.4% |
3.8% |
2.6% |
4.6% |
Retail warehouse |
-5.1% |
-1.3% |
-2.4% |
-1.2% |
-10.8% |
Other |
-6.8% |
-1.0% |
0.8% |
1.0% |
|
High St retail |
-7.5% |
-2.1% |
-4.5% |
-1.9% |
-21.6% |
Office |
-4.1% |
-1.8% |
-3.3% |
-4.3% |
-10.4% |
Portfolio total |
-4.2% |
-0.6% |
0.8% |
0.7% |
-3.5% |
Source: Custodian REIT
The strong performance of CREI’s industrial assets mirrors the market-wide trend but also benefited from asset management initiatives. The ‘out-of-town’ retail warehouse sector performed significantly more strongly than high street retail and CREI notes recent strong competition for assets in the sector. The ‘other’ sector contains a number of tenant exposures that would ordinarily be defensive in terms of the economic cycle but have proved less resilient to the pandemic in the past year, although capital values have increased in each of the past two quarters.
Rent collection
Of the £36.8m of contracted cash rental income for FY21 (ie rental income adjusted for non-cash IFRS smoothing adjustments of £1.9m), 91% has been collected, net of contractual rent deferrals, and 89% before contractual rent deferrals.2 Applied to the sector mix of the portfolio (Exhibit 3) we consider this a good performance, which CREI notes has benefited from it collecting rents directly (ie not through a third-party agent), allowing better engagement for payments and facilitating an improved outcome, in some cases agreeing to monthly rather than quarterly rent payments or providing rent concessions. Concessions were offered as a last resort, amounting to less than 1% of contracted rents, and where possible longer lease commitments were sought in return as part of a lease re-gear.
At 16 June 2021.
Exhibit 3: FY21 rent collection performance
FY21 (£m) |
Net of contractual rent deferrals |
Before contractual rent deferrals |
|
IFRS rental income |
38.7 |
||
Lease incentive adjustment (non-cash) |
(1.9) |
||
Cash rental income expected, before agreed deferrals |
36.8 |
100% |
|
Agreed rent deferrals |
(0.9) |
-3% |
|
Cash rental income expected, net of agreed deferrals |
35.9 |
100% |
|
Outstanding rental income |
(3.1) |
-9% |
-8% |
Rental income collected |
32.8 |
91% |
89% |
Source: Custodian REIT
Around £3.1m of FY21 rent remains outstanding and is the subject of continuing discussions with tenants. Some of this remains at risk of nonrecovery due to the recent national lockdown and particularly from CVAs and Administrations,3 but we suspect that not all outstanding rent represents an inability to pay on the part of tenants and some will have been influenced by the government’s moratorium on the eviction of tenants for non-payment of rent (now further extended to March 2022). To cover the estimated risk of non-recovery of outstanding and deferred rents, the end-FY21 doubtful debt provision stood at £3.0m, up from £0.3m at end-FY20.
CVAs are an arrangement between a corporate borrower and its creditors about the extent and timing of repayments. Administration involves an ‘administrator’ taking control of the company to effect a recovery, sale, or closure.
In addition to the provision, £0.9m was written off in respect in respect of the rent provisions granted (c £0.25m) and tenant CVAs and Administrations.
Since end-FY21, CREI has received 90% of rents due relating to the April to June 2021 quarter.4
At 16 June 2021.
Dividend guidance
Including both the Q421 DPS of 1.25p declared for payment on 28 May 2021 and the fifth interim DPS of 0.5p declared for payment on 30 June 2021, aggregate DPS declared for FY21 was 5.0p (FY20: 6.65p). Aggregate DPS was 113% covered by EPRA EPS of 5.6p (FY20: 7.0p) and fully covered by net cash receipts, in line with the current policy of paying dividends at a level that is broadly linked to net rental receipts. For FY22, the board has set a target for aggregate dividends of not less than 5.0p, primarily subject to rent collection remaining in line with expectations. On a longer-term basis, the policy remains to grow dividends on a sustainable basis, at a rate that is fully covered by projected net rental income while maintaining investment flexibility. We continue to forecast aggregate FY22 DPS of 5.6p, above the targeted minimum.
Income oriented, targeting quality, smaller lot sizes
CREI is a UK REIT listed on the Premium Segment of the Main Market of the London Stock Exchange since March 2014. Its diversified portfolio targets regional commercial properties (outside London), predominantly let to institutional-grade tenants throughout the UK. It is externally managed by the experienced property management team of Custodian Capital, a property management and investment business wholly owned by Mattioli Woods, the specialist wealth management and employee benefits consultants, managing total client assets of £13.6bn including recent acquisitions. It aims to appeal to both retail and institutional investors in the UK REIT sector by targeting attractive and stable dividend returns, with the potential for capital growth, from a well-diversified portfolio of UK commercial real estate with conservative levels of gearing (c 25% target with a maximum 35%).5 CREI’s investment strategy is differentiated by a principal focus on properties with smaller individual values (‘lot sizes’) of less than £10m at the point of investment. On average, properties of this size provide a yield premium over larger assets, in part the result of a broader range of potential occupiers while attracting less competition from larger institutional investors. Combined with active asset management and a relatively low cost base (FY21 OCR of 1.12%), this yield premium has delivered attractive total returns since IPO, consistently positive on an annual basis (including FY21) and driven by dividends paid.
Net loan to value ratio.
Although diversified, portfolio positioning is active with the industrial/logistics and retail warehouse sectors favoured by the manager, and an expanding exposure to ‘drive-thru’ restaurants. The portfolio has grown strongly since IPO but has been more stable in the past three years as CREI has taken a more cautious approach to acquisitions and reflecting weaker market valuations due to the pandemic. However, CREI continues to seek opportunities for further growth, recognising the potential for further economies of scale.
Dividend policy aims to maximise fully covered DPS at a level that is sustainable and does not conflict with investment policy and dividends had increased each year until the pandemic. From a reduced level, uninterrupted quarterly DPS was increased twice during FY21, maximising distributions while tracking cash receipts as the prospects for rent collection improved. The aggregate FY21 DPS of 5.0p was well ahead of the minimum 3.0p target set by the board at the beginning of the year. The board has set a target of no less than 5.0p for FY22 although we forecast a fully covered 5.6p.
|
Exhibit 4: Investment property value and net rental income since IPO |
Exhibit 5: Fully covered dividends with growth interrupted by pandemic |
|
|
|
Source: Custodian REIT data. Note: *Net rental income does not include FY21 receivables provision/write-offs. |
Source: Custodian REIT data. Note: *EPRA earnings divided by dividends paid or approved for the year. |
|
Exhibit 4: Investment property value and net rental income since IPO |
|
|
Source: Custodian REIT data. Note: *Net rental income does not include FY21 receivables provision/write-offs. |
|
Exhibit 5: Fully covered dividends with growth interrupted by pandemic |
|
|
Source: Custodian REIT data. Note: *EPRA earnings divided by dividends paid or approved for the year. |
Consistently positive income-driven returns
Although UK commercial property market returns have historically shown significant cyclicality, the income component has been much less volatile than capital values. CREI’s income-focused strategy has consistently generated positive annual total returns despite more recent volatility in capital values, first in relation to Brexit and political uncertainty, and then the pandemic. From listing in March 2014 to March 2021 (FY21), CREI generated an EPRA NAV total return (without assuming reinvestment of dividends paid) of 41.1%, or a compound annual average return of 5.9% pa, all of which has been generated by dividend payments. The income return for investors from dividends paid has generated all of this return and more so in FY21 (income return of 4.8% versus total return of 0.9%). During FY21, although the sharp pandemic-related fall in capital values generated a negative total return in Q121 (4.2%), the subsequent quarters each generated positive returns, reaching 2.5% in Q421.
Exhibit 6: EPRA NAV total return history
Year ending 31 March |
2015 |
2016 |
2017 |
2018 |
2019 |
2020 |
2021 |
Cumulative since IPO |
Opening EPRA NAV per share (p) |
98.2 |
101.3 |
101.5 |
103.8 |
107.3 |
107.1 |
101.6 |
98.2 |
Closing EPRA NAV per share (p) |
101.3 |
101.5 |
103.8 |
107.3 |
107.1 |
101.6 |
97.6 |
97.6 |
Dividends paid per share (p) |
3.750 |
6.350 |
6.350 |
6.425 |
6.525 |
6.625 |
4.913 |
40.9 |
EPRA NAV total return |
7.0% |
6.4% |
8.5% |
9.6% |
5.9% |
1.0% |
0.9% |
41.1% |
o/w income returns (dividend payments) |
3.8% |
6.3% |
6.3% |
6.2% |
6.1% |
6.2% |
4.8% |
41.7% |
Compound annual total return |
5.9% |
Source: Custodian REIT, Edison Investment Research
Smaller lot size yield premium
Using market-wide data, Exhibit 7 compares the transaction yields on assets with a value of less than £10m with those that have a value of more than £10m. Due to pandemic delays, only data to end-2019 are currently available but the consistent small-lot premium is evident and CREI’s manager believe this remains the case.
|
Exhibit 7: UK two-year rolling average transaction yield |
|
|
Source: Custodian REIT, Lambert Smith Hampton |
Smaller properties are generally considered to be higher risk and will typically have a higher cost of management relative to income. In our view, the main risk is related to lower liquidity, which may be an issue if the property must be sold, but smaller size does not in itself determine the quality of the property, its appeal to tenants, or the quality of tenant. Asset selection and a long-term approach to investment are key to managing risk and of CREI’s strategy for producing an attractive risk adjusted income return, more than sufficient to offset the additional administrative complexity. Other key elements of this strategy include:
■
Diversification by asset, tenant and geographical location, which may be made easier by having a larger number of smaller properties.
■
A focus on areas with high residual values.
■
Regional locations with strong local economies and favourable demand-supply characteristics.
■
No speculative development, except for refurbishing existing assets or forward funding of pre-let schemes.
Portfolio strategy and performance
Portfolio diversification provides a mitigation to risk in uncertain times such as these and CREI’s portfolio is well spread across the main commercial property sectors and by location, tenant and lease term.
Exhibit 8: Portfolio summary
31 March |
2021 |
2020 |
Portfolio value |
£551.9m |
£559.8m |
Number of assets |
159* |
161 |
Separate tenancies |
265* |
280 |
EPRA occupancy rate |
91.6% |
95.9% |
WAULT |
5.0 years |
5.3 years |
Net initial yield (NIY) |
6.6% |
6.8% |
Source: Custodian REIT data. Note: *158 properties and 264 tenancies at 7 June 2021 per the June 2021 Factsheet
At 31 March 2021 (end-FY21) the portfolio was externally valued at £551.9m (FY20: £559.8m) with a rent roll of £38.7m pa reflected in a net initial yield of 6.6%. The weighted average unexpired lease term at end-FY21 was 5.0 years, fairly evenly distributed, with income ‘at risk’ from tenant lease expiry or the exercise of a lease break options of c 11% over one year and c 31% over three years. While a significant proportion of tenants do not exit at break or expiry, this could be negatively affected by the pandemic and economic weakness.
Tenant business failures and tenants exiting at lease expiry contributed to a decrease in occupancy to 91.6% at end-FY21 from 95.9% at end-FY20. More than half of CREI’s end-FY21 vacant space is now let or under offer. While contracted rent roll was 5.0% lower during the year the externally ERV at full occupancy was just 0.4% lower at £42.6m. The c £3.9m or c 10% gap between ERV and contracted rents indicates additional income potential in the portfolio, the majority of which (c £3.6m) represents the potential from letting vacant space, although in some cases it may be necessary and sensible to accept rents below ERV to maintain occupancy and long-term income.
Of the more than 260 individual tenancies, the top 10 tenants represent a little under 24% of overall rent roll, little changed in composition or aggregate share over the past year.6 Menzies Distribution is the largest tenant at just over 4% of total rent roll, spread over eight individual assets. Menzies is one of the UK's leading urban logistics businesses.
Nine of the current top 10 tenants were amongst the top 10 a year ago, amounting to just under 23% of rent roll.
Exhibit 9: Top 10 tenants (% of rent roll)
Menzies Distribution |
3.96% |
Wickes Building Supplies |
1.94% |
|
B&Q |
3.34% |
Benham (Specialist Cars) |
1.83% |
|
B&M Retail |
3.04% |
Regus (Maidstone West Malling) |
1.57% |
|
VW Group (UK) |
2.08% |
First Title |
1.55% |
|
Superdrug Stores |
2.02% |
JTF Wholesale |
1.44% |
|
Top 10 tenants |
22.77% |
|||
Source: Custodian REIT, Q221 Factsheet
Exhibits 10 and 11 show the sector and geographic spread of the portfolio.7 Geographically, the portfolio has minimal exposure to London, but exposure to every other region. It is split between the main property sectors, in line with the company’s objective of maintaining a suitably balanced portfolio, with relatively high exposures to the industrial, retail warehouse and alternative sectors (‘other’, including car showrooms, petrol filling stations, children’s day nurseries, gymnasiums, hotels, healthcare units, and drive-thru), with relatively low exposure to office and high street retail.
At 7 June 2021 as per the June 2021 Factsheet and not materially different from end-FY21.
|
Exhibit 10: Property sector split by income |
Exhibit 11: Geographical location by income |
|
|
|
Source: Custodian REIT June 2021 Factsheet. Note: Data at 7 June 2021. |
|
Exhibit 10: Property sector split by income |
|
|
Source: Custodian REIT June 2021 Factsheet. Note: Data at 7 June 2021. |
|
Exhibit 11: Geographical location by income |
|
|
Source: Custodian REIT June 2021 Factsheet. Note: Data at 7 June 2021. |
Diversified but actively managed
Although the portfolio is diversified to manage risk the investment strategy provides flexibility for active sector positioning, enabling CREI to make strategic adaptations in response to changing market conditions. As a long-term investor, changes to the overall portfolio positioning have been evolutionary rather than revolutionary but we highlight the following:
■
The significant long-term exposure to industrial/logistical assets that the manager sees as a particularly good fit with CREI’s investment strategy, with typically high vacant possession values and relatively low capital expenditure requirements. Growing occupier demand, recently benefiting from the accelerated trend of online purchasing during the pandemic as well as ‘onshoring’ of supply chains in response to Brexit, and constrained supply have generated ongoing rent growth, while strong investor demand has seen yields tighten.
■
A steadily growing exposure to the out-of-town retail warehouse sub-sector, which benefits from restricted supply, generally free parking and the convenience that is complementary to growth in online sales for both click-and-collect and customer returns that has recently been significantly accelerated by the pandemic.
■
A significant exposure to ‘other’ sectors, which includes properties with a wide range of tenant exposures that would ordinarily be defensive in terms of the economic cycle but which in the past year have proved less resilient to the pandemic. These include car showrooms, petrol filling stations, children's day nurseries, restaurants, gyms, hotels, healthcare units, and more recently, ‘drive-thru’ restaurants (typically coffee and prepared food) that is in strong demand from an increasing number of tenants.
■
A highly selective approach to regional offices, a sector about which the manager has been cautious about the potential for ownership costs (through obsolescence and the requirement for capital expenditure, as well as lease incentives) to weigh on net income to a greater extent than is typically the case in other sectors.
■
A long-term decline in high street retail exposure reflecting challenging structural issues that have been accelerated by the pandemic.
|
Exhibit 12: Sector positioning (by share of portfolio income) over time |
|
|
Source: Custodian REIT data |
Of course, active asset management goes much further than portfolio positioning. CREI estimates that lease renewals and re-gears, rent reviews, new lettings, and acquisitions and disposals positively added at least c £9.4m to valuations in FY21 and more than £10m if the mitigating impact on valuation declines is also included.
CREI targets further accretive growth
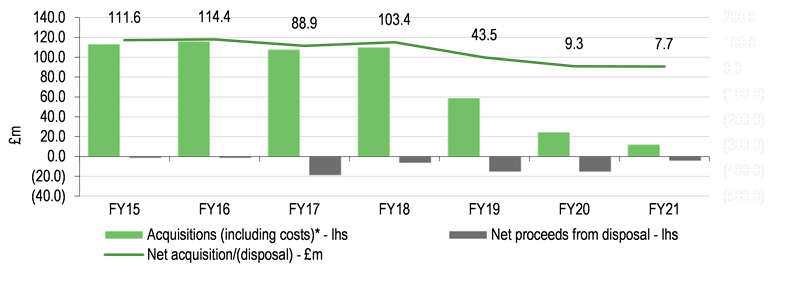
CREI targets further accretive growth in the portfolio to benefit from attractively priced assets as well as scale efficiencies, spreading fixed costs over a wider income producing asset base and ultimately reducing the marginal rate of asset management charges (on a rise in net assets above £500m). The portfolio grew strongly in the three to four years from listing (initial portfolio c £95m), funded by significant equity raises. Net acquisition activity has continued but slowed noticeably in FY20, as attractive opportunities that met CREI’s investment criteria were more difficult to identify, With demand for the shares maintaining a consistent premium to NAV, acquisitions were funded by capital recycling and by share issuance under the company’s tap issue facility. Due mainly to the pandemic, activity slowed further in FY21 but CREI nevertheless made three acquisitions for an aggregate £11.4m and sold properties for an aggregate headline consideration of £4.4m.
|
Exhibit 13: Portfolio acquisitions and disposals |
|
|
Source: Custodian REIT data, Edison Investment Research. Note: *Includes acquisition costs written off. |
The FY21 acquisitions included properties in the industrial, office and other (land and development of a drive-thru coffee outlet pre-let to Starbucks) sectors at a blended net initial yield of almost 6.5%. The disposals included a mature industrial asset (net initial yield of 4.5%), generating a gain of £0.5m, and four retail properties, acquired as part of larger transactions in 2014/15, some of which were let on short-term leases and some of which were vacant, for an aggregate £1.6m, and in line with FY21 valuation.
Exhibit 14: Summary of recent transactions
Acquisitions |
Disposals |
||||
Sector |
Location |
Price |
Sector |
Location |
Price |
FY21 |
|||||
Other |
Nottingham |
£1.6m |
Industrial |
Westerham |
£2.8m |
Industrial |
Hilton |
£2.0m |
Retail |
Four locations* |
£1.6m |
Office |
Oxford |
£7.9m |
|||
FY22 to date |
|||||
Industrial |
Knowsley |
£3.5m |
Retail |
Nottingham |
£0.7m |
Source: Custodian REIT data, Edison Investment Research. Note: * Properties in Chester, Scarborough, Bedford, and Llandudno.
The pandemic has created new opportunities for growth and with low gearing and undrawn debt facilities CREI has the financial flexibility to take advantage of opportunities as they arise. The recovery in the share price and closing of the discount to NAV that opened during the pandemic has also allowed CREI to recently recommence modest share issuance, at a premium to NAV, under its tap facility.
So far in FY22, CREI has acquired an industrial asset in Knowsley for £3.5m at a net initial yield of 5.74% and has further reduced retail exposure with the sale of a property in Nottingham for £0.7m, in line with valuation. The manager continues to monitor further opportunities for growth.
CREI preference is for selective individual property acquisitions although strategic portfolio acquisitions have historically also been undertaken; in the most recent portfolio acquisition, in October 2019 CREI acquired a portfolio of eight ‘last mile’ distribution units, well spread across the UK and let to Menzies Distribution on new 10-year leases for c £25m (before costs) reflecting a net initial yield of 6.4%. CREI also sees the potential for acquisitions from investors more negatively affected by the pandemic, including smaller corporate vehicles and open-ended funds.
Strategic disposals, particularly of mature assets, may provide capital recycling opportunities but, given the company’s desire to grow while maintaining a moderate level of gearing, larger acquisitions would likely require equity funding beyond the scope of the tap issuance facility. This may have the added advantage of broadening the shareholder base.
Management and board
CREI’s board of directors comprises six members, all of whom are non-executive and responsible for the overall management of the company’s activities. The board has appointed Custodian Capital (www.custodiancapital.com), a wholly owned subsidiary of Mattioli Woods (www.mattioliwoods.com), as investment manager to provide investment and property management, and administrative services to the company. Custodian Capital is authorised and regulated by the Financial Conduct Authority (FCA) and, in addition to acting as fund manager to CREI, provides a structure that enables investors to purchase business premises and/or other commercial property in a tax-efficient and flexible manner.
Five board members are independent of the investment manager, including the non-executive chairman, David Hunter, a professional strategic adviser focused principally on UK and international real estate, who sits on the boards of a number of listed and unlisted companies, as well as holding corporate advisory roles. The independent non-executive directors are Matthew Thorne, an experienced former finance director in the UK quoted sector and non-executive director of Bankers Investment Trust for nine years until 2018; Hazel Adam, who joined the board in December 2019 bringing a range of experience including the buy-side and sell-side investment industry, strategies and markets; Elizabeth McMeikan, a former Tesco executive and experienced board member, who joined the board in March 2021; and Chris Ireland, a former CEO of JLL UK and former chair of the Investment Property Forum, who also joined the board in March 2021. Ian Mattioli, chief executive officer of Mattioli Woods and a board member of the investment manager, is the sixth CREI non-executive director. Ed Moore, finance director of Custodian Capital is company secretary to CREI. Full details of the board can be found at www.custodianreit.com.
Custodian Capital was appointed investment manager at the IPO, an arrangement that is subject to regular board review. Richard Shepherd-Cross is the managing director of Custodian Capital and the fund manager of CREI. He is a former director of Jones Lang LaSalle in London, where he led the portfolio investment team before joining Mattioli Woods in 2009, with responsibility for its syndicated property initiative, the precursor to Custodian. In total, the Custodian Capital team that is dedicated to the management of CREI’s assets consists of 18 members, including six property professionals.
Management and administration fees are paid to the manager on a sliding scale that allows shareholders to benefit from growth NAV. The fees on continued growth in NAV above £500m were reduced during the year.
■
Property management fees charged at 0.90% pa on average net assets of up to £200m, 0.75% pa between £200m and £500m, 65% between £500m and £750m, and 0.55% above £750m.
■
Administrative fees charged at 0.125% pa on average net assets up to £200m, 0.08% pa between £200 and £500m, 0.05% between £500m and £750, and 0.03% above £750m.
Financials
We have updated our forecasts, published in May after the Q421 NAV update, for the details provided in the FY21 results but have made no changes to the key financial numbers, including EPRA EPS, EPRA NTA and DPS.
We forecast an increase in FY22 EPRA earnings and EPS to £25.8m (FY21: £23.7m) and 6.1p (FY21: 5.6p) respectively, driven by lower receivables provisions/write-offs, with further growth in FY23, driven by reversionary capture/void reductions.
The key forecasting uncertainties relate to rental income and collection and our assumptions include:
■
Slightly lower net rental income in FY22 due to the lower start-year annualised contracted rental income compared with FY21, partly offset by an improvement in occupancy. We expect modest growth in ERV in FY22, continuing to be driven by industrial assets, with a slightly faster pick-up in FY23 (c 0.8%) across a broader base of the portfolio.
■
Further charges against rent receivable in FY22 at a reduced rate (a net £0.6m versus £3.6m in FY21), balancing an expectation that collection rates to further improve as the lockdown eases with the potential negative impact of current CVAs and administrations. This may prove to be conservative, given the current level of provisioning and the potential to collect outstanding rents from financially viable tenants that have chosen to delay payment during the government moratorium on eviction.
Our NAV forecasts benefit from relatively low but positive capital return assumptions that we estimate on a sector-by-sector basis, driven by modest forecast growth in ERV and implying no change in valuation yields. For FY22, we expect a blended gross increase of c 1% before adjustment for capex, again driven by industrial assets. For FY23 we expect a blended c 1.5% as the recovery in capital values broadens across sectors. As always, there is much uncertainty about this. Each 1% increase/decrease in the value of the investment portfolio compared with our forecast would increase/decrease NAV per share by c 1.3%.
Securely funded with low gearing
Custodian operates with moderate gearing and mostly fixed rate debt, much of which is long term, mitigating interest rate risk.
Custodian operates with four loan facilities amounting to £150m in aggregate (with the option to increase to £165m with lender agreement), comprising:
■
A £20m term loan with Scottish Widows at a fixed rate of 3.9335%, repayable in August 2025.
■
A £45m term loan with Scottish Widows at a fixed rate of 2.987%, repayable in June 2028.
■
A £50m term loan with Aviva Investors Real Estate Financing comprising:
•
a £35m tranche at a fixed rate of 3.02%, repayable in April 2032; and
•
a £15m tranche at a fixed rate of 3.26%, repayable in November 2032.
■
A £35m variable rate revolving credit facility with Lloyds Bank, that may be increased to £50m with consent from the lender, that carries an interest margin of between 1.5% and 1.8% (depending on LTV) and matures in September 2023.
At end-FY21, £140m of the debt facilities were drawn and, including unrestricted cash of £2.7m, net debt was £137.3m with an LTV ratio of 24.9%. The weighted average cost of the debt facilities was 3.0%, 77% fixed rate, and the weighted average maturity was 7.4 years.
Each of the facilities has its own discrete security pool comprising individual properties over which the relevant lender has security and covenants. The facilities contain market-standard cross guarantees such that a default on an individual facility results in all facilities falling into default. The covenants include:
■
A maximum LTV for the security pools of between 45% and 50% with an overarching covenant on the company level property portfolio of a maximum 35% LTV.
■
Minimum historical interest cover requiring net rental receipts (rather than accounting income) from each discrete security pool, over the preceding three months, to be at least 250% of the quarterly interest liability.
With unencumbered property assets (ie assets not within the discrete security pools) of c £165.0m (30% of the property portfolio) LTV covenants are not a concern in current market conditions. Although pre-emptive interest covers were agreed with lenders earlier in FY21, providing flexibility to collect rents in the most advantageous way, these were not required.
Sensitivities
The commercial property market is cyclical, historically exhibiting substantial swings in valuation through cycles. Income returns are significantly more stable, but still fluctuate according to tenant demand and rent terms. From a sector viewpoint, we also highlight the increased risks and uncertainties that attach to development activity, including planning consents, timing, construction risks and the long lead times to completion and eventual occupation. Custodian is not a developer but is exposed to similar but lesser uncertainties through modest forward funding of pre-let development on fixed price contracts and through investment in improvements to existing assets with the aim of enhancing long-term income growth and returns. More generally we note the sensitivity to:
■
Economic risk: the COVID-19 pandemic and Brexit continue to create a high level of uncertainty over the UK economic outlook. After the c 10% decline in UK GDP in FY20, the HM Treasury comparison of independent forecasts for the UK economy published in March 2021 shows the average of independent forecasters expecting a 6.4% recovery in 2021. The average of forecasts has increased in recent months, but the range of individual forecasts remains wide (4.9–8.1%). Average expectations for the increase in the rate of unemployment in 2021 versus 2020 have also been reducing in recent months, with an average expectation of 5.9% in Q421 and a relatively small improvement to 5.2% in Q422. Inflation picked up sharply in April 2021 with the trailing 12-month change in CPI increasing to 1.5% from 0.7% in March, while the 12-month change in RPI was 2.9%, up from 1.5% in March. Official expectations are that any increase will be a temporary phenomenon, but this is far from assured. The Treasury comparison of independent forecasters shows a mean expectation that CPI will be increasing at a 2.1% rate by Q421 and at a similar rate in Q422, but with a wide range of expectations (from 1.3% to 3.7% for 2021). A similar trend is apparent for RPI, with a mean expectation of 3.0% in Q421 and 2.9% in Q422.
■
Sector risk: some of the inherent cyclical risk to vacancy in commercial property can be mitigated by portfolio diversification. CREI’s portfolio is highly diversified by asset, sector, tenant, and geography. At end-FY21 the largest single tenant accounts for c 4% of the total rent roll, spread across 8 different assets. The portfolio contains significant reversionary income potential, substantially linked to occupancy improvement.
■
Funding risks are relatively low for Custodian, with low gearing and predominantly fixed rate debt, much of it longer term. While this mitigates interest rate risk, on a long-term basis interest rates remain historically low and any significant increase, especially in long-term rates may be expected to negatively affect market-wide property valuations.
■
Management risk: as CREI is externally managed, any management risk is indirect. Custodian Capital, the external manager, operates with a relatively small team, and if a senior member of that team were to leave, they would need to be replaced.
Exhibit 15: Financial summary
Year end 31 March, £m |
2017 |
2018 |
2019 |
2020 |
2021 |
2022e |
2023e |
IFRS |
IFRS |
IFRS |
IFRS |
IFRS |
IFRS |
IFRS |
|
PROFIT & LOSS |
|||||||
Gross rental income |
27.0 |
34.1 |
39.1 |
40.0 |
38.7 |
38.1 |
39.0 |
Non-recoverable property costs |
(1.2) |
(0.9) |
(1.5) |
(1.5) |
(2.0) |
(1.9) |
(1.8) |
Rent receivables provisions/write |
0.0 |
0.0 |
0.0 |
(0.3) |
(3.6) |
(0.6) |
0.0 |
Net rental income |
25.7 |
33.2 |
37.6 |
38.1 |
33.1 |
35.6 |
37.2 |
Administrative expenses |
(3.6) |
(4.4) |
(4.9) |
(4.8) |
(4.6) |
(4.7) |
(4.8) |
Operating Profit before revaluations |
22.1 |
28.8 |
32.7 |
33.4 |
28.5 |
30.9 |
32.4 |
Revaluation of investment properties |
9.0 |
11.9 |
(5.5) |
(25.9) |
(19.6) |
2.8 |
5.4 |
Costs of acquisitions |
(6.1) |
(6.2) |
(3.4) |
(0.6) |
(0.7) |
(0.2) |
0.0 |
Profit/(loss) on disposal |
1.6 |
1.6 |
4.3 |
(0.1) |
0.4 |
0.0 |
0.0 |
Operating Profit |
26.6 |
36.1 |
28.0 |
6.8 |
8.6 |
33.4 |
37.8 |
Net Interest |
(2.4) |
(3.7) |
(4.4) |
(4.7) |
(4.8) |
(5.1) |
(5.1) |
Profit Before Tax |
24.2 |
32.4 |
23.6 |
2.1 |
3.7 |
28.3 |
32.7 |
Taxation |
0.0 |
0.0 |
0.0 |
0.0 |
0.0 |
0.0 |
0.0 |
Profit After Tax |
24.2 |
32.4 |
23.6 |
2.1 |
3.7 |
28.3 |
32.7 |
Net revaluation of investment property/costs of acquisition |
(2.9) |
(5.6) |
8.9 |
26.4 |
20.3 |
(2.6) |
(5.4) |
Gains/(losses) on disposal |
(1.6) |
(1.6) |
(4.3) |
0.1 |
(0.4) |
0.0 |
0.0 |
EPRA earnings |
19.7 |
25.2 |
28.5 |
28.7 |
23.7 |
25.8 |
27.3 |
Average Number of Shares Outstanding (m) |
298.7 |
362.4 |
391.9 |
409.7 |
420.1 |
420.5 |
420.6 |
IFRS EPS (p) |
8.10 |
8.9 |
6.0 |
0.5 |
0.9 |
6.7 |
7.8 |
EPRA EPS (p) |
6.59 |
6.9 |
7.3 |
7.0 |
5.6 |
6.1 |
6.5 |
Dividend per share (p) |
6.35 |
6.45 |
6.55 |
6.65 |
5.00 |
5.60 |
6.00 |
Dividend cover (x)* |
1.01 |
1.06 |
1.10 |
1.04 |
1.13 |
1.09 |
1.08 |
Ongoing charges ratio (excluding property expenses) |
0.32% |
0.33% |
0.34% |
1.11% |
1.12% |
1.14% |
1.14% |
BALANCE SHEET |
|||||||
Fixed assets |
418.5 |
528.9 |
572.7 |
559.8 |
551.9 |
563.9 |
573.9 |
Investment properties |
418.5 |
528.9 |
572.7 |
559.8 |
551.9 |
563.9 |
573.9 |
Other non-current assets |
0.0 |
0.0 |
0.0 |
0.0 |
0.0 |
0.0 |
0.0 |
Current assets |
10.3 |
12.9 |
6.1 |
30.7 |
9.9 |
4.4 |
2.0 |
Debtors |
4.5 |
7.9 |
3.7 |
5.3 |
6.0 |
7.3 |
5.3 |
Cash |
5.8 |
5.1 |
2.5 |
25.4 |
3.9 |
-3.0 |
-3.3 |
Current liabilities |
(12.6) |
(12.8) |
(14.2) |
(14.9) |
(12.8) |
(15.0) |
(14.4) |
Creditors/Deferred income |
(12.6) |
(12.8) |
(14.2) |
(14.9) |
(12.8) |
(15.0) |
(14.4) |
Short term borrowings |
0.0 |
0.0 |
0.0 |
0.0 |
0.0 |
0.0 |
0.0 |
Long term liabilities |
(64.4) |
(113.9) |
(138.1) |
(148.9) |
(139.2) |
(139.5) |
(139.9) |
Long term borrowings |
(63.8) |
(113.4) |
(137.5) |
(148.3) |
(138.6) |
(139.0) |
(139.3) |
Other long-term liabilities |
(0.6) |
(0.6) |
(0.6) |
(0.6) |
(0.6) |
(0.6) |
(0.6) |
Net assets |
351.9 |
415.2 |
426.6 |
426.8 |
409.9 |
413.7 |
421.6 |
NAV/share (p) |
103.8 |
107.3 |
107.1 |
101.6 |
97.6 |
98.4 |
100.2 |
EPRA NAV/share (p) |
103.8 |
107.3 |
107.1 |
101.6 |
97.6 |
98.4 |
100.2 |
CASH FLOW |
|||||||
Operating Cash Flow |
23.1 |
28.4 |
36.0 |
31.0 |
23.8 |
29.8 |
32.2 |
Net Interest |
(2.2) |
(3.5) |
(4.2) |
(4.4) |
(4.5) |
(4.8) |
(4.7) |
Tax |
0.0 |
0.0 |
0.0 |
0.0 |
0.0 |
0.0 |
0.0 |
Net additions to investment property |
(92.1) |
(105.9) |
(46.2) |
(12.2) |
(10.1) |
(7.4) |
(3.0) |
Ordinary dividends paid |
(18.5) |
(23.0) |
(25.5) |
(27.0) |
(20.6) |
(25.0) |
(24.8) |
Debt drawn/(repaid) |
(1.0) |
49.4 |
24.0 |
10.5 |
(10.1) |
0.0 |
0.0 |
Proceeds from shares issued (net of costs) |
91.1 |
53.9 |
13.3 |
25.0 |
0.0 |
0.6 |
0.0 |
Other cash flow from financing activities |
0.0 |
0.0 |
0.0 |
0.0 |
0.0 |
0.0 |
0.0 |
Net cash flow |
0.4 |
(0.7) |
(2.6) |
22.9 |
(21.5) |
(6.9) |
(0.3) |
Opening cash |
5.5 |
5.8 |
5.1 |
2.5 |
25.4 |
3.9 |
(3.0) |
Closing cash |
5.8 |
5.1 |
2.5 |
25.4 |
3.9 |
(3.0) |
(3.3) |
Debt as per balance sheet |
(63.8) |
(113.4) |
(137.5) |
(148.3) |
(138.6) |
(139.0) |
(139.3) |
Unamortised loan arrangement fees |
(1.2) |
(1.6) |
(1.5) |
(1.7) |
(1.4) |
(1.0) |
(0.7) |
Total debt |
(65.0) |
(115.0) |
(139.0) |
(150.0) |
(140.0) |
(140.0) |
(140.0) |
Restricted cash |
(1.3) |
(1.3) |
(1.4) |
(0.9) |
(1.2) |
(1.1) |
(1.1) |
Closing net debt |
(60.5) |
(111.3) |
(137.9) |
(125.5) |
(137.3) |
(144.1) |
(144.4) |
Net LTV |
14.4% |
21.0% |
24.1% |
22.4% |
24.9% |
25.5% |
25.2% |
Source: Custodian REIT historical data, Edison Investment Research forecasts
|
||||||||||||||||||||||||||
|
|
Research: Real Estate
FY21 results underlined the resilience of Picton Property Income’s business model and strategy. Its property portfolio showed further strong outperformance, driven by sector positioning and asset management, and with moderate gearing providing a benefit, EPRA NAV total return was a positive 6.6%. Strong reversionary potential and financial flexibility for accretive acquisitions are positive indicators for future progress.