Last close As at 05/08/2026
GBP0.74
▲ 1.10 (1.50%)
Market capitalisation
GBP382m
Research: Real Estate
FY21 results underlined the resilience of Picton Property Income’s business model and strategy. Its property portfolio showed further strong outperformance, driven by sector positioning and asset management, and with moderate gearing providing a benefit, EPRA NAV total return was a positive 6.6%. Strong reversionary potential and financial flexibility for accretive acquisitions are positive indicators for future progress.
Picton Property Income |
Positive outcome in a challenging year |
FY21 results |
Real estate |
23 June 2021 |
Share price performance
Business description
Next events
Analyst
Picton Property Income is a research client of Edison Investment Research Limited |
||||||||||||||||||||||||||||||||||||||||||||||||||||||
FY21 results underlined the resilience of Picton Property Income’s business model and strategy. Its property portfolio showed further strong outperformance, driven by sector positioning and asset management, and with moderate gearing providing a benefit, EPRA NAV total return was a positive 6.6%. Strong reversionary potential and financial flexibility for accretive acquisitions are positive indicators for future progress.
Year end |
Net property income (£m) |
EPRA |
EPRA |
DPS |
EPRA NTA/ |
P/NTA |
Yield |
03/20 |
33.6 |
19.9 |
3.7 |
3.25 |
93 |
0.94 |
3.7 |
03/21 |
33.5 |
20.1 |
3.7 |
2.93 |
97 |
0.90 |
3.4 |
03/22e |
33.9 |
20.4 |
3.7 |
3.50 |
101 |
0.86 |
4.0 |
03/23e |
35.2 |
21.4 |
3.9 |
3.58 |
105 |
0.83 |
4.1 |
Note: *EPRA earnings excludes revaluation gains/losses and other exceptional items. **Declared basis.
Continuing strong returns
FY21 total property return of 7.3% was well ahead of the MSCI UK Quarterly Property Index (1.2%), which Picton has now outperformed over one, three, five and 10 years and since inception, with top quartile performance in each of the past six years. Enhanced by moderate gearing and good cost management, the five-year NTA total return has averaged 8.0% pa. FY21 EPRA earnings and EPS were at a similar level to FY20, with lower costs and finance expense offsetting lower rental income. Rent collection was strong at 92% for the year, supporting two increases in quarterly DPS, with the current annualised run rate now back to 90% of pre-pandemic levels. Our forecasts for EPRA earnings and further DPS growth are unchanged, but we have increased our EPRA NTA forecasts.
Strong growth potential
Financial and operational performance continues to benefit from active asset management including investment in the portfolio to enhance quality, sustainability and occupier appeal, as well as active sector positioning. The strong overweighting of the better-performing industrial and regional office sectors (53% and 36% of the portfolio respectively) and significant underweighting of retail and leisure (less than 11%), was of particular benefit in FY21 and continuing. A significant opportunity remains to grow income and support capital values, highlighted by the gap between passing rent and the externally estimated market rental value at full occupancy, focused on the industrial and office sectors. The post year-end £0.5m pa letting of remaining vacant office space at the Stanford building represents good progress. Low gearing (LTV of 20.9%) and £50m of undrawn low-cost flexible borrowing provide Picton with financial flexibility to seize accretive acquisition opportunities.
Valuation: Good yield with upside in covered DPS
Based on the current annualised rate of quarterly DPS (3.2p) the yield is 3.7%. This compares favourably with risk-free alternatives and we expect further DPS growth in FY22 and FY23. The discount to end-FY21 EPRA NTA is 8%, above the five-year average of 3%.
Investment summary
Total return with an income focus
Picton’s diversified portfolio of commercial property across the UK is actively managed for total returns but with a strong focus on income (historically c 70% of UK commercial property market returns) and dividends. Through its occupier-focused, opportunity-led approach, the company aims to be one of the consistently best-performing diversified UK REITs. At the property level it has built a strong and consistent track record, in recent years benefiting from an overweight position on office and industrial sectors (c 53% and 36% by value respectively). On an ungeared basis it has outperformed the MSCI UK Quarterly Property Index over one, three, five and 10 years and since inception as at 31 March 2021 (end-FY21), with top quartile performance in each of the past six years. Enhanced by moderate gearing and good cost management, EPRA NTA1 total return in the five years to end-FY21 was a compound annual average 8.0% and 6.6% in FY21 despite the twin challenges of the pandemic and Brexit. Significant reversionary potential and balance sheet flexibility to fund accretive acquisitions should support future performance.
EPRA net tangible assets as per the updated EPRA guidelines. For Picton, equivalent to IFRS net asset value (NAV) per share, and historically to EPRA NAV per share.
Continued positive returns despite COVID-19 challenge
Despite a challenging year, FY21 recurring EPRA earnings were at a similar level to the previous year. Lower gross rental income, including provisions and write-offs against outstanding rent receivables and rent concessions, was offset by reductions in property and administrative costs, and finance expense. Like-for-like passing rent increased by 1.9%, driven by lettings and asset management activity, valuations by 3.2%, and ERV2 by 1.1%. Supported by strong retention of occupiers at lease breaks/expiry and the successful letting of recently refurbished assets, occupancy increased to 91% (FY20: 89%). With 92% of rents collected in the year, quarterly DPS was increased twice and the current annualised rate of 3.2p is 90% of the pre-pandemic level. FY21 dividends were 134% covered by EPRA earnings and fully covered by cash earnings. Our forecasts for EPRA earnings and DPS are unchanged; we expect FY22 DPS to return to the pre-pandemic level of 3.5p per share, well covered by EPRA earnings. Our EPRA NTA forecasts are increased, reflecting a stronger FY21 than we expected (97p vs 93p in FY20) and an improving market outlook.
Estimated rental value at full occupancy.
Embedded upside and flexibility for accretive acquisitions
End-FY21 ERV of £45.4m was £8.9m or 24% ahead of the annualised contracted rent roll of £36.5m, with the greatest potential in the industrial and office sectors. Void reduction represents £4.0m of the potential upside, with the balance comprising upside from lease incentive run-off (c £2.9m) and the potential to increase existing rents to market levels at lease expiry (c £1.9m). With occupancy close to 100% in the industrial sector the upside is from reversion to market rents (which continue to increase), while in the office sector there is considerable upside from void reduction, particularly from assets refurbished to improve quality and occupier appeal, evidenced by recent letting at the Stanford building. With low gearing (loan to value or LTV c 21%) and £50m of undrawn low-cost, flexible debt Picton is well placed to seize accretive acquisitions as opportunities may arise.
Sensitivities: Macro and sector
We review the main sensitivities on pages 12 and 13. The greatest uncertainties relate to the continuing impact of the pandemic on economic growth and the way real estate is used. The commercial property market is cyclical and property values have historically displayed significant volatility across the cycle; income returns have been significantly more stable although the level of income fluctuates with occupier demand and rent levels. Yields on well let property compare favourably with short-term interest rates and long-term risk-free rates.
FY21 results summary
FY21 results underlined the resilience of Picton’s business model and strategy, with the financial performance slightly ahead of our forecasts and the long-term track record of property outperformance versus the chosen index maintained. Performance was assisted by portfolio positioning, asset management and successful leasing of space.
Exhibit 1: Summary of FY21 performance
£m unless stated otherwise |
FY21 |
FY20 |
FY21/FY20 |
FY21e* |
Reported vs forecast |
Rental income |
36.6 |
37.8 |
-3.2% |
36.0 |
1.6% |
Other income |
1.5 |
1.2 |
28.1% |
1.4 |
3.0% |
Property operating costs |
(2.4) |
(2.3) |
4.0% |
(1.9) |
|
Void costs |
(2.2) |
(3.0) |
-26.8% |
(2.8) |
|
Net property income |
33.5 |
33.6 |
-0.5% |
32.7 |
2.2% |
Total operating expenses |
(5.4) |
(5.6) |
-3.1% |
(5.1) |
6.2% |
Underlying operating profit |
28.1 |
28.1 |
0.0% |
27.7 |
1.5% |
Net finance expense |
(8.0) |
(8.3) |
-3.5% |
(8.0) |
-0.5% |
Tax |
0.0 |
0.1 |
0.0 |
||
EPRA earnings |
20.1 |
19.9 |
0.8% |
19.6 |
2.3% |
Profit on disposal of investment property |
0.9 |
3.5 |
0.0 |
||
Investment property valuation movements |
12.9 |
(0.9) |
8.1 |
||
IFRS net profit |
33.8 |
22.5 |
50.2% |
27.7 |
21.9% |
EPRA EPS (p) |
3.7 |
3.7 |
0.5% |
3.6 |
2.3% |
IFRS EPS (p) |
6.2 |
4.1 |
5.1 |
||
DPS declared (p) |
2.93 |
3.25 |
-10.0% |
2.93 |
0.0% |
DPS paid (p) |
2.75 |
3.50 |
2.75 |
||
Dividend cover |
134% |
105% |
123% |
||
Net assets, IFRS & EPRA (£m) |
528.2 |
509.3 |
3.7% |
522.0 |
1.2% |
EPRA NTA per share (p) |
97 |
93 |
3.7% |
96 |
1.2% |
NAV total return (%) |
6.6% |
4.4% |
5.4% |
||
Investment property assets (IFRS) |
665.4 |
654.5 |
1.7% |
664.2 |
0.2% |
Net LTV (%) |
20.9% |
21.7% |
21.6% |
Source: Picton Property Income actual data. Note: *Edison Investment Research FY21 forecast.
Key features of the FY21 financial results include:
■
A modest 0.5% decline in net property income, with higher other income (primarily dilapidation receipts) and lower property costs broadly offsetting lower rental income. The decline in rental income substantially reflects the pandemic-related increase in provisioning/the write-off of receivables of c £1.8m versus c £0.5m in FY20.
■
Operating expenses were tightly controlled, down 3.2%, with net interest expense also lower due to lower average debt.
■
EPRA earnings increased slightly, from £19.9m in FY20 to £20.1m or 3.7p per share.
■
Dividends paid of 2.75p per share were 134% covered by EPRA earnings. On a declared basis (the Q421 DPS was paid on 28 May) DPS was 2.93p.
■
Including positive realised and unrealised property valuation movements of £13.8m (FY20: £2.4m), IFRS earnings increased c 50% to £33.8m and IFRS net asset value (NAV) per share, equivalent to EPRA NTA, increased to 97p versus 93p in FY20.
■
EPRA NTA total return (change in NTA plus dividends paid) was 6.6%.
■
A low loan to value ratio was maintained through the year (end-FY21: 20.9%).
Operationally, we highlight:
■
A total property portfolio return of 7.3%, ahead of the MSCI UK Quarterly Property Index return of 1.2%, driven by a strong weighting to the industrial sector which continued to perform strongly and asset management initiatives across the portfolio.
■
A total of 17 rent reviews were completed at an average 7% ahead of the ERV; 30 leases were renewed or regeared at an average 10% ahead of ERV; and 25 new lettings or lease agreements were completed at an average 3% ahead of ERV.
■
On a like-for-like basis, passing rent increased by 1.9%, driven by lettings and asset management activity, valuations by 3.2%, and ERV by 1.1%.
■
Supported by a high (88%) retention of occupiers at lease breaks and lease expiry, and successful letting of recently refurbished assets, occupancy increased by two percentage points to 91%.
Robust rent collection underpinned quarterly dividend increases
Overall rent collection held up well with 92% of rents due during the year collected and a further 1% deferred for a short period by agreement. Quarterly rent collection for the March 2021 quarter (predominantly Q122 rental income) was 94%, including monthly payments at the date of the results release.
There was considerable variation in rent collection across sectors in FY21, with office collection the strongest and, not surprisingly, retail and leisure collection the weakest. Having engaged directly with occupiers from an early stage in the pandemic, where it felt it appropriate to do so Picton has provided assistance ranging from more flexible payment terms to the granting of rent concessions (in respect of c 4% of rents due). Depending on the position of the tenant, in some cases (28 in total) the concessions have been in return for improvements to longer-term income, typically through rent reviews agreed in advance, removal of a lease break, or lease extension; in other cases (54 in total) this has been a straight rent concession, primarily with retail- and leisure-led occupiers.3 Around 3% of rents due over the past year are outstanding, without concession of agreement. We suspect that some part of the outstanding rents reflects a reluctance to pay rather than an inability to pay, with the prospect of eventual recovery. The government moratorium on the eviction of tenants for the non-payment of rents reduces the incentive for timely payment and has recently been extended until March 2022.
Some retail- and leisure-led concessions will be reflected in Exhibit 2 in the retail and leisure asset sector but also in other sectors in respect of assets leased by such occupiers.
Exhibit 2: Rent collection data – percentage of rent due 25 March 2020 to 24 March 2021
Industrial |
Office |
Retail & Leisure |
Total |
|
Collected |
91% |
97% |
85% |
92% |
Deferred |
1% |
0% |
4% |
1% |
Concessions agreed |
4% |
2% |
8% |
4% |
Outstanding |
4% |
1% |
3% |
3% |
Total |
100% |
100% |
100% |
100% |
Source: Picton Property Income
During FY21, the stock of provisions against receivables increased by c £0.2m to c £1.8m after a c £1.6m write-off, an aggregate c £1.8m total impact on net income. Picton also agreed for tenant rent deposits, amounting to c £0.6m in aggregate, to be drawn down in lieu of rent payments due. The end-FY21 receivables provision amounts to c 5% of rent roll.
Focus on income to deliver returns
In this section of the report we focus on Picton’s business model and strategy in greater depth and in later sections we update on our estimates and the valuation of the shares.
The company
Picton Property Income is an internally managed UK REIT that invests in a diversified portfolio of commercial property assets from the main commercial property sector across the UK. It is total return driven with an income focus and aims to generate attractive returns through pro-active management of the portfolio, investing in assets where it believes there are opportunities to enhance income and/or value. Its dividend policy is to distribute most of the recurring income earnings to shareholders via quarterly dividends, maintaining full cover, and generating surplus cash for reinvestment back into the portfolio. The company’s aim is to be one of the consistently best-performing diversified UK REITS.
|
Exhibit 3: Asset growth and gearing* |
Exhibit 4: Trend in DPS and dividend cover* |
|
|
|
Source: Picton Property Income. Note: *Gearing measured as net LTV. |
Source: Picton Property Income. Note: *Dividend cover measured as aggregate EPRA earnings divided by aggregate dividends paid. |
|
Exhibit 3: Asset growth and gearing* |
|
|
Source: Picton Property Income. Note: *Gearing measured as net LTV. |
|
Exhibit 4: Trend in DPS and dividend cover* |
|
|
Source: Picton Property Income. Note: *Dividend cover measured as aggregate EPRA earnings divided by aggregate dividends paid. |
Leadership and governance
The board comprises six members: four non-executive and two executives. The non-executive directors bring considerable experience from across the real estate, real estate financing and financial services sectors. Lena Wilson CBE replaced Nicholas Thompson as chair in February 2021 (having joined the board in January), bringing a wide range of business and board experience to the group; she is on a number of boards in a non-executive capacity, including NatWest Group and Argentex Group, and is chair of Chiene + Tait LLP; she was chief executive of Scottish Enterprise from 2009 until 2017 and prior to that, was a senior investment adviser at The World Bank. The other non-executives are Mark Batten (chair of the audit and risk committee and the senior independent director), Maria Bentley (chair of the remuneration and nominations committees) and Richard Jones (chair of the property and valuation committee).
The executive board members are CEO Michael Morris and FD Andrew Dewhirst. Michael Morris has more than 25 years’ experience in the UK commercial property sector and has worked with the group since it was launched in 2005. Andrew Dewhirst joined Picton in 2011 and has over 30 years’ experience in the real estate and financial services sector. Brief biographies of the key members of the leadership team may be found on page 15 and detailed board biographies may be found on the company website.
Including the CEO and CFO, the broader Picton management team comprises nine individuals, of whom five are property professionals.
Financial results underpinned by strong track record of portfolio performance
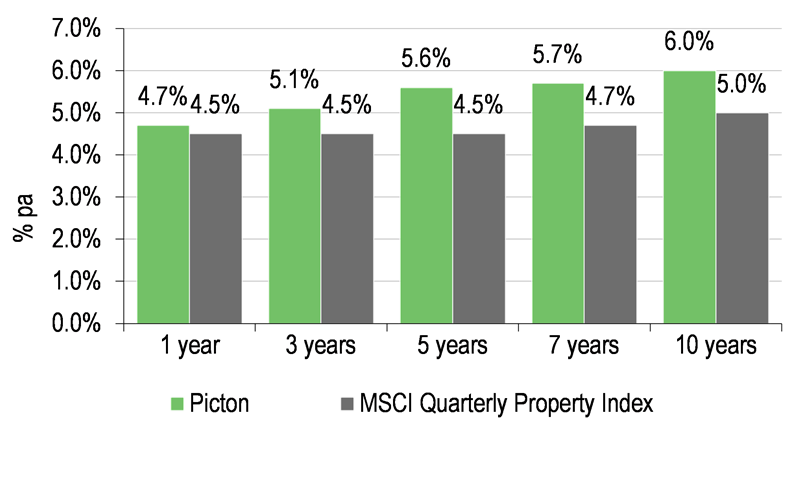
At the portfolio level Picton has built a strong track record of outperformance versus the MSCI UK Quarterly Property Index (‘the index’), generating above index income returns and total property returns on an ungeared basis over the one, three, five, seven and 10 years (to 31 March 2021). For FY21 Picton was positioned 24th of the 232 portfolios within the benchmark and performance has been upper-quartile for six consecutive years. Exhibit 6 also demonstrates the relative stability of property income returns over the longer term.
|
Exhibit 5: Total property return versus index* |
Exhibit 6: Property income return versus index* |
|
|
|
Source: Picton Property Income, MSCI. Data to 31 March 2021. Note: *Annualised percentage returns. |
|
Exhibit 5: Total property return versus index* |
|
|
Source: Picton Property Income, MSCI. Data to 31 March 2021. Note: *Annualised percentage returns. |
|
Exhibit 6: Property income return versus index* |
|
|
Source: Picton Property Income, MSCI. Data to 31 March 2021. Note: *Annualised percentage returns. |
Among the factors supporting this strong performance we note:
■
Successful asset management underpinned by the group’s occupier focus whereby it seeks to work closely with tenants to understand their needs, enhance occupancy, improve retention and maximise income. Picton continues to invest in its assets, improving the quality of the space and making it more appealing to occupiers and better able to meet their needs.
■
Although Picton maintains a diversified portfolio its unconstrained approach to portfolio construction has enabled it to make strategic adaptations to sector and asset positioning in response to changing market conditions. The significant weighting to the industrial property sector and underweight, highly selective exposure to the retail property continues to benefit performance.
The evolution of Picton’s portfolio positioning over time can be seen in Exhibit 7.
|
Exhibit 7: Sector positioning through time |
|
|
Source: Picton Property Income data |
Although Picton’s approach to buying and selling assets is often opportunistic the shifts in portfolio positioning reflect some significant recycling of capital and strategic changes in the portfolio as the current property cycle has developed. During FY14–16 it took advantage of positive market conditions (increasing rents and rising valuations) to grow the portfolio. Alongside a step-up in investment this also included significant disposals in FY14, ahead of valuation, as the portfolio was repositioned, including a targeted increase in average lot size. In FY17, ongoing strategic repositioning of the portfolio saw central London assets disposed of, along with several non-core assets at well above valuation, further increasing lot size and reducing gearing. Activity has recently moderated with Picton stepping up investment in asset management projects within the existing portfolio, with more than £15m invested into the portfolio over the past three years (£5m in FY21). Picton was a net seller of assets in the past three years, including further reducing retail exposure, and entered the pandemic conservatively positioned with low gearing and undrawn debt capacity. From this position it continues to seek attractive acquisitions and although management indicates that it is comfortable with the current portfolio structure, we expect it to be opportunistic and consider opportunities across all main sectors.
|
Exhibit 8: Opportunistic approach to acquisitions and disposals overlaid with strategic positioning |
|
|
Source: Picton Property Income data |
Portfolio summary and recent performance
At 31 March 2021 (end-FY21), the externally assessed fair value of the investment portfolio was £682m (the balance sheet value includes an adjustment for lease incentives and finance leases), comprising 46 assets let to c 350 individual occupiers, reflecting a net initial yield of 4.8% and a reversionary yield of 6.3%. The diversity of the portfolio and occupier base spreads risk and is a key factor in supporting a stable income stream.
Asset allocation, combined with asset management, and profitable disposal were all factors supporting FY21 portfolio performance. Active positioning of the portfolio is reflected in the current sector weightings with industrial property at c 53% by value (compared with c 30% for the index), office property at c 36% (compared with c 28% for the index) and retail and leisure property at c 11% (less than half the index weight of c 25%). Geographically the portfolio has a regional focus.
Picton’s FY21 total property return of 7.3% (MSCI UK Quarterly Property Index: 1.2%) comprised a 3.2% capital return and a 4.1% income return. Picton’s industrial assets generated like-for-like growth in valuation of 9% and 6% growth in passing rent. Office rents also increased by 2% on a like-for-like basis (regional offices up 3% and London, where Picton has relatively modest exposure, down 2%), although capital values were 5% lower. In common with the market, retail values declined by 9% and passing rent by 7%.
The end-FY21 annualised contracted rent roll was £36.5m (+1.9% like-for-like) and the externally estimated full occupancy market rental value (ERV) was £45.4m (+1.1% like-for-like), highlighting the significant income and value potential embedded in the current portfolio. Much of this reflects the potential to further increase occupancy, which increased by two-percentage points to 91% in FY21, primarily reflecting successful letting of refurbished properties.
Exhibit 9: Portfolio summary
31 March 2021 |
31 March 2020 |
31 March 2019 |
|
FY21 |
FY20 |
FY19 |
|
Portfolio valuation |
£682m |
£665m |
£685m |
Number of properties |
46 |
47 |
49 |
Average lot size |
£14.8m |
£14.1m |
£14.0m |
Net initial yield |
4.8% |
4.9% |
5.0% |
Net reversionary yield |
6.3% |
6.4% |
6.3% |
Annualised rental income |
£36.5m |
£36.2m |
£37.7m |
Annualised reversionary income |
£45.4m |
£45.2m |
£46.8m |
Occupancy as % estimated rental value (ERV) |
91% |
89% |
90% |
Weighted average unexpired lease term |
4.9 years |
5.5 years |
5.1 years |
Source: Picton Property Income
One asset was sold during the year; a retail property in Peterborough sold for c £4.0m, a 30% premium to the 31 March 2020 valuation.
Significant potential within the existing portfolio
The end-FY21 ERV of £45.4m was £8.9m or 24% ahead of the annualised contracted rent roll of £36.5m. Void reduction represents £4.0m of the potential upside, with the balance comprising the upside from lease incentive run-off (c £2.9m) and the potential to increase existing rents to market levels at lease expiry (c £0.1.9m).
Exhibit 10: ERV by sector at end-FY21
£m unless stated otherwise |
Contracted rent roll |
ERV |
Occupancy |
Reversion |
||
Total |
Void reduction |
Other* |
||||
Industrial |
16.9 |
19.3 |
100% |
2.4 |
0.0 |
2.4 |
Office |
13.1 |
19.0 |
82% |
5.9 |
3.4 |
2.4 |
Retail & Leisure |
6.4 |
7.1 |
92% |
0.7 |
0.6 |
0.1 |
Portfolio total |
36.5 |
45.4 |
91% |
9.0 |
4.0 |
4.9 |
Source: Picton Property Income data and Edison Investment Research. Note: Columns may not total due to rounding. *Includes £2.9m of rent free ‘run-off’ and £1.9m upside from contracted rents to market rents.
By sector, the greatest potential is within the industrial and office sectors. With occupancy close to full in the industrial sector the upside is from reversion to market rents (which continue to increase) while in the office sector there is considerable upside from void reduction. In retail and leisure there is scope to increase occupancy, although ERVs continue to decline, putting pressure on rent levels.
|
Exhibit 11: Portfolio occupancy trend |
|
|
Source: Picton Property Income data |
Although it increased during FY21, the current level of occupancy remains below the longer-term trend, in part reflecting the focus on asset improvement and refurbishment in recent years. The top five voids within the portfolio accounted for more than 70% of the c £4.0m total at end-FY21, most of which represented current or recently completed refurbishments, including the Stanford Building in Covent Garden where the refurbishment was completed earlier in 2021. Second floor office space and a fifth floor residential unit were let during FY21 and first floor retail space was converted to office use (with a significantly higher ERV) for own occupation, at reduced cost to Picton, on expiry of its lease in London’s City district. Since end-FY21 the remaining office space on the third and fourth floors has been let, representing £0.5m pa of rental income, leaving only the ground floor retail space vacant. Although the £80 per sq ft at which the third and fourth floor office was let was 3% below ERV it reflected a longer-term 10-year lease commitment.
While lease maturities reflect an element of income risk, they also provide an opportunity to reset rents towards or ahead of ERV, as was the case in FY21. Maturities during the next three years represent a reasonable balance of risk and opportunity (Exhibit 12). Picton forecasts 24 lease events in the industrial sector in the coming year, where the overall ERV for these units is 23% higher than the current £2.2m passing rent, providing an opportunity to grow income and value further. In the office sector the focus will be on reducing voids although 36 lease events are forecast with an average ERV 1.8% above passing rent.
|
Exhibit 12: Lease maturity profile |
|
|
Source: Picton Property Income data |
No significant changes in portfolio structure expected
Although the pandemic has significantly accelerated some of the ongoing structural shifts in the property market, most obviously with the retail sector, and reinforced the polarisation of sector performance, the market fundamentals and consensus point to a continuation of existing trends. In this context Picton believes the portfolio is well placed in respect of both its sector allocations and the quality of its assets.
During the 12 months to March 2021, the MSCI UK Monthly Property Index showed a total return of 1.2% (prior 12 months -0.4%) with positive monthly returns from July 2020 onwards. Income returns have been relatively stable across the market while capital returns have varied widely across sectors and even within sectors. The industrial capital return was 9.6%, a three-year high, while that for retail was -12.9%; the office sector capital return was -4.5%.
Going into the pandemic both the industrial and regional office sectors had been benefiting from a positive demand-supply balance. For industrial property occupational demand remained strong, particularly for logistics assets to meet the accelerated growth of e-commerce, and smaller multi-let estates, less affected by the pandemic. Rents continued to rise and investment demand increased. Picton expects its industrial assets to continue to contribute strongly to performance.
Although the pandemic has raised many questions about the future role of the office, Picton believes the ‘death of the office’ has been vastly overstated and notes that business activity has begun to pick up. It highlights the important role that the office plays in company culture and productivity, being a place for both concentrated work and collaboration, connection, innovation and social interaction. The company anticipates changes in the way offices are used, with some employers adopting a hybrid model, balancing home-working with office attendance, and providing less densely occupied space with greater attention to wellbeing; but an overall continuing demand for quality space, which Picton’s available refurbished space provides.
It is difficult to predict an end to the pressures on the retail and leisure sector overall. Within the sector, Picton is increasingly positive about the retail warehouse sub-sector (almost two-thirds of its sector exposure), which it believes should continue to fair relatively better than other sub-sectors, given the convenience of the assets, ease of parking and ability to support online purchases through click and collect. High Street exposure within the portfolio is more than 90% let and there is no shopping centre exposure.
Financials
There is no change to our underlying/EPRA earnings or DPS forecasts but our forecast for EPRA NTA per share increases, driven by a higher than forecast end-FY20 NTA and a more positive outlook.
Exhibit 13: Summary of forecast revisions
Net property income (£m) |
EPRA earnings (£m) |
EPRA EPS (p) |
EPRA NTA/share (p) |
DPS (p) |
|||||||||||
Old |
New |
% change |
Old |
New |
% change |
Old |
New |
% change |
Old |
New |
% change |
Old |
New |
% change |
|
FY22e |
33.9 |
33.9 |
0.0 |
20.4 |
20.4 |
0.0 |
3.7 |
3.7 |
(0.1) |
96 |
101 |
5.3 |
3.50 |
3.50 |
0.0 |
FY23e |
35.2 |
35.2 |
0.0 |
21.4 |
21.4 |
0.0 |
3.9 |
3.9 |
0.5 |
98 |
105 |
6.9 |
3.58 |
3.58 |
0.0 |
Source: Edison Investment Research
Our forecasts, shown in detail in Exhibit 18, are based on an unchanged portfolio, although the company continues to monitor potential accretive acquisition opportunities and with modest gearing and undrawn borrowing facilities is well placed to fund these.
Within our net property income forecast we assume a further £0.5m of net receivables provisioning/write-offs in FY22. Forecast growth in gross rent roll is driven by reversionary capture in industrial and void reduction in offices, partly offset by rent pressure in retail. At the group level we look for annualised rent roll to increase from £36.5m at end-FY21 to £37.7m at end-FY22 and £39.3m at end-FY23.
We forecast DPS to return to the pre-pandemic level of 3.5p per share in FY22, with the quarterly rate of DPS increasing from the current 0.8p to 0.875p, with a further increase to 3.58p in FY23. We expect dividend cover of c 1.1x.
There remains a high degree of uncertainty around the likely direction of capital values. The most recent consensus forecast published by the Investment Property Forum in May 2021 indicates all-property capital value growth of 2.3% in 2022 and 1.9% in 2023, driven by the industrial sector, with a positive performance from the office sector, and in the retail sector, continued weakness in shopping centres and standard retail but modest growth in retail warehouse. For Picton, we have allowed for leasing progress/void reduction to support property valuations, driving like-for-like valuation growth (adjusted for capex) of 2.5% in FY22 and 2.3% in FY23 (3.0p and 2.3p per share respectively). Our assumptions are consistent with an unchanged portfolio net initial yield. Each 1% increase/decrease in the total portfolio value is equivalent to an increase/decrease in EPRA NTA per share of c 1.4p.
Strong balance sheet with flexibility for acquisitions
End-FY21 borrowings amounted to £166.2m, comprising long-term (first maturity 2027), fixed-rate loan notes with Aviva and Canada Life. A £50m revolving credit facility (RCF) remained undrawn, providing flexibility to pursue acquisition opportunities that may arise. Allowing for £23.4m of cash, net debt was £142.8m and the net LTV was a moderate 20.9%.
The average fixed cost of the drawn debt was c 4.2% with a weighted average term to maturity of 8.9 years as at 31 March 2021. The undrawn RCF has a low margin over Libor of 1.5%.
The current market cost of debt is below that of Picton’s existing long-term fixed rate debt, reflected in the disclosed fair value of the debt (£187.2m at end-FY21) being above the carried value. Picton indicates that it will consider any opportunities that may arise to reduce the cost of borrowing through a refinancing. This would reduce interest expense and increase EPRA earnings, but it would also be necessary to compensate the existing lenders, involving a cash payment and reduction in NAV. For this reason. we would expect the result of any refinancing to be broadly value neutral.
All borrowing covenants were met during the past year and provide a good level of headroom in respect of interest cover/debt service ratios and LTV.
Exhibit 14: Summary of debt portfolio at end-FY21
Canada Life |
Aviva |
RCF |
|
Amount drawn |
£80.0m |
£86.8m |
nil |
Undrawn |
Fully drawn |
Fully drawn |
£50.0m |
Maturity |
Jul-27 |
Jul-32 |
01/05/2024* |
Interest rate |
Fixed 4.08% |
Fixed 4.38% |
Libor +1.5% |
Commitment fee |
N/A |
N/A |
0.60% |
LTV covenant |
65% |
65% |
55% |
Interest cover covenant |
1.75x |
2.5x |
|
Debt service cover ratio covenant |
1.4x |
Source: Picton Property Income. Note: *One-year extension option subject to lender approval.
Valuation and performance
Although total-return driven, Picton puts a strong focus on sustainable dividends, fully covered by earnings and at a level that provides the financial flexibility to pursue asset management initiatives aimed at enhancing asset quality, occupancy, rental income and capital values over the medium term. Although quarterly dividend payments were consistently maintained throughout the past year, this was at a reduced rate during H121. Quarterly DPS payments increased twice in H221 and the current annualised rate of 3.2p represents 90% of the pre-pandemic level. FY21 aggregate DPS paid was 1.34x covered by EPRA earnings (1.22x in H221).
Combining growth in EPRA NTA per share with DPS paid over the past five years (to 31 March 2021/end-FY21), Picton has generated consistently positive EPRA NTA total returns on an annual basis, amounting to 46.6% in aggregate or a compound annual average return of 8.0% (without assuming reinvestment of dividends paid). Our forecasts imply a total return of 8.1% in FY22 and 7.4% in FY23.
Exhibit 15: Five-year NTA total return history
Year ending 31 March |
FY17 |
FY18 |
FY19 |
FY20 |
FY21 |
Cumulative five-year |
Opening EPRA NTA per share (p) |
77 |
82 |
90 |
93 |
93 |
77 |
Closing EPRA NTA per share (p) |
82 |
90 |
93 |
93 |
97 |
97 |
DPS paid (p) |
3.30 |
3.40 |
3.50 |
3.50 |
2.75 |
16.5 |
EPRA NTA total return |
10.2% |
14.7% |
6.4% |
4.4% |
6.6% |
46.6% |
Compound annual total return |
8.0% |
Source: Picton Property Income data
The current quarterly run-rate of DPS (0.8p) represents an annualised rate of 3.2p or a 3.7% yield. We forecast further increases in quarterly DPS during FY22, restoring the annual DPS declared to its pre-pandemic level of 3.5p, a prospective yield of 4.0%.
The current P/EPRA NTA per share of 0.90x shows a significant recovery from early 2020 as pandemic uncertainty was at a high; the past 5-year average of c 0.94x captures the 2020 weakness, and the 5-year high is c 1.1x.
|
Exhibit 16: Five-year P/NTA history |
|
|
Source: Company data, Refinitiv prices as at 4 June 2021 |
Exhibit 17 shows a summary performance and valuation comparison of Picton and what we consider to be its closest diversified income-oriented peers. Over 12 months, Picton’s share price performance is ahead of the group average, which shows a wide spread of performances, in some cases reflecting recovery from more acute pandemic-driven weakness in the prior period. Based on 12-month trailing DPs declared, Picton shares trade on a lower yield than the group average, which in part reflects its strategy of balancing sustainable dividends with the capital requirements of active management, as well as relatively low gearing. P/NTA is also above the peer average and taken together we believe the valuation is reflecting the company’s strong track record of property level performance, the future income and valuation growth potential embedded in its portfolio, and its strong balance sheet with relatively modest gearing.
Exhibit 17: Peer valuation and price performance comparison
Price |
Market cap |
P/NTA |
Trailing yield |
Share price performance |
||||
1 month |
3 months |
12 months |
From 12M high |
|||||
AEW REIT |
94 |
149 |
0.95 |
8.5 |
-1% |
15% |
34% |
-5% |
BMO Real Estate Investments |
71 |
170 |
0.71 |
4.5 |
0% |
-3% |
35% |
-13% |
BMO Commercial Property Trust |
88 |
703 |
0.74 |
3.2 |
8% |
25% |
22% |
-6% |
Custodian |
98 |
413 |
1.01 |
4.6 |
2% |
9% |
6% |
-5% |
Ediston Property |
68 |
144 |
0.79 |
6.3 |
0% |
-4% |
36% |
-6% |
McKay Securities |
223 |
209 |
0.72 |
3.7 |
-1% |
6% |
16% |
-9% |
Regional REIT |
87 |
375 |
0.85 |
7.0 |
-4% |
12% |
19% |
-6% |
Schroder REIT |
47 |
232 |
0.78 |
4.7 |
5% |
19% |
42% |
-5% |
Standard Life Investment Property |
73 |
295 |
0.85 |
4.7 |
13% |
18% |
9% |
-3% |
Average |
0.82 |
5.2 |
2% |
11% |
24% |
-7% |
||
Picton |
87 |
477 |
0.90 |
3.3 |
5% |
-1% |
29% |
-5% |
UK property sector index |
1,766 |
2% |
10% |
17% |
-3% |
|||
UK equity market index |
4,027 |
1% |
5% |
16% |
-2% |
|||
Source: Company data, Refinitiv prices as at 22 June 2021. Note: *Based on last reported EPRA NAV/NTA. **Based on trailing 12-month DPS declared.
Sensitivities
The commercial property market is cyclical, historically exhibiting substantial swings in valuation through cycles. Income returns are significantly more stable, but still fluctuate according to tenant demand and rent terms. From a sector viewpoint we also highlight the increased risks and uncertainties that attach to development activity, including planning consents, timing, construction risks and the long lead times to completion and eventual occupation. Picton is not a developer, but is exposed to similar but lesser uncertainties, as it actively invests in improvements to existing assets with the aim of enhancing long-term income growth and returns. More generally we note the sensitivity to:
■
Economic risk: the COVID-19 pandemic and Brexit continue to create a high level of uncertainty regarding the UK economic outlook. Following the c 10% decline in UK GDP in FY20 the HM Treasury comparison of independent forecasts for the UK economy published in March 2021 shows the average of independent forecasters expecting a 6.4% recovery in 2021. The average of forecasts has increased in recent months, but the range of individual forecasts remains wide (4.9–8.1%). Average expectations for the increase in the rate of unemployment in 2021 versus 2020 have also been reducing in recent months, with an average expectation of 5.9% in Q421 and a relatively small improvement to 5.2% in Q422. Inflation picked up sharply in April 2021 with the trailing 12-month change in CPI increasing to 1.5% from 0.7% in March, while the 12-month change in RPI was 2.9%, up from 1.5% in March. Official expectations are that any increase will be a temporary phenomenon, but this is far from assured. The Treasury comparison of independent forecasters shows a mean expectation that CPI will be increasing at a 2.1% rate by Q4 of 2021 and at a similar rate in Q4 of 2022, but with a wide range of expectations (from 1.3% to 3.7% for 2021). A similar trend is apparent for RPI, with a mean expectation of 3.0% in Q4 of 2021 and 2.9% in Q4 of 2022.
■
Sector risk: some of the inherent cyclical risk to vacancy in commercial property can be mitigated by portfolio diversification. Picton invests across the main UK commercial property sectors, with a portfolio that is well diversified by property and by individual occupiers. As at end-FY21 the largest single tenant accounts for less than 4% of the total portfolio income and the largest property for less than 15% of portfolio value. The portfolio contains significant reversionary income potential, substantially linked to occupancy, which is currently below the long-term trend due to the timing of lease surrenders, asset management activity undertaken in the past two years, and the impact of the pandemic in slowing letting activity across the market.
■
Funding risks are relatively low for Picton in a sector context. The company continues to operate with low gearing (LTV of 20.9% at end FY21) and has £50m undrawn flexible borrowing facilities to provide scope for attractive acquisitions should opportunities arise. All outstanding debt is fixed rate and long duration (average term at end-FY21 of 8.9 years). On a long-term basis interest rates remain historically low and while the cost of Picton’s debt is fixed, any significant increase in long-term rates may be expected to negatively affect market-wide property valuations.
■
Management risk: as Picton is internally managed there is some management risk. With a relatively small team, the loss of any senior member has the potential to be disruptive and if any of the directors were to leave, they would need to be replaced.
Exhibit 18: Financial summary
Year end 31 March (£m) |
2017 |
2018 |
2019 |
2020 |
2021 |
2022e |
2023e |
IFRS |
IFRS |
IFRS |
IFRS |
IFRS |
IFRS |
IFRS |
|
PROFIT & LOSS |
|||||||
Rents receivable, adjusted for lease incentives |
40.6 |
41.4 |
40.9 |
37.8 |
36.6 |
38.1 |
39.4 |
Other income |
7.4 |
1.4 |
1.1 |
1.2 |
1.5 |
0.4 |
0.4 |
Service charge income |
6.5 |
5.9 |
5.7 |
6.7 |
5.3 |
5.7 |
5.9 |
Revenue from properties |
54.4 |
48.8 |
47.7 |
45.7 |
43.3 |
44.2 |
45.7 |
Property operating costs |
(3.5) |
(2.6) |
(2.3) |
(2.3) |
(2.4) |
(2.4) |
(2.5) |
Property void costs |
(2.0) |
(1.8) |
(1.4) |
(3.0) |
(2.2) |
(2.2) |
(2.2) |
Recoverable service charge costs |
(6.5) |
(5.9) |
(5.7) |
(6.7) |
(5.3) |
(5.7) |
(5.9) |
Property expenses |
(12.0) |
(10.3) |
(9.4) |
(12.0) |
(9.9) |
(10.3) |
(10.6) |
Net property income |
42.4 |
38.4 |
38.3 |
33.6 |
33.5 |
33.9 |
35.2 |
Administrative expenses |
(5.2) |
(5.6) |
(5.8) |
(5.6) |
(5.4) |
(5.7) |
(6.0) |
Operating Profit before revaluations |
37.1 |
32.9 |
32.5 |
28.1 |
28.1 |
28.2 |
29.2 |
Revaluation of investment properties |
15.1 |
38.9 |
10.9 |
(0.9) |
12.9 |
21.6 |
18.8 |
Profit on disposals |
1.8 |
2.6 |
0.4 |
3.5 |
0.9 |
0.0 |
0.0 |
Operating Profit |
54.1 |
74.4 |
43.7 |
30.7 |
41.8 |
49.8 |
48.0 |
Net finance expense |
(10.8) |
(9.7) |
(9.1) |
(8.3) |
(8.0) |
(7.8) |
(7.8) |
Debt repayment fee |
0.0 |
0.0 |
(3.2) |
0.0 |
0.0 |
||
Profit Before Tax |
43.2 |
64.7 |
31.4 |
22.4 |
33.8 |
42.0 |
40.2 |
Taxation |
(0.5) |
(0.5) |
(0.5) |
0.1 |
0.0 |
0.0 |
0.0 |
Profit After Tax (IFRS) |
42.8 |
64.2 |
31.0 |
22.5 |
33.8 |
42.0 |
40.2 |
Adjust for: |
|||||||
Investment property valuation movement |
(15.1) |
(38.9) |
(10.9) |
0.9 |
(12.9) |
(21.6) |
(18.8) |
Profit on disposal of investment properties |
(1.8) |
(2.6) |
(0.4) |
(3.5) |
(0.9) |
0.0 |
0.0 |
Exceptional income /expenses |
(5.3) |
0.0 |
3.2 |
0.0 |
0.0 |
0.0 |
0.0 |
Profit After Tax (EPRA) |
20.6 |
22.6 |
22.9 |
19.9 |
20.1 |
20.4 |
21.4 |
Fully diluted average Number of Shares Outstanding (m) |
540.1 |
539.7 |
541.0 |
546.2 |
546.8 |
546.4 |
546.4 |
EPS (p) |
7.92 |
11.89 |
5.75 |
4.14 |
6.20 |
7.70 |
7.37 |
EPRA EPS (p) |
3.81 |
4.19 |
4.25 |
3.66 |
3.68 |
3.74 |
3.93 |
Dividend declared per share (p) |
3.33 |
3.43 |
3.50 |
3.25 |
2.93 |
3.50 |
3.58 |
Dividends paid per share (p) |
3.300 |
3.400 |
3.500 |
3.500 |
2.750 |
3.425 |
3.560 |
Dividend cover (x) EPRA EPS/DPS declared |
115% |
122% |
121% |
113% |
126% |
107% |
110% |
Dividend cover (x) - paid dividends |
115% |
122% |
121% |
105% |
134% |
109% |
110% |
EPRA cost ratio (including direct vacancy costs) |
26.1% |
23.7% |
22.9% |
28.3% |
26.9% |
26.5% |
26.5% |
BALANCE SHEET |
|||||||
Fixed Assets |
615.2 |
670.7 |
676.1 |
654.5 |
669.5 |
696.1 |
720.9 |
Investment properties |
615.2 |
670.7 |
676.1 |
654.5 |
665.4 |
692.0 |
716.8 |
Other non-current assets |
0.0 |
0.0 |
0.0 |
0.0 |
4.1 |
4.1 |
4.1 |
Current Assets |
49.4 |
50.6 |
39.5 |
41.2 |
42.9 |
40.7 |
37.8 |
Debtors |
15.5 |
19.1 |
14.3 |
17.6 |
19.6 |
19.0 |
18.0 |
Cash |
33.9 |
31.5 |
25.2 |
23.6 |
23.4 |
21.7 |
19.8 |
Current Liabilities |
(20.6) |
(22.3) |
(23.3) |
(20.4) |
(19.9) |
(19.9) |
(19.9) |
Creditors/Deferred income |
(20.1) |
(21.6) |
(22.5) |
(19.5) |
(18.9) |
(18.9) |
(18.9) |
Short term borrowings |
(0.6) |
(0.7) |
(0.8) |
(0.9) |
(0.9) |
(0.9) |
(0.9) |
Long Term Liabilities |
(202.1) |
(211.7) |
(192.8) |
(166.0) |
(164.4) |
(164.8) |
(165.2) |
Long term borrowings |
(200.3) |
(210.0) |
(191.1) |
(164.2) |
(162.7) |
(163.1) |
(163.5) |
Other long term liabilities |
(1.7) |
(1.7) |
(1.7) |
(1.7) |
(1.7) |
(1.7) |
(1.7) |
Net Assets |
441.9 |
487.4 |
499.4 |
509.3 |
528.2 |
552.2 |
573.7 |
NAV/share (p) |
82 |
90 |
93 |
93 |
97 |
101 |
105 |
Fully diluted EPRA NTA/share (p) |
82 |
90 |
93 |
93 |
97 |
101 |
105 |
CASH FLOW |
|||||||
Operating Cash Flow |
36.3 |
35.1 |
34.8 |
21.4 |
26.0 |
29.5 |
30.9 |
Net Interest |
(9.2) |
(9.1) |
(8.6) |
(7.9) |
(7.5) |
(7.4) |
(7.4) |
Tax |
(0.2) |
(0.3) |
(0.8) |
0.1 |
0.1 |
0.0 |
0.0 |
Net cash from investing activities |
48.7 |
(17.8) |
10.3 |
25.0 |
(1.3) |
(5.0) |
(6.0) |
Ordinary dividends paid |
(18.0) |
(18.5) |
(18.9) |
(19.0) |
(15.0) |
(18.7) |
(19.4) |
Debt drawn/(repaid) |
(46.5) |
9.2 |
(22.6) |
(27.2) |
(1.8) |
0.0 |
0.0 |
Net proceeds from shares issued/repurchased |
0.0 |
(0.9) |
(0.4) |
6.1 |
(0.6) |
0.0 |
0.0 |
Other cash flow from financing activities |
|||||||
Net Cash Flow |
11.1 |
(2.4) |
(6.3) |
(1.6) |
(0.2) |
(1.6) |
(1.9) |
Opening cash |
22.8 |
33.9 |
31.5 |
25.2 |
23.6 |
23.4 |
21.7 |
Closing cash |
33.9 |
31.5 |
25.2 |
23.6 |
23.4 |
21.7 |
19.8 |
Debt as per balance sheet |
(200.9) |
(210.7) |
(192.0) |
(165.1) |
(163.7) |
(164.0) |
(164.4) |
Un-amortised loan arrangement fees |
(3.7) |
(3.4) |
(2.7) |
(2.3) |
(2.6) |
(2.2) |
(1.8) |
Closing net (debt)/cash |
(170.8) |
(182.5) |
(169.5) |
(143.9) |
(142.8) |
(144.5) |
(146.4) |
Net LTV |
27.3% |
26.7% |
24.7% |
21.7% |
20.9% |
20.5% |
20.1% |
Source: Picton Property Income historical data, Edison Investment Research forecasts
|
||||||||||||||||||||||||||||||||||||
|
|
Research: Industrials
After delivering earnings progress in a challenging FY21 trading year, ArborGen is operationally very well positioned to deliver on its strategy of improving the volume and mix of seedling sales in its key US markets. Behind this, business resilience is improving and net debt declining, so the medium-term risk appears to be to the upside, though this is yet to be reflected in the company’s share price in our view.