Pointer Telocation (PNTR) has released record Q217 results showing the success of recent sales initiatives, particularly in the fleet management side, as well as the benefits of high operating leverage via its SaaS model, which resulted in an almost doubling of PBT vs Q216. With earnings underpinned by strong recurring revenue streams, a major new $2-3m pa CelloTrack Nano product order from the US and strong prospects for PNTR’s connected car and Internet of Vehicles offerings, we have increased our 2017 and 2018 normalised EPS forecasts by 16% and 5%, respectively and increased our DCF and peer-based valuations to $16.3/share and $15.4/share, respectively.
Written by
Pointer Telocation |
Right time, right places |
H117 results release |
Software & comp services |
11 September 2017 |
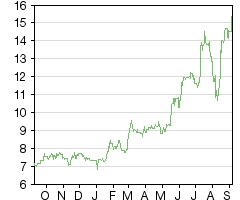
Share price performance
Business description
Next events
Analysts
|
||||||||||||||||||||||||||||||||||||||||||||||||||
Pointer Telocation (PNTR) has released record Q217 results showing the success of recent sales initiatives, particularly in the fleet management side, as well as the benefits of high operating leverage via its SaaS model, which resulted in an almost doubling of PBT vs Q216. With earnings underpinned by strong recurring revenue streams, a major new $2-3m pa CelloTrack Nano product order from the US and strong prospects for PNTR’s connected car and Internet of Vehicles offerings, we have increased our 2017 and 2018 normalised EPS forecasts by 16% and 5%, respectively and increased our DCF and peer-based valuations to $16.3/share and $15.4/share, respectively.
Year |
Revenue ($m) |
PBT* |
EPS* |
DPS |
EV/EBITDA |
P/E |
12/15 |
60.6 |
6.4 |
67 |
0.0 |
14.7 |
23.0 |
12/16 |
64.4 |
6.6 |
62 |
0.0 |
13.2 |
24.8 |
12/17e |
78.8 |
9.6 |
91 |
0.0 |
9.7 |
16.9 |
12/18e |
86.5 |
11.1 |
103 |
0.0 |
8.6 |
14.9 |
12/19e |
93.9 |
12.1 |
111 |
0.0 |
7.9 |
13.9 |
Note: *PBT and EPS (fully diluted) are normalised, excluding amortisation of acquired intangibles, exceptional items and share-based payments.
Record second quarter results
Pointer Telocation has released record Q217 results, with 25% y-o-y growth in subscriber numbers and a still high 16% excluding acquisitions, translating to 24% growth in revenues. The benefit of high operating leverage emerged decisively with normalised group EBITDA surging 56% y-o-y and PBT up 95% y-o-y.
Cutting-edge technology sets PNTR up for more wins
With the news that the NYC ride-share driver monitoring project is up and running in 5,000 cars, PNTR has moved decisively into a high-growth area of the telematics market. Similarly, the recent deployment of high-end fleet solutions systems across the first Femsa fleet in Mexico has advanced the group’s profile in cutting-edge areas. Management is optimistic of further CelloTrack Nano IoT orders after the recent $2m+ US order for 15,000 units pa. The planned launch of the Connected Car solution later this year should boost 2018 order inflows.
Valuation: Business development drives value boost
With new order inflows and the benefits of operational leverage showing through more strongly than expected, we increase our current year and 2018 normalised EBITDA expectations by 11% and 3%, respectively. This places the stock at a 27% discount to the sector on a 9.7x prospective 2017 EV/EBITDA multiple, yielding a valuation of $15.4 per share at a 10% discount to sector P/E and EV/EBITDA multiples. Our DCF valuation has been similarly boosted from $14.9 to $16.3. We have not reduced the valuation to reflect a recently filed potential $13.8m ($1.74 per share) lawsuit, and management has not yet made provisions for it.
Business update
Pointer Telocation has worked at a frenetic pace in terms of new business development in recent quarters. The group has already announced deployment of all 5,000 driver monitoring units in its Internet of Vehicles project in New York after first announcing the project in January of this year. It has also reported being close to completing the pilot deployment of telematics units in Mexico in Q217 for Coca-Cola Femsa, after winning the deal in mid-March.
In the product space, the launch of the CelloTrack Nano IoT device has also led to a significant order from a US firm worth $2-3m pa, with deliveries to start in 2018.
Less positively, the group has recently also found itself the subject of a potential $13.8m class action in Israel.
Deployment of monitoring systems in NYC: Numbers boosted by fleet growth
In July PNTR completed the deployment of 5,000 driver monitoring units in its Internet of Vehicles project (conducted together with ADAS pioneer Mobileye). The fast pace of growth in the fleet of its client led it to deploy substantially more than the originally expected 4,200 vehicles.
We covered the details of the contract win in January (Taking a Ride with Uber, 29 January 2017), including management’s expectation of the contract generating ARPU of around half the current group level, but for this to be offset by the access to larger fleets over time, as more ride hail firms join the project, and the high scalability of the project. We see very good likelihood of demand for the service arising from other ride-hailing fleets, particularly if the results of the driver monitoring are shared with passengers. We believe that this will make the monitoring feature a ‘must have’ for ambitious ride hail companies, reflecting the value passengers put on their own safety and their ability to choose safer drivers.
Coca-Cola Femsa pilot contract: Larger than expected trial fleet
Pointer is close to completion of the roll-out of telematics services to the Mexican arm of Coca-Cola Femsa, the world’s largest franchise Coca-Cola bottler. The project looks to be more than twice the size we estimated in our initial coverage of the contract win in March (see our update note published on 16 March 2017), when we assumed that it would apply to 1,500 units or 20% of our estimate of the Femsa Mexico fleet. We estimate that the contract should add c $1.3m pa to revenues. Pointer management believes it may be able to sign on another fleet in the Femsa group as soon as early next year and more of its fleets late next year.
In total, Femsa’s entire fleet numbered c 16,650 trucks in late 2016, implying a potential annual recurring revenue contribution for Pointer of c $2.0m, based on Pointer and another company taking part in the trial.
New recurring CelloTrack Nano product order worth $2-3m pa
In Q217 PNTR concluded a major deal in the US market with a contract for the annual supply of 15,000 CelloTrack Nano units (see pages 8-9 of our initiation report published on 8 November 2016). Management expects this to translate into additional product revenues of $2-3m pa. This order is not expected to generate ongoing service revenues for PNTR. We nevertheless expect that future sales of the sensor products will be boosted by additional SaaS revenues as end-users subscribe to Pointer’s online monitoring platform, providing real-time feedback and alerts on the state and location of their cargoes.
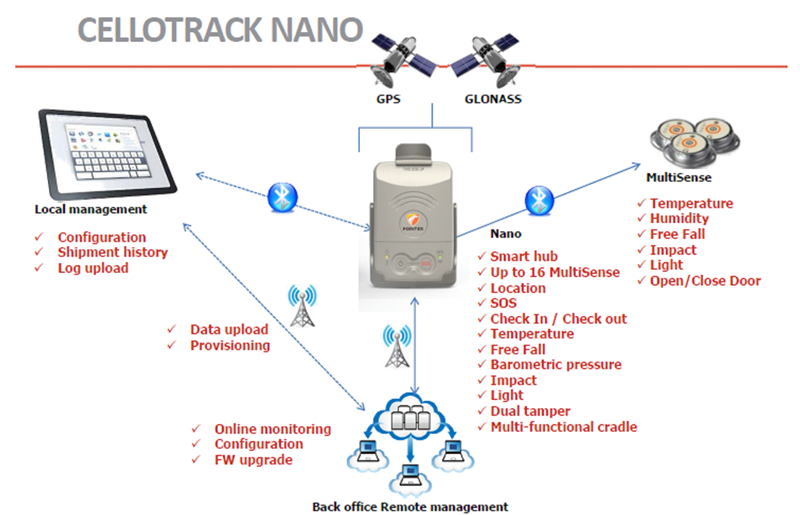
The product neatly exploits the development of the Internet of Things by providing a wide variety of sensor units to communicate the state (temperature, light, sharp movement, altitude, humidity, noise-voice etc) of individual products or boxes/crates in transit. This information is communicated real time via a local controller unit to anywhere with access to the cloud. The product has widespread industry applications including transportation, logistics, insurance, healthcare, food and beverage, oil and gas, construction and mining, energy and utilities, retail, automotive and agriculture.
We expect the CelloTrack Nano to become a significant driver of product and service revenues going forward. With the group undertaking intensive marketing of the product following its launch earlier this year, we expect further contract wins to be announced in the coming quarters.
|
Exhibit 1: CelloTrack Nano |
|
|
Source: Pointer Telocation |
Connected Car launch: First contract in hand
Alongside its first half results, PNTR’s management announced plans to launch its Connected Car offering later this year. A few days later it announced its first supply contract with The Lubinski Group, the sole importer to Israel of Peugeot, Citroen, DS and MG vehicles. Management expects its Connected Car software to be the first to market in Israel and from there it aims to become the leading supplier in its focused geographies, which include Brazil, South Africa and Argentina.
The solution is based on an Android infotainment solution, supplemented with PNTR’s value-added services. These include internet and radio, a library of approved applications such as traffic updates, navigation and other location-based services, accident detection, parking, real-time support, 24-hour access to service and emergency control rooms, car maintenance and reservation, push notifications and access to distributor promotions.
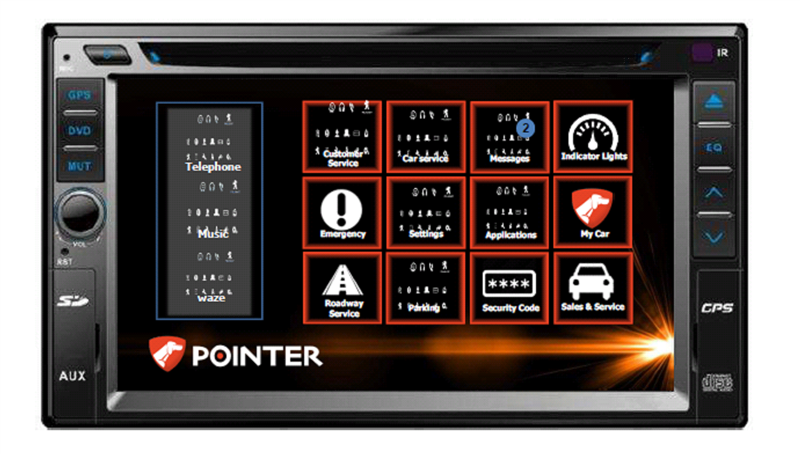
The solution operates from a dashboard screen mounted in the vehicle (see Exhibit 3) and enables the user to access controls related to the following functions:
Exhibit 2: Connected Car control functions
|
■ Navigation |
■ AEB (accident and emergency braking) |
|
■ Location services |
■ Vehicle remote control |
|
■ Phone access |
■ Battery Life |
|
■ Messaging |
■ Traffic updates (eg Waze) |
|
■ Automated parking (APA) |
■ Maintenance |
Source: Pointer Telocation
The product is to be sold principally to vehicle importers and distributors, with the aim of improving the attractiveness of imported vehicles to the end-user and (in the case of importers) to vehicle distributors. The solution is not expected to materially supplant sales of telematics equipment to fleets, as PNTR’s telematics solutions provide this range of features in a more sophisticated form, tailored to the commercial market.
Revenues from the solution are expected in a SaaS-style monthly subscription from which PNTR will pay cellular data traffic charges.
|
Exhibit 3: Pointer Telocation Connected Car dashboard |
|
|
Source: Pointer Telocation |
Contract with The Lubinski Group
The contract with The Lubinski Group is an important first step. The Lubinski Group is the eighth largest vehicle importer in Israel, with 2016 sales of 14,054 vehicles, representing 4.9% market share. With vehicle imports into Israel growing 12.6% to 287k in 2016 (source: CarTube.co.il) and European car sales likely to benefit from a new green taxation policy, which favours fuel-efficient and smaller vehicles, sales by The Lubinski group look well supported.
It is not yet known what proportion of its vehicles Lubinski intends to fit with the solution, but we estimate that implementation of the solution into 20% of its vehicles at a theoretical average revenue per user of $3-5 per month would result in additional annual revenues for PNTR of $0.1-0.2m.
New $13.8m ($1.74 per share) class action in Israel
In early August Pointer revealed that a class action had been filed against it in the Central District Court in Israel. The claimants allege that over the last seven years Pointer had charged customers for a certain class of system, while installing an inferior one. If the claim is certified as a class action, the applicant has estimated that the claim will be NIS1,332 ($368) per client, totalling NIS50m ($13.8m) in aggregate.
At this stage the company has not made any provisions for the claim, and we have not adjusted our valuation. Nevertheless, the relatively large size of the claim, representing $1.74 per share, means that we will monitor the situation going forward and this may change.
Quarterly results review
Earnings: Another set of strong results
Pointer Telocation reported another strong set of results in Q217, with strong growth in subscriber numbers and margins, which fed through to a sharp increase in EBITDA and PBT.
Key underlying factors were organic subscriber additions of 8,000 during Q2, leading to a 24% y-o-y growth in subscriber numbers to 239,000. Stripping out subscribers added on the acquisition of Cielo Telecom in Brazil in Q416, the group achieved a still impressive 16% y-o-y run rate reflecting the success in marketing its MRM services across its core markets.
Following a declining trend in quarterly service revenue ARPUs during 2016, PNTR’s ARPUs trended up for the second quarter running, rising 1.7% y-o-y to $18.3 ($18.2 in Q1). The high ARPU Cielo Telecom acquisition was a contributing factor, but we also note more supportive local currency trends in Q1 and Q2, with the average quarterly Q217 exchange rate for the Brazilian real and the NIS 8% and 6% higher against the dollar on a y-o-y basis.
With the additional benefit of high operating leverage from the SaaS-based telematics services business (whereby new subscribers are added on margins well above average because they incur no additional G&A or marketing costs) the group reported a 56% surge in normalised EBITDA to $3.54m (Q1: $3.22m). Within this, service revenue margins rose to 59.2%, up 2.6bp from Q117 and 3.7bp from Q216.
Selling and marketing costs rose 16% y-o-y to $3.5m during the quarter, boosted by intense activity on the part of the sales and marketing division. A key focus was the launch of the new CelloTrack Nano, but the group also continued to push for further wins in the ride-hailing driver monitoring space in the US as well in the core MRM services area, with a consequent increase in costs. G&A costs also rose strongly, up 38% y-o-y to $2.9m, although we understand that a significant proportion of the increase was as a result of taking on additional overheads arising from acquiring the Cielo Telecom truck telematics business in Brazil in Q416. Importantly, despite the sharp increase, G&A costs as a percentage of sales revenues at 14.4% were flat on Q1 and lower than the 15.1% in Q416.
Cash flow: Working capital outlays affected cash conversion
PNTR generated $1.2m in operating cash flow in Q217, down from $1.5m in Q117 and $3.4m in Q216. The principal reason for the low level of cash conversion (43% in Q2 vs 67% in Q1) was the build-up in working capital during the quarter, in particular a $1.2m increase in trade receivables. This compares with Q116 when the group reduced working capital use through an increase in accounts payable of $1.3m. We see this increased use of working capital as a necessary cost of the group’s impressive pace of expansion. Importantly, we see it as in a very good position to finance working capital expansion, in view of its strong balance sheet.
Balance sheet: Strong balance sheet supports growth
Net debt fell from $8.1m to $7.0m over the course of the second quarter of the year, as the group applied the bulk of the $1.2m in operating cash flow to debt repayment, with capex held down at $0.3m vs $1.3m in Q216. Net debt to equity consequently was reduced from 17% to a very manageable14%.
Exhibit 4: H117 results summary
$m |
Q217 |
Q216 |
Change |
H117 |
H116 |
Change |
Q117 |
Product Revenues |
7.15 |
6.05 |
18.2 |
13.83 |
11.56 |
19.7 |
6.68 |
Change (%) |
18.2 |
5.1 |
N/A |
19.7 |
0.2 |
N/A |
21.3 |
Services Revenues |
12.89 |
10.17 |
26.8 |
25.24 |
19.49 |
29.6 |
12.35 |
Change (%) |
26.8 |
4.4 |
N/A |
29.6 |
0.6 |
N/A |
32.5 |
Revenue |
20.04 |
16.21 |
23.6 |
39.07 |
31.04 |
25.9 |
19.03 |
Change (%) |
23.6 |
4.7 |
N/A |
25.9 |
0.4 |
N/A |
28.4 |
Cost of Products |
(4.48) |
(3.78) |
18.4 |
(8.75) |
(7.18) |
21.9 |
(4.28) |
Gross profit Products |
2.7 |
2.3 |
17.8 |
5.1 |
4.4 |
16.0 |
2.4 |
Gross margin products (%) |
37.4 |
37.5 |
N/A |
36.7 |
37.9 |
N/A |
36.0 |
Cost of Services |
(5.26) |
(4.70) |
11.8 |
(10.62) |
(8.77) |
21.1 |
(5.36) |
Gross profit Services |
7.6 |
5.5 |
39.8 |
14.6 |
10.7 |
36.5 |
7.0 |
Gross margin services (%) |
59.2 |
53.7 |
N/A |
57.9 |
55.0 |
N/A |
56.6 |
Cost of Sales |
(9.74) |
(8.48) |
14.7 |
(19.37) |
(15.95) |
21.5 |
(9.64) |
Gross profit |
10.31 |
7.73 |
33.3 |
19.70 |
15.09 |
30.6 |
9.39 |
Gross margin (%) |
51.4 |
47.7 |
N/A |
50.4 |
48.6 |
N/A |
49.4 |
Research and development |
(1.02) |
(0.92) |
10.7 |
(1.99) |
(1.82) |
8.9 |
(0.97) |
% of sales |
5.1 |
5.7 |
N/A |
5.1 |
5.9 |
N/A |
5.1 |
Selling and marketing |
(3.46) |
(2.97) |
16.4 |
(6.76) |
(5.62) |
20.4 |
(3.31) |
% of sales |
17.2 |
18.3 |
N/A |
17.3 |
18.1 |
N/A |
17.4 |
General and administrative |
(2.89) |
(2.09) |
37.9 |
(5.63) |
(4.23) |
33.3 |
(2.75) |
% of sales |
14.4 |
12.9 |
N/A |
14.4 |
13.6 |
N/A |
14.4 |
EBITDA* |
3.54 |
2.27 |
56.1 |
6.76 |
4.43 |
52.5 |
3.22 |
EBITDA margin |
17.7% |
14.0% |
N/A |
17.3% |
14.3% |
N/A |
16.9% |
Operating profit normalised |
3.05 |
1.79 |
70.9 |
5.53 |
3.52 |
57.4 |
2.48 |
Operating margin normalised |
15.2% |
11.0% |
N/A |
14.2% |
11.3% |
N/A |
13.0% |
One-off items |
0.00 |
0.00 |
N/A |
0.00 |
0.00 |
N/A |
0.00 |
Operating profit |
2.83 |
1.65 |
72.3 |
5.09 |
3.23 |
57.7 |
2.26 |
Operating margin (%) |
14.14 |
10.15 |
N/A |
13.03 |
10.40 |
N/A |
11.85 |
Net finance costs |
(0.26) |
(0.32) |
(19.8) |
(0.42) |
(0.24) |
72.4 |
(0.16) |
Other expenses |
0.00 |
(0.00) |
(100.0) |
0.00 |
0.00 |
(100.0) |
0.00 |
PBT normalised |
2.79 |
1.46 |
91.2 |
5.11 |
3.28 |
56.1 |
2.32 |
PBT |
2.58 |
1.32 |
95.1 |
4.67 |
2.99 |
56.3 |
2.10 |
Reported tax |
(0.61) |
(0.28) |
120.7 |
(1.14) |
(0.85) |
33.3 |
(0.53) |
Profit after tax reported |
1.97 |
0.88 |
124.4 |
3.53 |
2.29 |
54.4 |
1.57 |
Profit after tax from continuing operations |
1.97 |
1.04 |
88.3 |
3.53 |
2.13 |
65.6 |
1.57 |
Profit after tax normalised |
2.24 |
1.09 |
105.4 |
3.98 |
2.45 |
62.5 |
1.74 |
EPS - basic ($)** |
0.24 |
0.11 |
121.3 |
0.44 |
0.29 |
52.1 |
0.20 |
EPS - diluted ($**) |
0.24 |
0.11 |
121.3 |
0.44 |
0.29 |
52.3 |
0.20 |
EPS - basic normalised ($) |
0.28 |
0.14 |
99.2 |
0.50 |
0.32 |
57.1 |
0.22 |
EPS - diluted normalised ($) |
0.28 |
0.14 |
99.6 |
0.49 |
0.31 |
57.4 |
0.22 |
Ratios |
|||||||
MRM subscribers |
239,000 |
192,000 |
24.5 |
239,000 |
192,000 |
24.5 |
231,000 |
Net additions |
8,000 |
7,000 |
14.3 |
17,000 |
0 |
N/A |
9,000 |
Avg. service rev. per MRM subscriber ($/month) |
18.3 |
18.0 |
1.7 |
16.9 |
17.5 |
(3.3) |
18.2 |
Cash flow/balance sheet summary |
|||||||
Operating cash flows |
1.22 |
3.44 |
(64.4) |
2.73 |
4.96 |
(44.9) |
1.51 |
Cash conversion (operating CF to operating profit, %) |
43.2 |
208.9 |
N/A |
53.6 |
150.0 |
N/A |
66.7 |
Cash flows from investment |
(0.31) |
(1.28) |
(76.0) |
(1.06) |
(2.38) |
(55.6) |
(0.75) |
Purchases of property, plant and equipment |
(0.34) |
(1.28) |
(73.2) |
(1.11) |
(2.86) |
(61.1) |
(0.77) |
Cash & cash equivalents |
5.70 |
7.75 |
(26.4) |
5.70 |
7.75 |
(26.4) |
5.75 |
Net debt ($m) |
7.04 |
3.17 |
122.2 |
7.04 |
3.17 |
122.2 |
8.06 |
Net debt (cash)/equity (%) |
14.11 |
7.64 |
N/A |
14.11 |
7.64 |
N/A |
17.20 |
Current ratio |
1.41 |
1.51 |
N/A |
1.41 |
1.51 |
N/A |
1.32 |
Quick ratio |
1.12 |
1.25 |
N/A |
1.12 |
1.25 |
N/A |
1.05 |
Source: Pointer Telocation, Edison Investment Research Note: *Normalised and before share-based payments. **Based on reported earnings, not continuing operations.
Increase in earnings forecast
As summarised in Exhibit 5, we have increased our earnings forecasts. The key assumption changes are as follows:
1.
Increased MRM subscriber expectations at end 2017, reflecting sustained strong organic growth over the first two quarters of this year, with a small boost from the addition of the remainder of the Femsa pilot subscribers in Q3.
2.
Expectations of higher product sales from 2017, reflecting our more positive expectations of the prospects of CelloTrack Nano following the recent US order, as well as the prospects of the Connected Car package, which should start contributing to revenues in 2018.
3.
Increased average revenue per MRM subscriber (ARPU) expectations, helped by the positive impact of the addition of the Brazilian lorry fleet with the Cielo Telecom acquisition in Q416.
4.
Increased gross margin expectations helped by the operating leverage provided by the group SaaS model. We have slowed the pace of margin increase in 2019 to reflect the expectation of lower gross margins from the ride-hailing business (which is a highly scalable, high-volume, lower-margin business model) and our expectation of competition working to ameliorate margin growth over the longer term.
5.
We have sharply increased our expectation of selling and marketing and G&A costs over the forecast period, reflecting the increase in marketing and G&A inputs required to achieve and service the increased revenue forecasts, as well as expenses related to defending the above-mentioned lawsuit.
Exhibit 5: Changes in forecast
$m |
2016 |
H117 |
2017e |
2018e |
2019e |
||||||
|
Old |
New |
% chg. |
Old |
New |
% chg. |
Old |
New |
% chg. |
||
MRM subscribers (000s) |
222 |
239 |
251 |
254 |
1.3 |
286 |
287 |
0.5 |
314 |
316 |
0.5 |
MRM ARPU ($/month) |
17.6 |
18.1 |
16.9 |
18.2 |
7.5 |
16.7 |
17.7 |
6.5 |
16.2 |
17.3 |
7.0 |
Service revenues |
41.6 |
25.2 |
48.0 |
51.9 |
8.2 |
53.7 |
57.6 |
7.4 |
58.2 |
62.6 |
7.5 |
Product revenues |
22.8 |
13.8 |
23.9 |
26.9 |
12.4 |
24.4 |
28.9 |
18.5 |
24.6 |
31.2 |
26.7 |
Revenue |
64.4 |
39.1 |
71.9 |
78.8 |
9.6 |
78.1 |
86.5 |
10.9 |
82.9 |
93.9 |
13.2 |
Revenue growth (%) |
6.3 |
N/A |
11.7 |
22.5 |
N/A |
8.5 |
9.8 |
N/A |
6.2 |
8.5 |
N/A |
Gross profit |
31.8 |
19.7 |
35.9 |
39.9 |
11.2 |
39.5 |
44.4 |
12.3 |
42.5 |
48.4 |
13.9 |
Gross margin (%) |
49.4 |
50.4 |
49.9 |
50.6 |
N/A |
50.6 |
51.3 |
N/A |
51.2 |
51.5 |
N/A |
Research and development |
(3.7) |
(2.0) |
(4.1) |
(4.1) |
0.0 |
(4.2) |
(4.5) |
7.8 |
(4.4) |
(4.9) |
10.2 |
Selling and marketing |
(11.8) |
(6.8) |
(12.8) |
(14.0) |
9.0 |
(13.9) |
(15.3) |
10.2 |
(14.8) |
(16.6) |
12.6 |
General and administrative |
(9.0) |
(5.6) |
(10.1) |
(11.8) |
16.8 |
(10.6) |
(13.4) |
26.8 |
(11.1) |
(15.0) |
35.3 |
Non-cash adjustments/other |
2.4 |
1.4 |
3.2 |
3.3 |
3.1 |
3.6 |
3.8 |
5.1 |
4.1 |
4.3 |
6.6 |
EBITDA* |
9.8 |
6.8 |
12.1 |
13.3 |
10.6 |
14.5 |
15.0 |
3.2 |
16.3 |
16.2 |
(0.3) |
EBITDA growth (%) |
N/A |
N/A |
23.7 |
36.8 |
N/A |
20.3 |
12.2 |
N/A |
12.3 |
8.5 |
N/A |
EBITDA margin (%) |
15.2 |
17.3 |
16.8 |
16.9 |
N/A |
18.6 |
17.3 |
N/A |
19.6 |
17.3 |
N/A |
Operating profit normalised |
7.6 |
5.5 |
9.2 |
10.5 |
14.0 |
11.2 |
11.6 |
3.5 |
12.6 |
12.4 |
(1.6) |
Operating profit reported |
6.2 |
5.1 |
8.7 |
9.6 |
10.4 |
10.7 |
10.8 |
0.8 |
12.1 |
11.6 |
(3.7) |
Operating margin normalised (%) |
11.9 |
14.2 |
12.8 |
13.3 |
N/A |
14.4 |
13.4 |
N/A |
15.2 |
13.2 |
N/A |
Finance costs |
(1.0) |
(0.4) |
(0.8) |
(0.9) |
8.9 |
(0.6) |
(0.5) |
(12.2) |
(0.4) |
(0.2) |
(32.6) |
Profit before tax normalised |
6.6 |
5.1 |
8.4 |
9.6 |
14.5 |
10.6 |
11.1 |
4.3 |
12.2 |
12.1 |
(0.7) |
Profit before tax reported |
5.2 |
4.7 |
7.9 |
8.7 |
10.6 |
10.1 |
10.3 |
1.5 |
11.7 |
11.4 |
(2.8) |
PBT growth (%) |
N/A |
N/A |
52.0 |
68.1 |
N/A |
28.4 |
17.9 |
N/A |
15.5 |
10.6 |
N/A |
EPS - diluted normalised ($) |
0.62 |
0.49 |
0.78 |
0.91 |
15.8 |
0.98 |
1.03 |
5.4 |
1.10 |
1.11 |
0.2 |
EPS - basic reported ($) |
0.44 |
0.44 |
0.74 |
0.82 |
10.7 |
0.94 |
0.96 |
1.9 |
1.08 |
1.05 |
(2.5) |
Source: Pointer Telocation, Edison Investment Research. Note: *Normalised and before share-based payments.
Valuation
We have increased our multiple-based valuation from $13.6/share (NIS48.9) to $15.4 (NIS55.1) per share, reflecting the increases to our EBITDA and EPS forecasts, as well as increases in sector multiples since our last update. We have also changed from using a range-based discount to the sector of 10-20% to using the upper point of the range of 10%. This reflects, on the one hand, our belief that the group’s increasing orientation to the strong growth segments of the telematics sector, including driver behaviour and the Internet of Things, justifies a higher underlying multiple, but also our caution about the possible impact of the potential class action case. We derive the valuation by applying these discounts to the average of the sector P/E ratio and normalised EV/EBITDA multiples for the current and next forecast years and using the average of the valuations given by the two ratios at each discount rate to provide the high and low valuation.
Exhibit 6: Comparative multiple valuation
$m |
Main focus |
Share price (LC) |
Market cap ($m) |
Sales FY1 (m) |
EBITDA margin 1FY (%) |
EV/ |
EV/ |
EV/ |
EV/ |
P/E |
P/E |
Last |
Net debt/ |
Pointer Telocation |
Israel, |
14.5 |
115 |
80 |
17.3 |
1.6 |
1.4 |
9.2 |
8.2 |
16.0 |
14.1 |
0.0 |
21.0 |
CalAmp Corp |
NAM |
18.5 |
654 |
361 |
14.9 |
1.9 |
1.8 |
12.9 |
11.1 |
15.7 |
13.7 |
0.0 |
24.1 |
ID Systems Inc |
NAM |
6.2 |
107 |
43 |
0.8 |
2.3 |
1.7 |
284.5 |
14.3 |
1,234.0 |
16.5 |
0.0 |
(52.9) |
Ituran Location and Control |
Israel, Brazil, Arg |
33.5 |
786 |
230 |
N/A |
3.3 |
3.1 |
N/A |
N/A |
16.5 |
16.0 |
2.5 |
(24.9) |
MiX Telematics |
SA |
124.4 |
230 |
1,637 |
22.8 |
1.7 |
1.5 |
7.1 |
6.2 |
592.3 |
487.7 |
N/A |
(17.8) |
Numerex Corp |
NAM |
3.9 |
77 |
68 |
10.6 |
1.3 |
1.3 |
14.8 |
9.3 |
N/A |
N/A |
0.0 |
20.9 |
ORBCOMM Inc |
US/Europe |
11.3 |
828 |
241 |
20.6 |
4.1 |
3.9 |
20.0 |
15.4 |
(34.0) |
(113.8) |
0.0 |
57.5 |
Sierra Wireless Inc |
NAM |
21.9 |
705 |
682 |
7.8 |
1.0 |
0.9 |
12.3 |
10.5 |
21.9 |
19.1 |
0.0 |
(15.2) |
Trakm8 Holdings |
UK |
0.9 |
40 |
32 |
14.7 |
1.1 |
1.0 |
7.5 |
5.8 |
12.2 |
8.8 |
0.0 |
19.1 |
QUALCOMM Inc |
NAM |
52.1 |
76,829 |
22,861 |
34.6 |
2.7 |
2.6 |
7.7 |
8.0 |
12.6 |
14.3 |
3.9 |
(49.9) |
Quartix Holdings |
UK |
3.6 |
219 |
23 |
29.6 |
7.1 |
6.7 |
24.0 |
20.9 |
30.3 |
26.7 |
1.8 |
(26.1) |
Median |
230 |
230 |
16.1 |
1.9 |
1.7 |
12.6 |
9.9 |
16.2 |
15.1 |
0.0% |
(15.2) |
||
Average/median* - mcap<$300m |
131 |
306 |
16.0 |
1.6 |
1.5 |
12.0 |
8.7 |
30.3 |
16.5 |
0.0% |
0.6 |
||
Average/median* Ituran/MiX Telematics |
508 |
939 |
N/A |
2.5 |
2.3 |
7.1 |
6.2 |
304.4 |
251.9 |
N/A |
(21.3) |
||
PTNR premium/(discount) to peers |
(19.3) |
(16.8) |
(27.3) |
(17.8) |
(1.6) |
(7.0) |
N/A |
N/A |
|||||
PTNR premium/(discount) to peers MCAP<$300m |
(3.2) |
(4.6) |
(23.7) |
(6.7) |
(47.3) |
(14.4) |
N/A |
N/A |
|||||
PTNR premium/(discount) to Ituran/MiX Telematics average |
(37.8) |
(39.2) |
29.4 |
32.0 |
(94.8) |
(94.4) |
N/A |
N/A |
|||||
PTNR premium/(discount) to Ituran |
(53.4) |
(54.4) |
N/A |
N/A |
(3.2) |
(12.1) |
N/A |
N/A |
|||||
Source: Bloomberg, Edison Investment Research. Note: *Applying median to valuation ratios to eliminate the impact of outliers, averages to all else. Priced at 4 September 2017.
Our DCF share value has increased from $14.9/share (NIS53.6) to $16.3 (NIS58.2) per share, reflecting our increased earnings expectations. We have left our WACC and terminal value assumptions unchanged.
Exhibit 7: DCF valuation summary
$m |
2016 |
2017e |
2018e |
2019e |
2020e |
2021e |
2022e |
2023e |
2024e |
2025e |
2026e |
Revenue |
64.4 |
78.8 |
86.5 |
93.9 |
99.1 |
104.4 |
109.3 |
114.2 |
119.4 |
124.8 |
127.9 |
EBITDA |
9.8 |
13.3 |
15.0 |
16.2 |
17.8 |
19.6 |
21.1 |
22.3 |
23.6 |
24.8 |
25.4 |
EBITDA margin (%) |
15.2 |
16.9 |
17.3 |
17.3 |
18.0 |
18.7 |
19.3 |
19.6 |
19.7 |
19.9 |
19.9 |
Change in working capital |
1.1 |
(0.4) |
(0.2) |
(0.2) |
(0.2) |
(0.2) |
(0.2) |
(0.1) |
(0.2) |
(0.2) |
(0.2) |
Working capital/sales (%) |
1.7 |
(0.6) |
(0.2) |
(0.2) |
(0.2) |
(0.2) |
(0.2) |
(0.1) |
(0.1) |
(0.1) |
(0.1) |
Capex, net of PPE sales |
(3.5) |
(4.3) |
(4.8) |
(5.2) |
(5.6) |
(5.9) |
(6.3) |
(6.6) |
(7.0) |
(7.4) |
(7.8) |
Capex/sales (%) |
(5.4) |
(5.5) |
(5.5) |
(5.5) |
(5.6) |
(5.7) |
(5.8) |
(5.8) |
(5.9) |
(5.9) |
(5.9) |
Tax |
(0.1) |
(1.3) |
(1.3) |
(2.8) |
(3.1) |
(3.5) |
(3.8) |
(4.0) |
(4.2) |
(4.4) |
(4.4) |
Acquisitions |
(8.6) |
0.0 |
0.0 |
0.0 |
0.0 |
0.0 |
0.0 |
0.0 |
0.0 |
0.0 |
0.0 |
Free cash flow |
(1.4) |
7.3 |
8.7 |
8.0 |
8.9 |
9.9 |
10.9 |
11.6 |
12.2 |
12.8 |
13.1 |
Terminal value |
|
|
|
|
|
|
|
|
|
|
173.7 |
Total cash flow |
(1.4) |
7.3 |
8.7 |
8.0 |
8.9 |
9.9 |
10.9 |
11.6 |
12.2 |
12.8 |
186.8 |
Discounted cash flows |
0.0 |
7.3 |
7.9 |
6.6 |
6.6 |
6.7 |
6.7 |
6.5 |
6.2 |
5.9 |
77.9 |
Sum of discounted CFs |
138.3 |
|
RFR |
|
|
6.6% |
|
|
|
|
|
Net debt (cash) |
9.0 |
|
WACC |
|
|
10.2% |
|
|
|
|
|
Equity valuation |
129.3 |
|
Terminal growth rate |
|
2.5% |
|
|
|
|
|
|
Number of shares (m), diluted |
7.9 |
|
Terminal value/EV |
|
52% |
|
|
|
|
|
|
Value per share (NIS) |
58.2 |
|
Value per share ($) |
|
16.3 |
|
|
|
|
|
|
Source: Edison Investment Research
Exhibit 8: Financial summary
$m |
2015 |
2016 |
2017e |
2018e |
2019e |
||
31 December |
US GAAP |
US GAAP |
US GAAP |
US GAAP |
US GAAP |
||
INCOME STATEMENT |
|||||||
Revenue |
|
|
60.57 |
64.35 |
78.83 |
86.54 |
93.88 |
Cost of Sales |
(31.31) |
(32.58) |
(38.91) |
(42.14) |
(45.51) |
||
Gross Profit |
29.25 |
31.78 |
39.91 |
44.40 |
48.37 |
||
EBITDA |
|
|
8.80 |
9.75 |
13.35 |
14.98 |
16.24 |
Normalised operating profit |
|
|
7.10 |
7.64 |
10.51 |
11.60 |
12.36 |
Amortisation of acquired intangibles |
(0.54) |
(0.47) |
(0.46) |
(0.36) |
(0.29) |
||
Exceptionals |
(0.91) |
(0.60) |
0.00 |
0.00 |
0.00 |
||
Share-based payments (incl. in COGS) |
(0.31) |
(0.32) |
(0.43) |
(0.43) |
(0.44) |
||
Reported operating profit |
5.34 |
6.25 |
9.63 |
10.80 |
11.63 |
||
Net Interest |
(0.73) |
(1.05) |
(0.90) |
(0.51) |
(0.25) |
||
Joint ventures & associates (post tax)/other |
(0.01) |
(0.01) |
0.00 |
0.00 |
0.00 |
||
Exceptionals |
0.00 |
0.00 |
0.00 |
0.00 |
0.00 |
||
Profit before tax (norm) |
|
|
6.36 |
6.58 |
9.61 |
11.09 |
12.11 |
Profit before tax (reported) |
|
|
4.60 |
5.19 |
8.73 |
10.29 |
11.38 |
Reported tax |
(1.13) |
(1.85) |
(2.18) |
(2.57) |
(2.85) |
||
Profit after tax (norm) |
5.23 |
4.93 |
7.43 |
8.52 |
9.26 |
||
Profit after tax (reported) |
3.47 |
3.35 |
6.55 |
7.72 |
8.54 |
||
Minority interests |
0.08 |
(0.02) |
(0.03) |
(0.04) |
(0.05) |
||
Discontinued operations |
0.33 |
0.15 |
0.00 |
0.00 |
0.00 |
||
Net income (normalised) |
5.30 |
4.91 |
7.40 |
8.47 |
9.22 |
||
Net income (reported) |
3.87 |
3.48 |
6.51 |
7.68 |
8.49 |
||
Basic average number of shares outstanding (m) |
7.73 |
7.82 |
7.91 |
7.99 |
8.09 |
||
EPS – basic normalised ($) |
|
|
0.69 |
0.63 |
0.94 |
1.06 |
1.14 |
EPS – diluted normalised ($) |
|
|
0.67 |
0.62 |
0.91 |
1.03 |
1.11 |
EPS – basic reported ($) |
|
|
0.50 |
0.44 |
0.82 |
0.96 |
1.05 |
Dividend ($) |
0.00 |
0.00 |
0.00 |
0.00 |
0.00 |
||
Revenue growth (%) |
N/A |
6.25 |
22.49 |
9.78 |
8.48 |
||
Gross margin (%) |
48.30 |
49.38 |
50.63 |
51.30 |
51.52 |
||
EBITDA margin (%) |
14.52 |
15.16 |
16.93 |
17.31 |
17.30 |
||
Normalised operating margin (%) |
11.71 |
11.87 |
13.34 |
13.40 |
13.16 |
||
BALANCE SHEET |
|||||||
Fixed assets |
|
|
68.78 |
51.61 |
52.64 |
53.67 |
54.69 |
Intangible assets |
31.83 |
40.29 |
39.83 |
39.47 |
39.18 |
||
Tangible assets |
3.28 |
5.61 |
7.10 |
8.50 |
9.81 |
||
Investments & other |
33.67 |
5.71 |
5.71 |
5.71 |
5.71 |
||
Current assets |
|
|
34.66 |
25.28 |
28.44 |
34.88 |
44.61 |
Stocks |
4.70 |
5.24 |
6.26 |
6.78 |
7.32 |
||
Debtors |
9.49 |
11.46 |
14.04 |
15.42 |
16.72 |
||
Cash & cash equivalents |
7.25 |
6.07 |
5.56 |
10.03 |
17.82 |
||
Other |
13.21 |
2.50 |
2.58 |
2.66 |
2.74 |
||
Current liabilities |
|
|
(30.45) |
(19.83) |
(22.09) |
(23.09) |
(24.81) |
Creditors |
(9.82) |
(13.96) |
(16.95) |
(18.60) |
(20.21) |
||
Tax and social security |
0.00 |
0.00 |
0.00 |
0.00 |
0.00 |
||
Short-term borrowings |
(4.82) |
(4.84) |
(3.87) |
(3.10) |
(3.10) |
||
Other |
(15.81) |
(1.04) |
(1.27) |
(1.39) |
(1.51) |
||
Long-term liabilities |
|
|
(17.95) |
(14.36) |
(8.09) |
(4.80) |
(4.55) |
Long-term borrowings |
(8.39) |
(10.18) |
(4.23) |
(1.23) |
(1.23) |
||
Other long-term liabilities |
(9.57) |
(4.18) |
(3.86) |
(3.57) |
(3.31) |
||
Net assets |
|
|
55.04 |
42.69 |
50.89 |
60.66 |
69.94 |
Minority interests |
1.07 |
(0.16) |
(0.20) |
(0.24) |
(0.28) |
||
Shareholders' equity |
|
|
56.10 |
42.53 |
50.69 |
60.42 |
69.66 |
CASH FLOW |
|||||||
Operating cash flow before WC and tax |
8.80 |
9.75 |
13.35 |
14.98 |
16.24 |
||
Working capital |
0.77 |
1.08 |
(0.44) |
(0.20) |
(0.21) |
||
Exceptional & other |
1.99 |
(1.62) |
0.00 |
0.00 |
0.00 |
||
Tax |
(0.05) |
(0.12) |
(1.31) |
(1.29) |
(2.85) |
||
Net operating cash flow |
|
|
11.51 |
9.09 |
11.60 |
13.49 |
13.19 |
Capex |
(3.62) |
(4.13) |
(4.70) |
(5.19) |
(5.64) |
||
Acquisitions/disposals |
0.00 |
(8.65) |
0.00 |
0.00 |
0.00 |
||
Net interest |
(0.89) |
0.00 |
(0.90) |
(0.51) |
(0.25) |
||
Equity financing |
0.02 |
0.10 |
0.00 |
0.00 |
0.00 |
||
Dividends |
0.00 |
0.00 |
0.00 |
0.00 |
0.00 |
||
Other, incl.PPE sales |
1.26 |
1.05 |
0.41 |
0.46 |
0.50 |
||
Net cash flow |
8.28 |
(2.54) |
6.41 |
8.24 |
7.79 |
||
Opening net debt/(cash) |
|
|
11.90 |
5.95 |
8.95 |
2.54 |
(5.70) |
FX |
(0.71) |
(0.46) |
0.00 |
0.00 |
0.00 |
||
Other non-cash movements |
(1.61) |
0.00 |
0.00 |
0.00 |
0.00 |
||
Closing net debt/(cash) |
|
|
5.95 |
8.95 |
2.54 |
(5.70) |
(13.50) |
Source: Company accounts, Edison Investment Research
|
|
McBride has completed its Repair phase of the turnaround programme and has commenced the Prepare phase. The business is performing in line with what management had set out at the start of the programme, and overall progress demonstrates that McBride is indeed now more focused on the bottom line, as key financial ratios are improving. The acquisition of Danlind for £39m, announced earlier this week, demonstrates that execution of the Prepare phase is already well underway.