Last close As at 05/08/2026
—
— 0.00 (0.00%)
Market capitalisation
—
Research: Financials
OTC Market’s (OTCM) third-quarter results were consistent with our expectations and showed healthy revenue progress in each segment. This is a year of investment for the group in people, IT, a new headquarters and acquired businesses. Earnings are set to fall as a result, but we expect growth to resume in FY20 with longer-term benefits also likely to flow from the enhanced capabilities and infrastructure.
Written by
OTC Markets Group |
Revenue progress across group |
Q319 results |
Financial services |
19 November 2019 |
Share price performance
Business description
Next events
Analysts
OTC Markets Group is a research client of Edison Investment Research Limited |
|||||||||||||||||||||||||||||||||||||||||||||||
OTC Market’s (OTCM) third-quarter results were consistent with our expectations and showed healthy revenue progress in each segment. This is a year of investment for the group in people, IT, a new headquarters and acquired businesses. Earnings are set to fall as a result, but we expect growth to resume in FY20 with longer-term benefits also likely to flow from the enhanced capabilities and infrastructure.
Year end |
Revenue ($m) |
PBT |
EPS* |
DPS** |
P/E |
Yield |
12/17 |
54.7 |
18.4 |
1.06 |
1.16 |
32.1 |
3.4 |
12/18 |
59.3 |
19.8 |
1.36 |
1.23 |
24.9 |
3.6 |
12/19e |
62.8 |
18.1 |
1.26 |
1.25 |
27.0 |
3.7 |
12/20e |
66.6 |
21.0 |
1.42 |
1.33 |
23.9 |
3.9 |
Note: *Fully diluted and calculated after restricted stock award allocation. **Including special dividends declared and estimated of 60c, 65c, 65c and 73c for FY17–20e, respectively.
Q319 results and new strategic alliance
OTCM’s Q319 results showed revenues ahead 7% y-o-y with growth in all three segments (OTC Link, Market Data Licensing and Corporate Services). Investment in personnel and IT, higher rental costs following the move to a new HQ and costs associated with acquired businesses all contributed to a 17% increase in operating expenses. This meant profit before tax was 11% lower and net profit down 8% after a lower tax rate. With the results, OTCM announced it had entered into a strategic alliance with North Capital Investment Technology to provide companies with access to a cost-effective technology platform to enable them to manage online securities offerings, an area expected to develop substantially in the long-term.
Market background and outlook
US equity markets have shown strong gains year to date, but the macro background still has considerable uncertainties and venture markets have been much weaker, potentially acting as a near-term dampener for corporate activity in this area. Looking ahead, OTCM continues to focus on developing its transparent markets and offering additional or enhanced products/services to its corporate clients, data users and broker-dealer subscribers. A study by PwC has indicated that exchange-listed companies’ annual costs related to their listing run at between $1–2m, whereas companies on OTCQX and OTCQB typically spend between $50,000 and $300,000. Given this differential, the potential to broaden OTCM’s international client base and to address the opportunity provided by development of online fund-raising appears substantial.
Valuation: Estimate and valuation stable
Our earnings expectations for FY19 and FY20 are essentially unchanged. OTCM shares trade on prospective P/Es slightly lower than the global exchanges, and more markedly below those for information providers. Our fair value is unchanged at $37 per share.
Investment summary
Earning subscription revenues, operating efficient markets
OTCM’s mission is to create better informed and more efficient financial markets. Sharing information on open networks creates transparency for investors, while investment in technology ensures that broker-dealers are reliably connected, providing quotes on over 10,000 companies. For international and domestic corporate clients, OTCM’s markets are tiered based on the adequacy and timeliness of disclosure, financial criteria and adherence to governance standards (OTCQX, OTCQB and Pink). They provide access to public trading in the US at a cost-effective price, compared with a listing on a registered national securities exchange such as Nasdaq. Approximately 87% of OTCM revenues are subscription-based rather than transactional and include annual fees paid by corporate clients on the premium OTCQX and OTCQB markets, broker-dealer subscription fees and data fees for access to pricing, compliance and other information. Between 2008 and 2018, revenues grew at a compound rate of 11%. Market data are primarily channelled through distributors such as Bloomberg.
Valuation: P/E multiples below global exchanges
OTCM trades on prospective P/E ratios modestly below the global exchanges, but at a larger discount to major information providers that share OTCM’s subscription-based revenue emphasis. Our DCF-based fair value of $37 per share factors in a discount rate of 10%, long-term growth of 4% and a terminal cash flow multiple of 21x.
Financials: Estimates stable, financial position strong
Our estimates are effectively unchanged following the Q319 results. The current year is one of investment in IT and personnel to support the sustainability and growth of the business, so we are estimating full year earnings to be down by 8% before growth resumes in 2020 (+13% on our forecast). The balance sheet remains strong with no debt and cash of $25.8m at end September.
Sensitivities: Market, regulatory and operational
■
From a macro perspective, the economic background will have a positive or negative influence on equity market trends, including investor sentiment towards international and venture equities, the flow of venture company IPOs, corporate interest in accessing liquidity in the US market, and volatility and trading volumes.
■
Regulation can have a positive or negative influence. For example, regulations facilitating online capital raising are expected to increase the pool of potential clients for OTCM, while Regulation Systems, Compliance and Integrity (SCI) requires ongoing technology investment to ensure compliance.
■
Reliability of the group’s IT systems is also important from a reputational perspective and OTC Link Alternative Trading System (ATS) has established a strong record of uptime in its core systems.
■
Competition for corporate clients comes from national securities exchanges and could increase if they were allowed to become specialised venture exchanges. For trading, competition includes Global OTC (ICE subsidiary) and direct trading between dealers.
Transparent and cost-effective OTC markets
The purchase of the National Quotation Bureau (NQB) by CEO R Cromwell Coulson and a group of investors in 1997 began the process that led to the creation of OTCM in its current form. NQB, with a history dating back to 1913, published the Pink Sheets, a printed list of broker-dealer quotes for securities traded off-exchange. Following the purchase, the new management team progressively applied technology to the task of aggregating liquidity and increasing transparency in this over-the-counter market.
A platform providing real-time quotes was launched in 2003 and evolved into the current SEC-registered Alternative Trading System, OTC Link ATS. Another platform, OTC Link ECN, was launched in 2017, providing dealers with complementary features including an anonymous order-matching engine with an order routing capability – as opposed to OTC Link ATS, where attributable quotes are displayed and messages delivered, enabling direct trades between dealers and competitor, Global OTC, which operates a lit order book. OTC Link ATS carries quotes in more than 10,000 companies and has 90 active broker-dealer participants, while OTC Link ECN has a growing subscriber base that stood at 47 at end September.
In order to help investors assess risk exposure, OTCM organises the companies on its markets into tiers, with membership of each subject to the adequacy and timeliness of disclosure, financial criteria and adherence to governance standards.
■
OTCQX Best Market companies meet high financial standards, have recognised corporate governance standards and provide timely public disclosure. At end-Q319, there were 436 OTCQX client companies.
■
OTCQB Venture Market is intended to provide a public trading facility for developing companies that meet standards promoting price transparency and facilitate public disclosure. OTCQB companies must remain current in their disclosure and provide additional information for investors. At end-Q319, there were 915 client companies.
■
The Pink Open Market comprises those companies quoted on the OTC Link ATS that do not meet the standards of, or choose not to apply for, the premium markets. To help give some differentiation within this market, companies are further categorised into Pink Current Information, Pink Limited Information and Pink No Information.
Approximately 87% of OTCM revenues are contract-based and of a recurring nature, reflecting the subscription model that applies in the majority of its activities. Examples of this are shown in Exhibit 1 below, including subscriptions paid by broker-dealers using OTC Link ATS, market and compliance data subscriptions and annual fees charged to corporate clients on OTCQX/OTCQB.
Exhibit 1: Revenue generation, examples by segment
Segment |
Comments |
OTC Link |
|
OTC Link ATS |
Broker-dealers pay subscriptions and usage fees related to the number of quotes and messaging volume. |
OTC Link ECN |
Fees are transaction-based with rebates for liquidity provision (maker-taker structure). |
Market Data Licensing |
Users subscribe to licences for market data, compliance data, company data, and security information collected by OTC Link and Corporate Services. Users include investors, traders, institutions, accountants and regulators. Most market data are sold through distributors such as Bloomberg, to which rebates (c 10%) are paid. |
Corporate Services |
|
OTCQX, OTCQB |
Corporates pay application and annual or semi-annual subscription fees. |
Other |
The OTC Disclosure & News Service and Virtual Investor Conferences revenues are usage dependent. |
Segment |
OTC Link |
OTC Link ATS |
OTC Link ECN |
Market Data Licensing |
Corporate Services |
OTCQX, OTCQB |
Other |
Comments |
Broker-dealers pay subscriptions and usage fees related to the number of quotes and messaging volume. |
Fees are transaction-based with rebates for liquidity provision (maker-taker structure). |
Users subscribe to licences for market data, compliance data, company data, and security information collected by OTC Link and Corporate Services. Users include investors, traders, institutions, accountants and regulators. Most market data are sold through distributors such as Bloomberg, to which rebates (c 10%) are paid. |
Corporates pay application and annual or semi-annual subscription fees. |
The OTC Disclosure & News Service and Virtual Investor Conferences revenues are usage dependent. |
Source: OTCM, Edison Investment Research
Exhibit 2 shows the evolution of OTCM’s revenue since 2008. Between 2008 and 2018, overall revenue increased at a compound rate of 11%. Within this, the most rapid growth has been in Corporate Services (CAGR 25%), primarily reflecting development of the OTCQX and OTCQB premium markets both in terms of the number of companies subscribing and the level of fees commanded. This segment accounted for 42% of revenues in 9M19, followed by Market Data Licensing, 39%, and OTC Link, 19%.
The chart also shows the development of the operating margin. This has dipped below 30% in the current year but is still approaching double the level seen in 2008, reflecting the benefits of the growth in scale that has taken place. The flattening out in margin, at around 35%, from 2015 to 2018 can be attributed to investment in staff and IT to underpin the sustainability and further growth of the business. The reduction in the year to date margin reflects further investment in people and systems, together with the move to a new HQ and the assumption of costs associated with acquisitions. The reliability of the firm’s infrastructure is very important from a reputational and regulatory perspective, and the fact that 2019 marks the fifth year of 100% uptime for OTC Link ATS’s core systems demonstrates the value of work that has been done on this front.
|
Exhibit 2: Gross revenue and operating margin since 2008 |
|
|
Source: OTCM. Note: *9M19 annualised. |
Strategy: Consistent focus on better informed and more efficient markets
OTCM management takes a long-term view of the development of the business and has a consistent mission statement, which is to create better informed and more efficient markets. Flowing from this is a threefold strategy set out as follows:
■
Share information widely through open networks that foster transparency.
■
Connect broker-dealers, organise markets and inform investors.
■
Deliver elegant, reliable and cost-effective, subscription-based technology solutions.
This focus has contributed to the long-term growth in the group set out above and the goals appear to mesh well with the requirements of corporates, investors, broker-dealers and regulators involved in the OTC market.
In line with this strategy, OTCM set itself five main objectives at the beginning of 2019: (1) gain market share for OTC Link ECN; (2) ensure reliability of core systems; (3) win further regulatory recognition of the two premium markets; (4) enhance the corporate client experience; and (5) expand the product offering through acquisitions. Progress has been made on each of these targets.
On acquisitions, OTCM has been clear that it is not seeking a high-risk transformative transaction but rather to add businesses that fit with the existing activities, are relatively asset light and are earnings accretive reasonably quickly. The purchase of Virtual Investor Conferences (related assets acquired last year) and Qaravan (February this year) are examples of the type of addition the group seeks. Virtual Investor Conferences provides a time-efficient way for corporates to engage with investors or potential investors, while Qaravan provides risk and performance analytics designed to fit the needs of the roughly 5,000 small and mid-tier public and private banks in the US. Neither is expected to have a material impact on revenues in the short term, but both already assist by broadening the product offering to existing clients and establishing relationships with new clients.
OTCM continues to work towards further regulatory recognition for its two premium markets, including progressively extending the list of states that grant exemptions under state Blue Sky laws governing secondary trading. The list currently includes 36 states for OTCQX and 33 for OTCQB (see Exhibit 3). As a result, population coverage is 55% and over 53%, respectively. In 2018, the North American Securities Administrators Association (NASAA) published a model rule proposal for states to employ that would have the effect of granting OTCQX/OTCQB Blue Sky recognition. There is no timetable for its formal adoption, but OTCM has noted this would be likely to facilitate a number of additional states moving towards recognition of its markets. Blue Sky recognition is not directly linked to revenue generation but progress towards 100% coverage should be increasingly positive reputationally, helping to attract a broader range of corporate clients to OTCM’s premium markets.
OTCM is also seeking recognition for OTC securities on its OTCQX and OTCQB markets for the purposes of federal regulations dealing with margin eligibility and employee stock ownership plans.
Exhibit 3: States that have granted Blue Sky recognition for OTCQX and OTCQB
Alaska |
Louisiana |
Oregon |
Arkansas |
Maine |
Pennsylvania |
Colorado |
Michigan |
Rhode Island |
Connecticut |
Minnesota |
South Dakota |
Delaware |
Mississippi |
Tennessee |
Georgia |
Missouri |
Texas |
Hawaii |
Nebraska |
Utah |
Idaho (OTCQX only) |
New Jersey |
Vermont (OTCQX only) |
Indiana |
New Mexico |
Washington |
Iowa |
North Dakota |
West Virginia |
Kansas (OTCQX only) |
Ohio |
Wisconsin |
Kentucky |
Oklahoma |
Wyoming |
Source: OTCM
Q319 results meet expectations
OTCM’s third quarter results continued the trends seen in the second quarter and were in line with our expectations. A summary of the profit and loss figures is given in Exhibit 4 and we pick out a number of key points below (comparisons are year-on-year unless stated).
■
Revenues were ahead in all three segments, with the total up 7%. Sequential changes were limited.
■
As in the previous quarter, investment in IT and personnel, the costs associated with the move to a new head office and costs in acquired businesses have pushed up operating expenses, which increased by 17%.
■
This meant profit before tax was 11% lower at $4.75m, but with modestly lower costs q-o-q pre-tax profit was 7% higher sequentially.
■
The effective tax rate was lower than we estimated at 15% versus 18% Q318, moderating the reduction in net profits to 8%, while q-o-q the increase was 13%.
■
OTCM declared a maintained quarterly dividend of $0.15 and a special dividend of $0.65 (matching the prior year). For 9M19, cash returns to shareholders including dividends paid and treasury share purchases were $6.6m compared with $6.0m for 9M18, while for FY19 we estimate a figure of nearly $16.0m compared with $15.2m (+5%).
Exhibit 4: Q319 results summary
$000s unless stated |
Q318 |
Q418 |
Q119 |
Q219 |
Q319 |
y-o-y % change |
q-o-q % change |
OTC Link |
2,807 |
2,918 |
2,843 |
2,898 |
2,989 |
6.5 |
3.1 |
Market Data Licensing |
5,763 |
5,949 |
6,071 |
6,077 |
6,085 |
5.6 |
0.1 |
Corporate Services |
6,195 |
6,538 |
6,442 |
6,695 |
6,682 |
7.9 |
(0.2) |
Gross revenues |
14,765 |
15,405 |
15,356 |
15,670 |
15,756 |
6.7 |
0.5 |
Re-distribution fees and rebates |
(584) |
(609) |
(626) |
(637) |
(602) |
3.1 |
(5.5) |
Net revenue |
14,181 |
14,796 |
14,730 |
15,033 |
15,154 |
6.9 |
0.8 |
Transaction-based expenses |
(144) |
(147) |
(140) |
(172) |
(219) |
52.1 |
27.3 |
Revenues less transaction-based expenses |
14,037 |
14,649 |
14,590 |
14,861 |
14,935 |
6.4 |
0.5 |
Operating expenses |
(8,745) |
(9,842) |
(10,568) |
(10,434) |
(10,211) |
16.8 |
(2.1) |
Income from operations |
5,292 |
4,807 |
4,022 |
4,427 |
4,724 |
(10.7) |
6.7 |
Other income/net interest |
51 |
37 |
37 |
23 |
26 |
(49.0) |
13.0 |
Income before provision for income taxes |
5,343 |
4,844 |
4,059 |
4,450 |
4,750 |
(11.1) |
6.7 |
Taxes |
(958) |
(726) |
(512) |
(883) |
(730) |
(23.8) |
(17.3) |
Net income |
4,385 |
4,118 |
3,547 |
3,567 |
4,020 |
(8.3) |
12.7 |
Diluted EPS ($) |
0.37 |
0.34 |
0.30 |
0.30 |
0.34 |
(8.7) |
12.6 |
Operating margin |
37% |
32% |
27% |
29% |
31% |
||
Tax rate |
18% |
15% |
13% |
20% |
15% |
Source: OTCM, Edison Investment Research
Our next table summarises OTCM’s commentary on contributors to revenue progression within each segment. At OTC Link, the main driver was the continued growth in subscribers and activity on the OTC Link ECN platform, which accounted for 14% of the segment’s revenue in Q319, although this falls to 7% if we deduct the rebates paid to subscribers providing liquidity (transaction-based expenses in Exhibit 4). For Market Data Licensing, increased take-up of compliance and data analytics products was the largest contributor to growth and at 1 November there were 41 custodian, bank and broker-dealer compliance file users compared with 33 at 1 August this year. The healthy growth in Corporate Services revenue mainly arose from an increase in the number of companies on OTCQX and the impact of an earlier price increase at OTCQB. Virtual Investor Conferences made a modest contribution in its first nine months as part of the group, but has been active in this period hosting 14 virtual conferences which reached nearly 12,000 investors.
Exhibit 5: Sub-divisional analysis of gross revenue changes
$000s unless stated |
Q319 revenue |
Absolute |
Change % |
9M19 revenue |
Absolute change |
Change % |
Comments |
||
OTC Link |
|||||||||
OTC Link ECN |
424 |
140 |
49% |
1,073 |
534 |
99% |
New subscribers & increased trading volume |
||
OTC Link ATS quotes |
42 |
112 |
Securities traded & no. Q319 trading days up |
||||||
OTC Link ATS trade messages |
22 |
(83) |
|||||||
Other |
(22) |
(89) |
Decrease in number of active broker-dealers |
||||||
Total |
2,989 |
182 |
6% |
8,730 |
474 |
6% |
|||
Market Data Licensing |
|||||||||
Professional users |
36 |
332 |
Growth in registered users through distributors |
||||||
Internal delayed & other data services |
141 |
412 |
Increased compliance and data analytics product sales |
||||||
Broker-dealer licences |
80 |
130 |
Two subscribers added in Q2 |
||||||
Other |
65 |
(76) |
|||||||
Total |
6,085 |
322 |
6% |
18,233 |
798 |
5% |
|||
Corporate Services |
|||||||||
OTCQB |
2,860 |
110 |
4% |
9,531 |
706 |
8% |
Mainly result of price increase for renewals on anniversary dates starting from 1/1/18 |
||
OTCQX |
2,342 |
323 |
16% |
6,609 |
862 |
15% |
Net increase in no. of companies on market |
||
Virtual Investor Conferences |
61 |
61 |
N/A |
224 |
224 |
N/A |
Acquisition of platform January 2019 |
||
Other |
1,419 |
(7) |
0% |
3,455 |
(154) |
-4% |
|||
Total |
6,682 |
487 |
8% |
19,819 |
1,638 |
9% |
|||
Group total |
15,756 |
991 |
7% |
46,782 |
2,910 |
7% |
Source: OTCM, Edison Investment Research. Note: Some sub-divisional revenue numbers are inferred from the absolute and percentage changes reported and are therefore only indicative because of rounding effects.
Exhibit 6 gives a more detailed analysis of expenses underlining the significant year-on-year increase in compensation and IT-related costs. As noted earlier, these arise from investment to support the sustainability and growth of the business together with costs added following acquisitions (Virtual Investor Conferences and Qaravan). The number of staff increased from 89 at end September last year to 101 this year (+13%), while annual base salary increases were c 6%, reflecting a competitive market, particularly for suitably experienced IT staff. The near 20% increase in IT costs included some non-recurring costs for renewal of equipment in OTCM’s primary and secondary data centres, which amounted to $0.102m in Q3 and $0.172m for 9M19.
As in the previous four quarters, occupancy costs were ahead of the Q318 level, reflecting costs associated with the new headquarters where both square footage and pro rata rent have increased compared with the old office. The additional space, improved IT infrastructure, and enhanced meeting and media production facilities are already proving beneficial and should facilitate development of the group over time.
The 9M19 occupancy costs include one-off costs related to the move of $0.26m and, taking this and other one-off items, the group indicates that there was a total of approximately $0.7m in one-off costs that should not be repeated in 2020.
Exhibit 6: Analysis of operating expenses
$000s unless stated |
Q318 |
Q418 |
Q119 |
Q219 |
Q319 |
y-o-y % |
q-o-q % |
Compensation and benefits |
5,672 |
6,075 |
6,996 |
6,754 |
6,533 |
15.2 |
(3.3) |
IT Infrastructure and information services |
1,377 |
1,477 |
1,527 |
1,614 |
1,650 |
19.8 |
2.2 |
Professional and consulting fees |
590 |
519 |
400 |
546 |
489 |
(17.1) |
(10.4) |
Marketing and advertising |
164 |
402 |
251 |
242 |
256 |
56.1 |
5.8 |
Occupancy costs |
436 |
750 |
846 |
605 |
569 |
30.5 |
(6.0) |
Excluding $0.26m overlapping rent cost |
586 |
||||||
Depreciation and amortization |
259 |
260 |
279 |
380 |
384 |
48.3 |
1.1 |
General, administration and other |
247 |
359 |
269 |
293 |
330 |
33.6 |
12.6 |
Total |
8,745 |
9,842 |
10,568 |
10,434 |
10,211 |
16.8 |
(2.1) |
Excluding $0.467m one-off HQ move costs |
10,101 |
Source: OTCM, Edison Investment Research
We show selected quarterly operating metrics in Exhibit 7.
Within the OTC Link metrics, we note that the number of active OTC Link ATS participants was stable qo-q at 90 but this compared with 92 for Q318, with the reduction part of a longer-term erosion in the number of broker-dealers on the platform as a result of consolidation and withdrawals under the pressure of tighter margins. Positively, the number of subscribers to the ECN platform has continued to increase, reaching 47 at the end of the quarter.
The main points for Corporate Services are the increase in the number of OTCQX corporate clients and a small reduction for OTCQB. The OTCQX gain reflects a good level of sales and a three percentage point increase in the renewal rate for calendar 2019 to 94%. OTCQB sales were lower in Q319 at 53 versus 76, perhaps reflecting a weaker market trend in venture markets (see next section), while the non-renewal rate and other cancellations were stable.
The Market Data Licensing figures show a modest increase in the number of professional users (they account for roughly half segmental revenue) and a slightly larger percentage decline in the number of non-professional users (a much smaller portion of revenue). As noted above, the increase in compliance data file users and the addition of two broker-dealer licences were more influential in the revenue growth recorded in the third quarter (see Exhibit 5).
Exhibit 7: Operating and related revenue data
Q318 |
Q418 |
Q119 |
Q219 |
Q319 |
% change y-o-y |
% change q-o-q |
|
OTC Link |
|||||||
Number of securities quoted |
10,121 |
10,042 |
10,091 |
10,645 |
10,609 |
4.8 |
(0.3) |
Number of active ATS participants |
92 |
91 |
92 |
90 |
90 |
(2.2) |
0.0 |
Number of ECN subscribers |
36 |
41 |
42 |
45 |
47 |
30.6 |
4.4 |
New form 211 filings |
113 |
393 |
97 |
86 |
77 |
(31.9) |
(10.5) |
Revenue per security quoted ($) |
277 |
291 |
282 |
272 |
282 |
1.6 |
3.5 |
Revenue per average active participant ($) |
29,240 |
31,043 |
30,245 |
30,995 |
33,211 |
13.6 |
7.2 |
Corporate Services |
|||||||
Number of corporate clients |
|||||||
OTCQX |
395 |
409 |
414 |
421 |
436 |
10.4 |
3.6 |
OTCQB |
953 |
934 |
941 |
916 |
915 |
(4.0) |
(0.1) |
Pink |
736 |
741 |
740 |
747 |
749 |
1.8 |
0.3 |
Total |
2,084 |
2,084 |
2,095 |
2,084 |
2,100 |
0.8 |
0.8 |
Revenue per client ($) |
2,973 |
3,137 |
3,075 |
3,213 |
3,182 |
7.0 |
(1.0) |
Graduates to a national securities exchange |
16 |
13 |
12 |
13 |
14 |
(12.5) |
7.7 |
Market Data Licensing |
|||||||
Market data professional users |
20,991 |
21,487 |
21,776 |
21,766 |
21,446 |
2.2 |
(1.5) |
Market data non-professional users |
14,661 |
14,763 |
14,976 |
13,991 |
13,892 |
(5.2) |
(0.7) |
Revenue per terminal (total - $) |
162 |
164 |
165 |
170 |
172 |
6.5 |
1.3 |
Source: OTCM, Edison Investment Research
Strategic alliance with North Capital Investment Technology
In October, OTCM announced a strategic alliance with North Capital Investment Technology. This alliance ties in with the group’s positive view on the long-term potential for online private fund-raising and enthusiasm for applying technology to deliver cost-effective solutions for customers that minimise administrative burdens. OTCM cites a 2017 PWC study that found an average cost of $7.3m to raise between $25m and $100m through a public offering, a significant burden for a small venture company. Online private and public fund-raising is a way of reducing such costs and the alliance will allow companies on OTCQX and OTCQB to have access to the North Capital Technology platform to manage the whole process. Revenue sharing arrangements are in place as part of the alliance, which provides OTCM with a ready-made technology solution that can be integrated with its own website.
Regulatory developments
OTCM highlighted two publications from the SEC as being potentially significant for the business: a concept release and request for comment, and a proposed rule change.
The first, the Concept Release on Harmonization of Securities Offering Exemptions, was issued in June and seeks comments on the merits of changes to simplify, harmonize and improve the exempt offering framework. These exemptions have evolved over time with the JOBS, FAST and Economic Growth Acts all contributing to this process, adding complexity but also making a contribution to the growth in exempt offerings, which have outpaced registered offerings for at least the last 10 years (2018: $2.9tn versus $1.4tn). OTCM sees an opportunity here for modernisation of secondary market regulation and the exempt offering framework that would facilitate small company capital raising and enhance disclosure requirements for the benefit of investors. Its comments to the SEC include proposals intended to: (1) support small company capital formation; (2) fix the plumbing of small company public trading markets; and (3) enhance disclosures required from insiders, affiliates and other powerful market participants. Under (2) OTCM suggests consideration of pre-empting state Blue Sky rules with a uniform federal secondary trading exemption where adequate current information is publicly available. Other comments submitted have reflected different perspectives. These include one from the SEC’s own investor advocate that questions the potential for additional retail demand for exempt offerings, the appetite of companies for small retail shareholdings and how appropriate such investments would be for these investors. Given this is a concept release and no proposals have yet been developed by the SEC, it is too early to suggest how any potential changes might affect the OTCM business.
The second SEC action highlighted was the Proposed Rule and concept release on Exchange Act Rule 15c2-11. The rule concerned governs the publication of quotes in interdealer quotation systems such as the company’s OTC Link ATS and the proposed rule would require that information on the issuer and security be current and publicly available before a broker-dealer can begin or continue quoting that security. The SEC points out that securities traded on the OTC market are primarily owned by retail investors and that the absence of current information can contribute to incidents of fraud and manipulation.
OTCM notes that the new rule would recognise its disclosure standards and that certain securities could join its markets without a third party filing a Form 211. Companies without current information, such as those designated Pink No Information by OTCM would be excluded from having public broker-dealer quotes on OTC Link ATS. OTCM is currently preparing its comments on the proposed rule and intends to include reference to:
■
market efficiency benefits from regulatory recognition of OTCM’s disclosure standards;
■
proposals to provide efficient ‘expert’ markets for professional investors in securities which no longer have public quotes;
■
proposed additional regulatory guidance needed to give effect to the rule; and
■
potential changes to the FINRA rule relating to complying with the information requirements of Rule 15c2-11.
While OTCM indicates that its financial results would be affected (potentially both positively and negatively) if the rule change were adopted as proposed, it cannot determine how material this would be.
Background and outlook
We start by looking at the recent performance of selected equity market indices (Exhibit 8). This shows positive performance for the larger-cap dominated S&P 500 and Nasdaq Composite indices over all periods, with gains of over 25% year to date. The OTCQX Composite has also performed strongly year to date but the venture indices, including OTCQB, have experienced a markedly weaker performance over the periods shown.
Exhibit 8: Recent market index performance (total return %)
Period |
S&P 500 |
Nasdaq Composite |
OTCQX Composite |
OTCQB |
S&P TSX Venture |
AIM All-Share |
US$ |
US$ |
US$ |
US$ |
C$ |
£ |
|
3 months |
8.6 |
8.6 |
-2.9 |
-9.6 |
-7.9 |
4.4 |
6 months |
10.2 |
10.0 |
1.9 |
-24.0 |
-13.7 |
-6.0 |
1 year |
16.4 |
19.3 |
9.9 |
-21.3 |
-15.7 |
-5.3 |
Year to date |
26.8 |
30.1 |
19.6 |
-18.4 |
-5.6 |
5.5 |
Source: Bloomberg. Note: Priced on 18 November 2019.
The weakness in venture markets can be seen as a result of reduced investor risk appetite and this is captured in the State Street Investor Confidence Index. The index tracks changes in institutional investor holdings of risky versus safer investments and has declined significantly since a recent high in 2015, while showing some recovery from a low point earlier in 2019.
|
Exhibit 9: State Street Investor Confidence Index |
|
|
Source: Bloomberg, State Street |
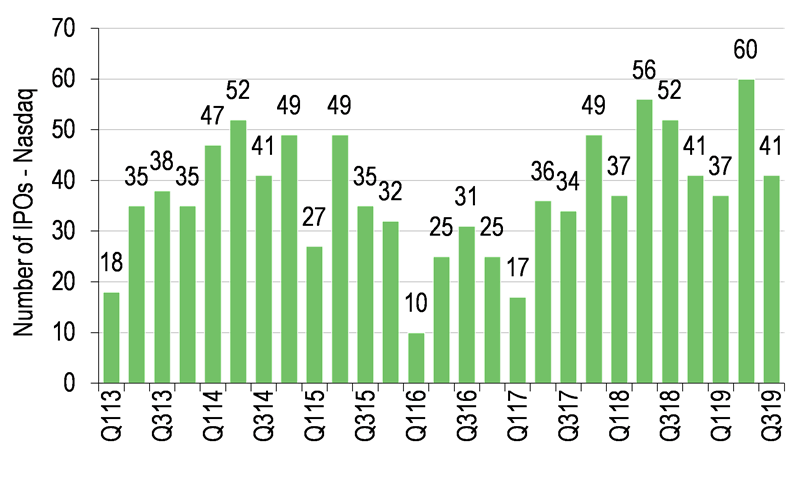
Exhibits 10 and 11 show IPO numbers for Nasdaq, and the Canadian TSX and TSX Venture exchanges as indicators of corporate and market confidence and activity. The number of IPOs on Nasdaq in the first nine months of 2019 was 5% below the prior year period at 138, but still 23% above the average nine-monthly rate of 112 over the period shown. On the Canadian exchanges, TSX IPOs in the first 10 months of the year were down 10% while, in tune with the market performance and apparent investor risk aversion, TSX Venture IPOs were 28% below the prior year period. Not shown here, but the number of new admissions to AIM in the first 10 months of 2019 were down 62% at 20, with the weakness likely to have been amplified by Brexit uncertainties.
|
Exhibit 10: Nasdaq – number of IPOs |
Exhibit 11: TSX and TSX Venture – number of IPOs |
|
|
|
Source: Nasdaq |
Source: TMX |
|
Exhibit 10: Nasdaq – number of IPOs |
|
|
Source: Nasdaq |
|
Exhibit 11: TSX and TSX Venture – number of IPOs |
|
|
Source: TMX |
OTCM has highlighted success in winning international clients for its premium markets, with 21 joining OTCQX in the third quarter including large cap names such as Hugo Boss. For international companies, OTCQX and OTCQB markets offer a complementary service to their domestic listing, facilitating cost-effective access to the US investor base. OTC’s directed marketing efforts to international companies continue to be helped by its partnership with the Canadian Securities Exchange and its own London office, established at the beginning of the year. In addition to OTCM’s traditional strength in Canada, prospective areas include European SMEs, Israeli venture-stage technology companies, and Australian minerals and resources companies. In total, there are already more than 600 international companies across both premium markets. The current geographical make-up of OTCQX and OTCQB Venture indices is shown in Exhibits 12 and 13. International companies account for 67% of OTCQX and 41% of OTCQB Venture indices, with the company seeing substantial potential for further growth in the number of international companies given the very large existing opportunity set and flow of new issues across international stock exchanges.
|
Exhibit 12: OTCQX Composite Index constituents |
Exhibit 13: OTCQB Venture Index constituents |
|
|
|
Source: OTCM. Note: % of 359 constituents 7/11/19 |
Source: OTCM. Note: % of 702 constituents 7/11/19 |
|
Exhibit 12: OTCQX Composite Index constituents |
|
|
Source: OTCM. Note: % of 359 constituents 7/11/19 |
|
Exhibit 13: OTCQB Venture Index constituents |
|
|
Source: OTCM. Note: % of 702 constituents 7/11/19 |
Looking ahead, near-term fluctuations in market sentiment could affect trading activity levels for OTC Link and corporate confidence, and hence the willingness of corporates and institutions to sign up for OTCM’s services. However, more strategically, the potential development of online/ crowdfunding capital raising could present a major opportunity for the group by generating a larger population of companies for which OTCM’s cost-effective markets would be appealing venues for secondary trading. Potential regulatory change could be of assistance here, although the detail of implementation and the market response will be key, and the SEC concept release and rule change discussed earlier remain at a formative stage. In the meantime, OTCM remains focused on its long-term strategy, and its commitment to using technology to provide cost-effective solutions for customers should be a strength as the market background and competitive conditions change over time.
Financials
Exhibit 14 summarises the changes in key numbers in our estimates following the Q319 results, with further detail included in the financial summary in Exhibit 17. Our revenue assumptions are essentially unchanged, with marginal changes in the mix between segments. We increased our operating expense assumptions earlier in the year and, again, changes this time are only marginal resulting in virtually unchanged pre-tax profit and EPS estimates for FY19 and FY20. Our dividend assumption for the current year is adjusted for the unchanged special dividend announced with the results, which was slightly lower than we factored in previously.
Exhibit 14: Estimate revisions
|
Gross revenue ($m) |
PBT ($m) |
Fully diluted EPS ($) |
Dividend ($) |
||||||||
|
Old |
New |
Change (%) |
Old |
New |
Change (%) |
Old |
New |
Change (%) |
Old |
New |
Change (%) |
2019e |
62.8 |
62.8 |
0.0 |
18.2 |
18.1 |
-0.5 |
1.25 |
1.26 |
0.5 |
1.27 |
1.25 |
-1.6 |
2020e |
66.6 |
66.6 |
0.0 |
21.0 |
21.0 |
0.0 |
1.43 |
1.42 |
-0.2 |
1.33 |
1.33 |
0.0 |
Source: Edison Investment Research. Note: Dividends include special dividends of 65c (actual) and 73c for FY19 and FY20, respectively.
The balance sheet remains strong, with cash of $25.8m and no debt at the end of Q319 ($26.1m end Q318) or $27.4m including restricted cash. 9M19 cash flow shows a jump in spending within investing activities at $5.35m versus $0.34m, reflecting the cash element of the Qaravan acquisition and spending associated with the headquarters move in Q1 and datacentre upgrades (completed ahead of plan in Q3). Excluding further acquisition opportunities, we expect investment spending to revert to a lower level, with a figure of $1.3m assumed in our estimate for FY20, for example.
Valuation
We have updated our comparative P/E table in Exhibit 15, which includes information providers MSCI and Markit together with the average multiples for global exchanges. OTCM shares are trading on prospective P/Es just below the average for exchanges and noticeably below those for information providers.
Exhibit 15: OTCM comparative multiples
P/E ratios (x) |
||
2019e |
2020e |
|
MSCI |
39.6 |
35.1 |
Markit |
27.3 |
24.6 |
Average information providers |
33.5 |
29.9 |
Average global exchanges |
28.4 |
25.0 |
OTCM |
27.0 |
23.9 |
Source: Refinitiv, Edison Investment Research. Note: Prices as at 18 November 2019.
The sensitivity of our discounted cash flow valuation to different discount rate and long-term growth assumptions is shown in the next table. The model factors in our explicit forecasts for FY19/20, which are essentially unchanged, together with an assumption of FY21–22 cash flow growth of 5%, long-term growth of 4% and a terminal cash flow multiple of c 21x, compared with the current year value of 26x. Our fair value is unchanged at $37.00 per share.
Exhibit 16: Discounted cash flow valuation sensitivity ($ per share)
Discount rate (right) |
8% |
9% |
10% |
11% |
12% |
3% |
40.6 |
37.8 |
35.3 |
33.1 |
31.0 |
4% |
42.5 |
39.6 |
37.0 |
34.6 |
32.4 |
5% |
44.6 |
41.5 |
38.7 |
36.2 |
33.9 |
6% |
46.8 |
43.5 |
40.6 |
37.9 |
35.4 |
Source: Edison Investment Research
Exhibit 17: Financial summary
$000s |
2015 |
2016 |
2017 |
2018 |
2019e |
2020e |
Year end 31 December |
||||||
PROFIT & LOSS |
||||||
OTC Link |
11,796 |
10,573 |
10,074 |
11,175 |
11,730 |
12,258 |
Market Data Licensing |
20,610 |
21,054 |
21,922 |
23,384 |
24,403 |
25,867 |
Corporate Services |
17,503 |
19,254 |
22,660 |
24,719 |
26,619 |
28,482 |
Revenue |
49,909 |
50,881 |
54,656 |
59,278 |
62,752 |
66,607 |
Re-distribution fees and rebates |
(2,379) |
(2,317) |
(2,480) |
(2,448) |
(2,482) |
(2,561) |
Net revenue |
47,530 |
48,564 |
52,176 |
56,830 |
60,270 |
64,047 |
Transaction-based expenses |
0 |
0 |
0 |
(375) |
(750) |
(826) |
Revenues less transaction-based expenses |
47,530 |
48,564 |
52,176 |
56,455 |
59,520 |
63,221 |
Operating expenses |
(28,972) |
(30,032) |
(32,511) |
(35,768) |
(40,071) |
(40,779) |
EBITDA |
18,558 |
18,532 |
19,665 |
20,687 |
19,449 |
22,442 |
Depreciation |
(1,692) |
(1,606) |
(1,361) |
(1,042) |
(1,427) |
(1,540) |
Operating profit |
16,866 |
16,926 |
18,304 |
19,645 |
18,022 |
20,902 |
Net interest |
27 |
9 |
47 |
116 |
112 |
110 |
Profit Before Tax |
16,893 |
16,935 |
18,351 |
19,761 |
18,134 |
21,012 |
Tax |
(6,635) |
(6,407) |
(5,792) |
(3,524) |
(3,051) |
(3,992) |
Profit after tax |
10,258 |
10,528 |
12,559 |
16,237 |
15,083 |
17,019 |
Profit after tax and allocation to RSAs |
9,971 |
10,252 |
12,241 |
15,840 |
14,716 |
16,652 |
Average Number of Shares Outstanding (m) |
11.3 |
11.3 |
11.6 |
11.6 |
11.7 |
11.7 |
EPS - basic (c) |
90.6 |
92.4 |
109.9 |
140.8 |
129.6 |
146.6 |
Fully diluted EPS (c) |
88.3 |
90.4 |
105.8 |
136.3 |
125.9 |
142.3 |
Dividend per share (c) |
108.0 |
116.0 |
116.0 |
123.0 |
125.0 |
133.0 |
EBITDA Margin (%) |
39 |
38 |
38 |
36 |
32 |
35 |
Operating profit margin (%) |
35 |
35 |
35 |
35 |
30 |
33 |
BALANCE SHEET |
||||||
Non-current assets |
|
|
|
|
|
|
Intangible assets |
291 |
291 |
362 |
312 |
283 |
329 |
Property and other |
4,187 |
3,267 |
3,506 |
4,584 |
24,853 |
24,567 |
Current assets |
|
|
|
|
|
|
Debtors |
6,082 |
6,262 |
6,450 |
4,942 |
4,752 |
4,752 |
Cash & cash investments |
23,925 |
25,034 |
23,683 |
28,813 |
26,751 |
32,185 |
Other current assets |
1,729 |
1,789 |
2,316 |
2,998 |
2,907 |
2,907 |
Current liabilities |
|
|
|
|
|
|
Deferred revenues |
(12,737) |
(14,664) |
(15,531) |
(16,070) |
(17,505) |
(18,731) |
Other current liabilities |
(5,063) |
(5,372) |
(5,644) |
(6,711) |
(6,609) |
(6,609) |
Long-term liabilities |
|
|
|
|
|
|
Tax, rent and other |
(867) |
(1,101) |
(1,351) |
(2,459) |
(17,539) |
(17,539) |
Net assets |
17,547 |
15,506 |
13,791 |
16,409 |
17,893 |
21,861 |
NAV per share ($) |
1.55 |
1.36 |
1.21 |
1.42 |
1.54 |
1.88 |
CASH FLOW |
||||||
Operating cash flow |
22,400 |
21,752 |
21,629 |
24,442 |
22,840 |
26,117 |
Net Interest |
27 |
9 |
47 |
116 |
112 |
110 |
Tax |
(5,320) |
(6,021) |
(5,193) |
(1,968) |
(2,896) |
(3,992) |
Capex / intangible investment |
(940) |
(415) |
(1,165) |
(549) |
(5,730) |
(1,300) |
Financing / investments |
(420) |
(1,157) |
(3,407) |
(2,716) |
(1,828) |
0 |
Dividends |
(12,094) |
(13,059) |
(13,262) |
(14,195) |
(14,560) |
(15,501) |
Net cash flow |
3,653 |
1,109 |
(1,351) |
5,130 |
(2,062) |
5,434 |
Opening net (debt)/cash |
20,272 |
23,925 |
25,034 |
23,683 |
28,813 |
26,751 |
Closing net (debt)/cash |
23,925 |
25,034 |
23,683 |
28,813 |
26,751 |
32,185 |
Cash and restricted cash |
24,135 |
25,244 |
24,375 |
30,534 |
28,311 |
33,745 |
Source: OTC Markets Group accounts, Edison Investment Research
|
|||||||||||||||||||||||||||||||||||||||||
|
|
Research: TMT
Mondo TV’s Q3 results continued in the more positive vein established in H1, with the flow of new content and licensing agreements carrying through into Q4 across a good range of properties, including new titles in the German JV with Toon2Tango. In October, the group announced new licensing deals in Russia with Gazprom Media and PJSC MegaFon for the streaming of Mondo TV library content. These deals help rebalance group revenues, historically heavily biased to Asia. Management’s business plan for FY19–FY23 (to which we have built in a degree of contingency) is unchanged, as are our forecasts.