Last close As at 05/08/2026
GBP0.99
▲ 1.00 (1.02%)
Market capitalisation
GBP159m
Research: Real Estate
Regional REIT
Regional REIT |
Active management for income |
Interim results update |
Real estate |
4 October 2016 |
Share price performance
Business description
Next events
Analysts
Regional REIT is a research client of Edison Investment Research Limited |
|||||||||||||||||||||||||||||||||||||||||||||||||
Regional REIT (RGL) provides a focused exposure to actively managed UK regional commercial real estate, predominantly secondary office and light industrial assets. The regional property recovery began later than in London and we believe RGL offers the potential for above average late-cycle income and capital growth. While Brexit has increased uncertainty about economic prospects, the asset manager observes that regional demand has so far remained resilient and anticipates higher rental income, with targeted improvements to occupancy through the second half of the year and into 2017. It has an established and diversified high-yielding portfolio that already supports the attractive 7.3% prospective dividend yield with the potential for income and capital growth from property-specific asset management initiatives.
Year |
Net rental income (£m) |
EPRA EPS* |
EPRA NAV |
DPS |
P/EPRA NAV |
Yield |
12/15** |
4.6 |
0.9 |
107.8 |
1.0 |
0.97 |
1.0 |
12/16e |
37.2 |
7.7 |
110.6 |
7.7 |
0.95 |
7.3 |
12/17e |
41.4 |
8.9 |
113.7 |
8.9 |
0.92 |
8.5 |
12/18e |
43.3 |
9.5 |
115.4 |
9.5 |
0.91 |
9.0 |
Note: *EPRA EPS is adjusted to include exceptional expenses related to listing and includes estimated performance fees.** 56-day trading period only.
High-yielding assets worked hard
RGL has an active asset management strategy, built on detailed plans for each property and targeting a 10-15% pa return to shareholders, including a 7-8% pa dividend return on the IPO price of 100p. The existing portfolio assets are relatively high yielding (H116 net initial yield 7.1%), capable of supporting a fully covered 2016e dividend yield of 7.3%, and well-diversified by property, region and tenant. The asset manager, LSI, brings a well-resourced and dedicated team, with cross-cycle experience, essential to exploit the opportunity provided by significant lease breaks and expiries over the next three years to grow income and valuation. Driven by the timing of acquisitions and H116 acquisition costs, we have slightly reduced 2016 estimates, offset by expected faster occupancy gains in 2017/18.
Positive market drivers intact
Regional commercial rents have been increasing against a background of improving occupational demand and declining availability. We see the ongoing development of the regions as key for RGL and while Brexit has added to uncertainty about longer term economic prospects, the asset manager observes that regional occupier demand has so far remained resilient and anticipates further gains in occupancy and rental income. Other demand drivers, such as business relocation, are structural and the manager points to an opportunity to benefit from a narrowing of the historically wide gap between secondary regional property yields versus prime as investor flows recover, with the regions taking an increased share.
Valuation: High dividend yield, fully covered
RGL’s prospective dividend yield of 7.3% is fully covered and at the top of the range for the UK REIT sector. The c 5% discount to our 2016e EPRA NAV, which assumes a constant valuation yield, is slightly wider than the sector median.
Investment summary
Regional REIT (RGL) has delivered its first set of interim results since listing on the Main Market of the London Stock Exchange (LSE) in November 2015. It is a UK-based real estate investment trust (REIT) that aims to deliver an attractive return to investors through investments in commercial property (predominantly office and light industrial property) in the main regional centres of the UK, effectively outside the M25 motorway. RGL was formed from the combination of two existing, privately owned, limited life property funds that had previously been created by the investment manager, Toscafund Asset Management (Tosca) and the external asset manager, London & Scottish Investments (LSI), and was thus able to come to market with an established and diversified portfolio of high-yielding properties. H116 has seen the £128.1m acquisition of additional property assets, including two substantial portfolios, and disposals of non-core assets have further progressed portfolio refocusing, both towards office and industrial property and across the regions. Refinancing has lowered the cost of debt.
RGL has an active asset management strategy, built off detailed plans for each property and targeting a 10-15% pa return to shareholders, including a 7-8% pa dividend return on the IPO price of 100p. The prospective dividend is fully covered and offers a sector-leading yield of 7.3%. LSI brings a well-resourced, dedicated team, with cross-cycle experience, and targets occupancy and rent increases to drive income and capital growth from existing assets. Regional commercial rents have been increasing against a background of improving occupational demand (including structural drivers such as business relocation) with declining availability, and are coming from a lower point in the cycle than London offices or the retail sector. The yield spread on secondary assets versus prime assets remains historically wide with the opportunity for RGL to benefit from further narrowing. While Brexit has increased uncertainty about longer-term economic prospects, the asset manager observes that regional demand has so far remained resilient and anticipates higher rental income with targeted improvements to occupancy through the second half of the year and into 2017. We recently wrote at length about RGL, its strategy and the investment opportunity in our initiation note, and provide an update here.
Highlights of the interim results
■
The gross value of the investment portfolio (externally assessed) increased to £501.3m in the period compared with £403.7m at the end of 2015. The like-for-like increase in value was 1.8%.
■
£128.1m of properties were acquired, including the Wing portfolio (£37.5m acquisition at 8.5% net initial yield) and Rainbow portfolio (£80.0m/8.2% net initial yield), and £41.2m of mature non-core assets sold (including Blythswood House at £17.4m/5.0% net initial yield).
■
Since the end of the period, RGL has acquired the Wallace portfolio, an office park of six buildings, for £5.5m. The portfolio is expected to provide an annualised net income of £0.8m, with a net initial yield of 12.0%.
■
As previously reported, average occupancy was lower at 81.8% (31 December 83.9%), but up from March 2016 (80.9%). The portfolio acquisitions were made at void rates above the portfolio average (Wing 78.2% and Rainbow 77.2% occupied), providing the opportunity to benefit from planned improvements. Both have since seen occupancy improvements and the manager reports significant new lettings in H216.
■
EPRA NAV per share was relatively flat at 108.0p (31 December 107.8p), but included acquisition and stamp duty costs of 2.5p and 2.8p of dividends paid.
■
Borrowing increased by £89.2m to £217.8m to finance acquisitions, with LTV at 38.1% (31 December 25.4%). The average all-in borrowing cost declined to 3.8% (31 December: 4.5%).
Focus on regional commercial property recovery
The regional commercial real estate opportunity
RGL’s target of a 10-15% pa return is based on targeting underexploited properties and managing them actively to improve occupancy and rents. Providing context for this, our views on the UK commercial property sector and the regional property opportunity were discussed at length in our initiation note and are briefly summarised here:
■
The recovery in commercial rents following the financial crisis began later in the regions than in London and rents have continued to increase against a background of improving occupational demand and declining availability.
■
Brexit has added uncertainty about economic growth, but other drivers of demand (such as business relocation) are structural.
■
Investment demand, predominantly targeted at stabilised income assets, has slowed from the record level seen in 2015, but there are signs that this has begun to increase, with the regions continuing to take a growing share.
■
The gap between yields on prime regional office properties and secondary properties remains historically wide and the manager continues to see a particular opportunity from a narrowing of this gap, expecting it to be achieved at least in part by further medium-term yield contraction on secondary property, providing the prospect of capital appreciation.
|
Exhibit 1: UK commercial real estate investment volumes (£bn) |
|
|
Source: Cushman & Wakefield research, Regional REIT |
Diversified business base manages asset management risks
RGL’s strategy is fundamentally different from peers, which may be more London-focused or targeting long leases. RGL seeks to add additional value by targeting underexploited properties and managing them actively to improve occupancy, rents and capital value over time. The diversification of the portfolio is an important element of balancing the risk of this strategy (whether it be market conditions or operational delivery), with the potential for enhanced rewards. At 30 June 2016, the RGL portfolio comprised 128 properties made of 974 individual units let to 719 tenants. It is also diversified by geography and increasingly focused (91.6% by value) on the targeted sectors of office and light industrial property. An appraisal of the top 15 tenants shows a broad mix across a wide variety of business sectors, and no excessive concentrations, in particular with respect to financial services companies. The largest tenant represents 5.3% of gross rental income and the largest property represents 6.6% of portfolio value. Selective acquisitions and non-core disposals since IPO, and continuing through H116, have contributed towards a rebalancing of the portfolio away from Scotland to more closely match the general regional economy and population (England and Wales now 73.5% by value versus 64.6% at IPO).
|
Exhibit 2: Segment split by income |
Exhibit 3: Regional split by income |
|
|
|
Source: Company data as at 30 June 2016 |
|
Exhibit 2: Segment split by income |
|
|
Source: Company data as at 30 June 2016 |
|
Exhibit 3: Regional split by income |
|
|
Source: Company data as at 30 June 2016 |
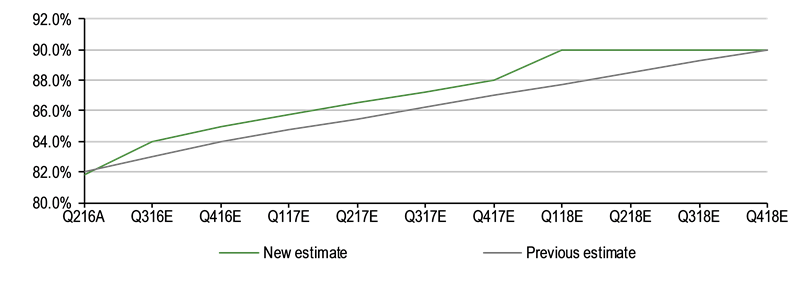
Occupancy at 30 June 2016 was 81.8%, which was lower than at the end of 2015, primarily due to the acquisition of the Wing and Rainbow portfolios at lower occupancy than the portfolio average, so as to be able to benefit from planned active asset management improvements. The manager indicates that leasing activity since the half year has taken occupancy to c 83%, and that at least 85% by year currently appears to be a reasonable objective. Assuming no change in the portfolio, no further acquisition of properties with low occupancy and the active asset management potential, the manager believes that c 90% occupancy is a reasonable level for long-term structural occupancy. The weighted average unexpired lease term to first break is 3.6 years, again a little lower than at year end (3.8% excluding the non-core, fully occupied Blytheswood House where the sale was announced in April, or 4.4 years including it), but not an unreasonable length when compared with current new lease terms. For the office and light industrial properties targeted by RGL, leases at inception tend to be in the region of 10 years with a five-year break clause or a straight five years with no break. Exhibit 4 shows that there is a noticeable pick-up in lease maturities in 2017 and 2018 and this represents both a key challenge for the manager and a key opportunity to benefit from its active asset management strategy.
|
Exhibit 4: Lease maturity to first break |
|
|
Source: Regional REIT |
Our forecasts assume that all maturing leases are extended or re-let on terms that are similar to the portfolio average expected rental value (ERV). We assume that ERV grows at 2% pa.
Very usefully the interim results contain information about the manager’s asset management and strategy and progress with respect to the Wing and Rainbow portfolios. We review this in the next section.
Asset management of newly acquired portfolios
The Wing portfolio was acquired in March of this year for £37.5m, representing an 8.5% net initial yield. The portfolio includes four office properties (Manchester, Leeds, Leicester and Basingstoke) and a light industrial site in Beverley. The portfolio provides a solid income base immediately, with the potential to add additional value from letting space already refurbished by the previous owner, refurbishing existing unlet space, restructuring existing leases and securing alternative uses. The letting of already refurbished space has increased occupancy from 78.2% at acquisition to 85.2% as of September 2016. Refurbishment has continued and a number of lease extensions are under negotiation.
The Rainbow portfolio was also acquired in March 2016 for £80m, representing a net initial yield of 8.2%. The investment plan looks to create additional value on the five office buildings and seven industrial sites by restructuring existing leases, and refurbishment and lettings of space. The portfolio is split c 45% industrial/55% office by rental income and is spread throughout the UK in major urban areas including Bristol, Manchester, Cardiff, Sheffield and the West Midlands. Occupancy of 77.2% on acquisition is now (as of September 2016) 78.2%. The portfolio includes two office buildings in Aylesbury, one of which is occupied by Lloyds Banking Group until 2021. At the other, RGL has secured a new 10-year lease with the anchor tenant Equitable Life over two floors and has agreed break terms with the tenant (LBG, which had served notice) on the other two. This will allow refurbishment of the vacant two floors and re-letting. The building is modern and attractive in a town centre location and the manager is optimistic of the re-letting potential. At the Aztec 800 office building, seven miles north-west of the Bristol city centre with good links to the M4 and M5, refurbishment is being finalised and potential occupier interest from more than one party seems strong. The manager believes that the go-ahead for the Hinkley Point C nuclear power station provides positive support for stronger local demand.
Estimate changes and valuation
Our medium-term forecasting framework is covered in detail in our initiation note. Following the interim results, we have made the following adjustments:
■
Although we have increased our estimate of gross contracted rental income for the end of 2016 from £45.8m to £46.7m, our 2016e net rental income actually declines slightly. H116 gross rental income of £43.7m was a little lower than we had allowed for and the further acquisition uplift that we had allowed for comes a little later in the year, feeding through to lower net rental income earned during the year.
■
However, the investment manager expects a continuing reduction in voids, with occupancy lifting to around 85% by the end of this year, and moving towards the c 90% expected structural void rate on a constant portfolio following asset management initiatives. We have increased our occupancy assumptions with a positive impact on 2017 and 2018 expected net rental income. We would draw attention to the opportunity that is indicated by the relatively low average rents and capital values attached to the current RGL portfolio. The regional office portfolio generates average rents of £12.80 per square foot and is valued at £118.50 per square foot, while the light industrial assets are let at an average rent of £3.70 per square foot with a value per square foot of £34.97. The manager suggests that new build costs for similar office assets is likely to be £140 to £180 per square foot and £60 to £65 per square foot for light industrial.
|
Exhibit 5: Edison occupancy assumptions |
|
|
Source: Company data, Edison Investment Research |
■
H1 expenses represented 31.8% of gross rental income and, although lower than the 39.3% reported for the shortened 2015 trading period, were running at a higher rate than the 27.5% that we had been forecasting for 2016 as a whole. 2015 was upwardly distorted by the shortened trading period, while H116 was affected by the higher average void rate (less recoverability of direct property costs), expenses related to the level of acquisition activity and public company status, and non-recoverability of VAT on asset manager fees. The asset manager is guiding to below 30% for the year as a whole and our upwardly revised forecast represents a 28.1% ratio. We continue to expect the ratio to decline over 2016 and 2017 as voids reduce and given the element of operational gearing implied by our NAV forecasts, to which management fees are formulaically linked.
■
H116 EPRA NAV was slightly lower than we had expected because of the expense impact and the increase in stamp duty introduced in the 2016 budget. The investment manager indicates that costs related to acquisition and the stamp duty change had a combined negative impact of c 2.5p per share.
Exhibit 6: Estimate revisions
Net rental income (£m) |
EPRA EPS* (p) |
EPRA NAV (p) |
DPS (p) |
|||||||||
New |
Old |
% chg. |
New |
Old |
% chg. |
New |
Old |
% chg. |
New |
Old |
% chg. |
|
12/16e |
37.2 |
38.1 |
-2% |
7.7 |
8.0 |
-4% |
110.6 |
113.1 |
-2% |
7.7 |
8.0 |
-3% |
12/17e |
41.4 |
40.9 |
1% |
8.9 |
8.6 |
3% |
113.7 |
116.1 |
-2% |
8.9 |
8.2 |
9% |
12/18e |
43.3 |
42.5 |
2% |
9.5 |
9.1 |
4% |
115.4 |
118.4 |
-3% |
9.5 |
8.6 |
11% |
Source: Edison Investment Research
As discussed above, RGL is targeting a total return of 10-15% pa to shareholders, including a 7-8% pa dividend return on the IPO price of 100p, with additional capital appreciation driven by specific asset management initiatives in the portfolio. The continued strengthening of the regional property market more generally would additionally support overall returns. Our forecasts indicate a dividend yield on the current share price of 105p of 7.3% (7.7% on the IPO price), very much towards the top of the range of prospective dividend yields for the UK REIT sector, while trading at a discount to 2016e of c 5%, slightly wider than the median.
|
Exhibit 7: Regional REIT prospective yield versus REIT sector peers |
|
|
Source: Bloomberg. Note: Those companies for which forecasts are available. Data as at 28 September 2016. |
As explored in detail in our initiation note, RGL seeks to engage in selective acquisitions to grow the portfolio on terms that are immediately accretive to EPRA EPS and dividend-paying capacity.
|
Exhibit 8: Regional REIT share price/NAV per share versus REIT sector peers |
|
|
Source: Bloomberg. Note: Those companies for which forecasts are available. Data as at 28 September 2016. |
Exhibit 9: Financial summary
Year end 31 December |
2015 |
2016e |
2017e |
2018e |
||
PROFIT & LOSS |
£'000s |
IFRS |
IFRS |
IFRS |
IFRS |
|
Gross rental income |
5,361 |
41,509 |
45,466 |
47,574 |
||
Non-recoverable property costs |
(754) |
(4,291) |
(4,092) |
(4,282) |
||
Revenue |
|
|
4,608 |
37,218 |
41,374 |
43,292 |
Administrative expenses |
(1,353) |
(7,380) |
(7,963) |
(8,212) |
||
EBITDA |
|
|
3,255 |
29,839 |
33,411 |
35,081 |
Gain on disposal of investment properties |
87 |
(75) |
0 |
0 |
||
Change in fair value of investment properties |
23,784 |
3,623 |
7,504 |
5,152 |
||
Operating profit before financing costs |
|
|
27,126 |
33,387 |
40,914 |
40,233 |
Performance fees |
0 |
(95) |
(974) |
(828) |
||
Exceptional items |
(5,296) |
0 |
0 |
0 |
||
Finance income |
177 |
97 |
68 |
25 |
||
Finance expense |
(997) |
(8,757) |
(9,161) |
(9,161) |
||
Net movement in the fair value of derivative financial investments |
115 |
(2,024) |
0 |
0 |
||
Profit Before Tax |
|
|
21,124 |
22,608 |
30,847 |
30,268 |
Tax |
0 |
0 |
0 |
0 |
||
Profit After Tax (FRS 3) |
|
|
21,124 |
22,608 |
30,847 |
30,268 |
Adjusted for the following: |
||||||
Performance fees |
0 |
95 |
974 |
828 |
||
Exceptional items |
5,296 |
0 |
0 |
0 |
||
Net gain/(loss) on revaluation |
(23,784) |
(3,623) |
(7,504) |
(5,152) |
||
Net movement in the fair value of derivative financial investments |
(180) |
1,904 |
0 |
0 |
||
Gain on disposal of investment properties |
(87) |
75 |
0 |
0 |
||
Profit before Tax (norm) |
|
|
2,370 |
21,059 |
24,317 |
25,944 |
Period end number of shares (m) |
274.2 |
274.2 |
274.2 |
274.2 |
||
Average Number of Shares Outstanding (m) |
274.2 |
274.2 |
274.2 |
274.2 |
||
Fully diluted average number of shares outstanding (m) |
274.2 |
274.2 |
274.2 |
274.2 |
||
EPS - fully diluted (p) |
|
|
7.7 |
8.2 |
11.2 |
11.0 |
EPS - normalised (p) |
|
|
0.9 |
7.7 |
8.9 |
9.5 |
Dividend per share (p) |
|
|
1.0 |
7.7 |
8.9 |
9.5 |
Dividend cover |
N/A |
100% |
100% |
100% |
||
BALANCE SHEET |
||||||
Fixed Assets |
|
|
407,492 |
512,918 |
528,421 |
541,573 |
Investment properties |
403,703 |
510,132 |
525,635 |
538,788 |
||
Goodwill |
2,786 |
2,786 |
2,786 |
2,786 |
||
Non-current receivables |
1,004 |
0 |
0 |
0 |
||
Current Assets |
|
|
35,803 |
31,284 |
26,351 |
19,497 |
Trade and other receivables |
11,848 |
13,816 |
13,195 |
14,527 |
||
Cash and equivalents |
23,954 |
17,468 |
13,157 |
4,970 |
||
Current Liabilities |
|
|
(21,485) |
(28,622) |
(30,693) |
(32,362) |
Trade and other payables |
(12,576) |
(15,354) |
(16,917) |
(18,169) |
||
Deferred income |
(5,906) |
(9,588) |
(10,097) |
(10,514) |
||
Taxation |
(2,387) |
(1,239) |
(1,239) |
(1,239) |
||
Bank and loan borrowings - current |
(200) |
0 |
0 |
0 |
||
Derivative financial instruments |
(416) |
(2,440) |
(2,440) |
(2,440) |
||
Long Term Liabilities |
|
|
(126,469) |
(214,771) |
(214,771) |
(214,771) |
Borrowings |
(126,469) |
(214,771) |
(214,771) |
(214,771) |
||
Net Assets |
|
|
295,341 |
300,809 |
309,308 |
313,937 |
Derivative interest rate swaps |
416 |
2,440 |
2,440 |
2,440 |
||
EPRA net assets |
|
|
295,757 |
303,249 |
311,748 |
316,377 |
IFRS NAV per share (p) |
107.7 |
109.7 |
112.8 |
114.5 |
||
EPRA NAV per share (p) |
107.8 |
110.6 |
113.7 |
115.4 |
||
LTV |
25.4% |
38.7% |
38.4% |
38.9% |
||
CASH FLOW |
||||||
Operating Cash Flow |
|
|
(2,232) |
28,800 |
35,130 |
34,589 |
Net Interest & other financing charges |
(411) |
(9,244) |
(9,093) |
(9,136) |
||
Tax |
0 |
0 |
0 |
0 |
||
Purchase of investment properties |
(4,191) |
(139,251) |
0 |
0 |
||
Sale of investment properties |
5,348 |
40,369 |
0 |
0 |
||
Capex |
(4,000) |
(8,000) |
(8,000) |
|||
Acquisition of subsidiaries, net of cash acquired |
26,659 |
0 |
0 |
0 |
||
Net proceeds from issue of shares |
0 |
0 |
0 |
0 |
||
Equity dividends paid |
0 |
(12,340) |
(22,349) |
(25,639) |
||
Other (including debt assumed on acquisition) |
0 |
1,077 |
0 |
0 |
||
Net Cash Flow |
25,172 |
(94,588) |
(4,312) |
(8,187) |
||
Opening net (debt)/cash |
|
|
(127,886) |
(102,714) |
(197,303) |
(201,614) |
Closing net (debt)/cash |
|
|
(102,714) |
(197,303) |
(201,614) |
(209,801) |
Source: Company accounts, Edison Investment Research
|
|