Last close As at 05/08/2026
CAD172.48
▲ 10.06 (6.19%)
Market capitalisation
CAD78,334m
Research: Metals & Mining
Wheaton Precious Metals’ (WPM’s) Q324 results, announced 7 November, showed a less than 1% variance for the quarter relative to our forecasts at the earnings level. Notably, however, three mines (Constancia, Stillwater and Voisey’s Bay) outperformed our expectations in terms of production but underperformed in terms of sales. This arguably sets up the potential for a rebound in Q4 when Wheaton’s streaming partners traditionally flush through sales ahead of the end of the financial year. Note that, at current metals prices, our EPS forecast for FY25 would be US$1.68 per share compared to the base case of US$1.23 per share.
Wheaton Precious Metals |
Record quarterly cash flow |
Q324 results |
Metals and mining |
11 November 2024 |
Share price performance
Business description
Next events
Analyst
Wheaton Precious Metals is a research client of Edison Investment Research Limited |
|||||||||||||||||||||||||||||||||||||||||||||||||||
Wheaton Precious Metals’ (WPM’s) Q324 results, announced 7 November, showed a less than 1% variance for the quarter relative to our forecasts at the earnings level. Notably, however, three mines (Constancia, Stillwater and Voisey’s Bay) outperformed our expectations in terms of production but underperformed in terms of sales. This arguably sets up the potential for a rebound in Q4 when Wheaton’s streaming partners traditionally flush through sales ahead of the end of the financial year. Note that, at current metals prices, our EPS forecast for FY25 would be US$1.68 per share compared to the base case of US$1.23 per share.
Year end |
Revenue |
PBT* |
EPS* |
DPS |
P/E |
Yield |
12/22 |
1,065.1 |
505.4 |
112 |
60 |
57.4 |
0.9 |
12/23 |
1,016.0 |
533.4 |
118 |
60 |
54.5 |
0.9 |
12/24e |
1,308.6 |
773.6 |
145 |
62 |
44.4 |
1.0 |
12/25e |
1,320.2 |
651.0 |
123 |
65 |
52.3 |
1.0 |
Note: *PBT and EPS are normalised, excluding amortisation of acquired intangibles and exceptional items.
FY24 marks the start of a multi-year growth profile
WPM has recently shown itself to be one of the major beneficiaries of the funding stasis for mining projects in western world financial markets by entering into a definitive precious metals purchase agreement (PMPA) with Montage Gold for its Koné mine in Côte d’Ivoire and by also updating and expanding its PMPA with Rio2 in respect of its Fenix project in Chile. Both are key components in packages that fully finance the projects and allow them to develop rapidly. Consequently, we are forecasting that WPM’s attributable production will grow to 899.0k gold equivalent ounces (GEOs) in FY30 (cf 601.8k GEOs in FY24e).
Valuation: Steady but with material upside potential
Using a capital asset pricing model-type method, whereby we discount cash flows at a nominal 9% per year, our terminal valuation of WPM has held steady at US$56.84 (C$78.90) in FY27, assuming zero subsequent long-term growth in real cash flows (which we think unlikely). If we instead assume 7.4% pa long-term growth in cash flows (ie the average compound annual growth rate in the price of gold from 1967 to 2023), our current valuation of WPM in FY24 increases more than twofold to US$136.09/share, or C$188.90/share. As such, at an implied rate of 5.6% per year, WPM’s share price currently appears to be discounting future compound annual average increases in cash flows per share from FY27 only very slightly in excess of the long-term average rate of US dollar inflation of 4.0% from 1967 until 2023. However, an alternative interpretation is that the market is assuming currently prevailing precious metals prices in FY27 and compound annual average increases in WPM’s cash flow per share of just 4.8% per annum. Otherwise, assuming no purchases of additional streams, we calculate a value per share for WPM of US$56.33 (or C$78.19, or £44.13) in FY27, based on a historical multiple of 30.8x contemporary earnings (albeit at a gold price of only US$2,239/oz). At current prevailing prices, our equivalent EPS estimate in FY27 rises by 33.3% and our valuation by a similar amount, to US$75.11/share (or C$104.25/share, or £58.84).
Q324 results
WPM’s Q324 results, on 7 November, after the bell in Toronto, were very close to our expectations, with a less than 1% variance for the quarter at the earnings level. In aggregate, sales were very close to our forecast and the main differences were a positive variance in the depletion charge, offset by a negative variance in expenses, primarily due to changes in accrued costs associated with the company’s performance share units (PSUs) contained within stock-based general and administrative (G&A) expenses. A full analysis of the quarter relative to both our prior expectations and Q224 is shown below:
Exhibit 1: WPM Q324 underlying financial results* cf prior expectations and Q224
US$000s |
Implied re-stated Q124 |
Underlying Q224 |
Q324e |
Q324a |
**Change (%) |
***Variance (%) |
**Change (units) |
***Variance (units) |
Silver production (koz) |
5,476 |
5,062 |
4,446 |
4,554 |
-10.0 |
2.4 |
-508 |
108 |
Gold production (oz) |
93,370 |
84,993 |
84,137 |
87,199 |
2.6 |
3.6 |
2,206 |
3,062 |
Palladium production (oz) |
4,463 |
4,338 |
4,209 |
4,034 |
-7.0 |
-4.2 |
-304 |
-175 |
Cobalt production (klb) |
240 |
259 |
214 |
397 |
53.3 |
85.5 |
138 |
183 |
|
|
|
|
|
||||
Silver sales (koz) |
4,067 |
3,823 |
3,690 |
3,875 |
1.4 |
5.0 |
52 |
185 |
Gold sales (oz) |
92,019 |
77,326 |
78,120 |
75,694 |
-2.1 |
-3.1 |
-1,632 |
-2,426 |
Palladium sales (oz) |
4,774 |
4,301 |
3,786 |
3,761 |
-12.6 |
-0.7 |
-540 |
-25 |
Cobalt sales (klb) |
309 |
88 |
214 |
88 |
0.0 |
-58.9 |
0 |
-126 |
|
|
|
|
|
||||
Average realised Ag price (US$/oz) |
23.77 |
29.11 |
29.45 |
29.71 |
2.1 |
0.9 |
0.60 |
0.26 |
Average realised Au price (US$/oz) |
2,072 |
2,356 |
2,476 |
2,491 |
5.7 |
0.6 |
135 |
15 |
Average realised Pd price (US$/oz) |
980 |
979 |
969 |
969 |
-1.0 |
0.0 |
-10 |
0 |
Average realised Co price (US$/lb) |
15.49 |
16.02 |
12.48 |
10.65 |
-33.5 |
-14.7 |
-5.37 |
-1.83 |
|
|
|
|
|
||||
Average Ag cash cost (US$/oz) |
4.77 |
4.95 |
5.00 |
5.03 |
1.6 |
0.6 |
0.08 |
0.03 |
Average Au cash cost (US$/oz) |
439 |
441 |
442 |
440 |
-0.2 |
-0.5 |
-1 |
-2 |
Average Pd cash cost (US$/oz) |
182 |
175 |
174 |
173 |
-1.1 |
-0.6 |
-2 |
-1 |
Average Co cash cost (US$/lb)**** |
2.96 |
3.11 |
2.25 |
2.15 |
-30.9 |
-4.4 |
-0.96 |
-0.10 |
|
|
|
|
|
||||
Sales |
296,806 |
299,064 |
308,425 |
308,253 |
3.1 |
-0.1 |
9,189 |
-172 |
Cost of sales |
|
|
|
|
|
|||
Cost of sales, excluding depletion |
61,555 |
54,007 |
54,078 |
55,310 |
2.4 |
2.3 |
1,303 |
1,232 |
Depletion |
63,676 |
58,865 |
58,507 |
55,530 |
-5.7 |
-5.1 |
-3,335 |
-2,977 |
Total cost of sales |
125,231 |
112,872 |
112,585 |
110,840 |
-1.8 |
-1.5 |
-2,032 |
-1,745 |
Earnings from operations |
171,575 |
186,192 |
195,840 |
197,413 |
6.0 |
0.8 |
11,221 |
1,573 |
Expenses and other income |
|
|
|
|
|
|||
– General and administrative***** |
13,315 |
17,185 |
19,017 |
21,468 |
24.9 |
12.9 |
4,283 |
2,451 |
– Foreign exchange (gain)/loss |
0 |
N/A |
N/A |
0 |
0 |
|||
– Interest paid |
1,442 |
1,299 |
1,378 |
1,404 |
8.1 |
1.9 |
105 |
26 |
– Other (income)/expense |
(6,840) |
(4,752) |
(7,828) |
(6,907) |
45.3 |
-11.8 |
-2,155 |
921 |
Total expenses and other income |
7,917 |
13,732 |
12,567 |
15,965 |
16.3 |
27.0 |
2,233 |
3,398 |
Earnings before income taxes |
163,658 |
172,460 |
183,273 |
181,448 |
5.2 |
-1.0 |
8,988 |
-1,825 |
Income tax expense/(recovery) |
24,824 |
22,895 |
29,412 |
28,645 |
25.1 |
-2.6 |
5,750 |
-767 |
Marginal tax rate (%) |
15.2 |
13.3 |
16.0 |
15.8 |
18.8 |
-1.3 |
2.5 |
-0.2 |
Net earnings |
138,834 |
149,565 |
153,861 |
152,803 |
2.2 |
-0.7 |
3,238 |
-1,058 |
Average no. shares in issue (000s) |
453,094 |
453,430 |
453,430 |
453,641 |
0.0 |
0.0 |
211 |
211 |
Basic EPS (US$) |
0.306 |
0.330 |
0.339 |
0.337 |
2.1 |
-0.6 |
0.007 |
-0.002 |
Diluted EPS (US$) |
0.306 |
0.329 |
0.339 |
0.336 |
2.1 |
-0.9 |
0.007 |
-0.003 |
DPS (US$) |
0.155 |
0.155 |
0.155 |
0.155 |
0.0 |
0.0 |
0.000 |
0.000 |
Source: Wheaton Precious Metals, Edison Investment Research. Note: *Excluding impairments, impairment reversals and exceptional items (unless otherwise indicated). **Change is Q324 cf Q224. ***Variance is Q324 cf Q324e. ****Cobalt inventory is held on WPM’s balance sheet at the lower of cost and net realisable value; cash costs per pound of cobalt sold are, therefore, affected by changes in the valuation of inventory quarterly. *****Forecasts include stock-based compensation costs. Totals may not add up owing to rounding.
Note that, for the purposes of the above analysis, we have shown Q224 on an underlying basis, with the global minimum tax (GMT) attributable in Q124 but reported in Q224, adjusted back out into Q124 (which is also the basis of our implied re-stated Q124 numbers).
As a result, not only were WPM’s results in line with our expectations, but they were also in line with the market consensus:
Exhibit 2: WPM Q324 EPS results cf Q124 and Q224 actuals and market consensus expectations (US$/share)
Q124 |
Q224 |
Q324e |
Q324 |
Variance (%) |
|
Edison forecasts |
0.306 |
0.330 |
0.339 |
0.337 |
-0.6 |
Mean consensus |
0.306 |
0.330 |
0.339 |
0.337 |
-0.6 |
High consensus |
0.306 |
0.330 |
0.400 |
0.337 |
-15.8 |
Low consensus |
0.306 |
0.330 |
0.330 |
0.337 |
+2.1 |
Source: LSEG Data & Analytics, Edison Investment Research. Note: Forecasts as at 28 October 2024.
At the level of the individual mines, four (Salobo, Penasquito, Antamina and Los Filos) outperformed our forecasts in terms of both production and sales, while two mines (Marmato and Sudbury) underperformed.
In the third quarter of 2024, Salobo produced 62,700oz of attributable gold, a decline of 9.2% relative to Q323, owing primarily to lower grades, partially offset by higher throughput. This is notwithstanding a stoppage at the Salobo III processing plant for 31 days in June and July, owing to a conveyor belt fire that threatened to also close Salobo I and II as well had it not been for a rapid and effective response by on-site management. Given copper output during the quarter, gold production was almost exactly in line with the long-term correlation between the two (Exhibit 3). Vale has maintained its copper production guidance at 320–355kt for the year, which is consistent with its year-to-date performance. We are still expecting gold production attributable to Wheaton from Salobo to decline in Q424, under the influence of lower grades. However, in this respect, we think that the risks/opportunities lie largely to the upside (see Exhibit 4).
|
Exhibit 3: Salobo copper production versus gold production attributable to WPM, Q316–Q324e |
Exhibit 4: Gold production attributable to WPM from Salobo, Q412–Q424e |
|
|
|
Source: Wheaton Precious Metals, Edison Investment Research |
Source: Wheaton Precious Metals, Vale, Edison Investment Research |
|
Exhibit 3: Salobo copper production versus gold production attributable to WPM, Q316–Q324e |
|
|
Source: Wheaton Precious Metals, Edison Investment Research |
|
Exhibit 4: Gold production attributable to WPM from Salobo, Q412–Q424e |
|
|
Source: Wheaton Precious Metals, Vale, Edison Investment Research |
Notably, three mines (Constancia, Stillwater and Voisey’s Bay) outperformed our expectations for the quarter in terms of production, but underperformed in terms of sales. At least in part this is likely to have contributed to a 7,871oz increase of GEOs produced but not yet delivered to Wheaton by its counterparties. However, it also arguably sets up a rebound in Q4 when they traditionally flush through sales ahead of the end of the calendar (and usually financial) year.
Ounces produced but not yet delivered
Silver sales were 0.7Moz, or 14.9%, below production, which represented a marked improvement relative to the previous three quarters and a return to close to the long-term average under-sales rate of 12.6% (±11.1% standard deviation) since Q112. By contrast, at 11,505oz (13.2% of production) the gold under-sale rate ticked up to just above its prior long-term historical average of 7.1% per quarter (±17.2%). As is common, Salobo, which sold 4,588oz, or 7.3%, fewer ounces than it produced, accounted for a large portion of the relative under-sale of gold relative to production. In this case, however, it was also joined by Constancia, which sold 5,260oz, or 50.4%, fewer gold ounces than it produced. The two mines together accounting for substantially all of the gold produced but not yet delivered to Wheaton.
|
Exhibit 5: Over/(under) sale of silver and gold as a percentage of production, Q112–Q324 |
|
|
Source: Edison Investment Research, Wheaton Precious Metals. Note: As reported. |
As a result, gold ounces PBND increased by 6,491oz (or 7.2%) to 96,158oz, or 3.25 months of estimated FY24 production (cf 3.07 months at the end of Q224), which compares with WPM’s target levels of two to three months of PBND for gold and palladium production. Silver ounces PBND amounted to 2.7Moz at the quarter’s end and equates to 1.65 months of our forecast FY24 production level (cf 1.65 at the end of Q224), albeit this remains below WPM’s target level of two months for silver production.
|
Exhibit 6: WPM ounces produced but not yet delivered, Q316–Q324 (months of production) |
|
|
Source: Edison Investment Research, Wheaton Precious Metals. Note: As reported. |
General and administrative expenses
At the time of its Q423 results, WPM provided guidance for non-stock G&A expenses of US$41–45m, or US$10.25–11.25m per quarter, for FY24, which represents a decline relative to US$47–50m in FY23 and US$47–49m in FY22 and is on a par with guidance of US$42–44m for FY21 and US$40–43m for FY20.
Given WPM’s share price as at the date of our last note in October, we forecast that the total G&A charge for WPM in Q3 would be US$19.0m. In the event, it was slightly above this level, at US$21.5m, primarily as a result of changes in accrued costs associated with the company’s performance share units (PSUs), albeit the variance in the stock-based G&A charge remained within the US$2.4m error of estimation implied by the correlation between the two (see Exhibit 8).
Exhibit 7: WPM G&A expenses, Q322–Q324 (US$000s)
Item |
Q322 |
Q422 |
Q123 |
Q223 |
Q323 |
Q423 |
Q124 |
Q224 |
Q324e |
Q324 |
G&A salaries excluding PSU and equity settled stock-based compensation |
4,629 |
4,187 |
5,021 |
4,749 |
4,591 |
4,051 |
5,365 |
5,083 |
5,002 |
|
Other (including depreciation, donations and professional fees) |
5,137 |
7,112 |
6,456 |
7,407 |
5,751 |
7,401 |
6,669 |
5,861 |
6,838 |
|
Non-stock-based G&A |
9,766 |
11,299 |
11,477 |
12,156 |
10,342 |
11,452 |
12,034 |
10,944 |
10,750 |
11,840 |
Guidance |
11,750–12,250 |
11,750–12,250 |
11,750–12,500 |
11,750–12,500 |
11,750–12,500 |
11,750–12,500 |
10,250–11,250 |
10,250–11,250 |
10,250–11,250 |
10,250–11,250 |
PSU accrual |
(1,491) |
7,035 |
5,855 |
2,625 |
2,604 |
5,222 |
(317) |
4,586 |
7,903 |
|
Equity settled stock-based compensation |
1,568 |
1,439 |
1,542 |
1,859 |
1,732 |
1,305 |
1,598 |
1,655 |
1,725 |
|
Stock-based G&A |
77 |
8,474 |
7,397 |
4,484 |
4,336 |
6,527 |
1,281 |
6,241 |
8,267 |
9,628 |
Total general & administrative |
9,843 |
19,773 |
18,874 |
16,640 |
14,678 |
17,979 |
13,315 |
17,185 |
19,017 |
21,468 |
Non-stock as pct of total G&A (%) |
99.2 |
57.1 |
60.8 |
73.1 |
70.5 |
63.7 |
90.4 |
63.7 |
56.5 |
55.2 |
Source: Wheaton Precious Metals, Edison Investment Research. Note: PSU = performance share units. Totals may not add up owing to rounding.
Exhibit 8, below, shows the precise position of Wheaton’s stock-based G&A charge in Q3 relative to Wheaton’s share price movement in US dollars.
|
Exhibit 8: Graph of historical share price change (US$/share) versus stock-based G&A expenses (US$000s), quarterly, Q419–Q324 |
|
|
Source: Edison Investment Research (underlying data: Bloomberg and Wheaton Precious Metals) |
Given Wheaton’s share price performance so far in Q424, we would expect the stock-based G&A charge to fall back once again in Q4 (albeit this is against the historical precedent whereby the charge in the final quarter of the year tends to be higher), such that the total G&A charge for the year is US$68.8m, of which the stock-based component will account for US$23.3m (33.8%).
FY24 and future forecasts cf guidance
On 20 February, WPM provided detailed production guidance for FY24 and beyond. This guidance is summarised below relative to our updated FY24 forecasts in light of year-to-date results:
Exhibit 9: WPM precious metals production – Edison forecasts compared to guidance
FY24e |
FY28e |
FY29–33 |
|
Prior Edison forecast |
|||
Silver production (Moz) |
19.9 |
||
Gold production (koz) |
352.5 |
||
Cobalt production (klb) |
927 |
||
Palladium production (koz) |
17.2 |
||
Gold equivalent (koz) |
596.5 |
816 |
885 |
Current Edison forecast |
|||
Silver production (Moz) |
20.0 |
||
Gold production (koz) |
355.6 |
||
Cobalt production (klb) |
1,110 |
||
Palladium production (koz) |
17.0 |
||
Gold equivalent (koz) |
601.8 |
816 |
885 |
WPM guidance |
|||
Silver production (Moz) |
18.5–20.5 |
||
Gold production (koz) |
325–370 |
||
Cobalt & palladium production (koz AuE) |
12–15 |
||
Gold equivalent (koz) |
550–620 |
>800 |
>850 |
Source: Wheaton Precious Metals, Edison Investment Research forecasts. Note: *Edison forecasts include Antamina extension from FY28.
WPM’s guidance for FY24 and beyond is based on standardised pricing assumptions of US$2,000/oz gold, US$23.00/oz silver, US$1,000/oz palladium, US$1,000/oz platinum and US$13.00/lb cobalt. Of note is the implied gold/silver ratio of 87.0x, which compares with the current ratio of 84.9x, but a longer-term average of 60.1x since gold was demonetised in August 1971. At the updated standardised prices indicated, our production forecast of 601.8koz gold equivalent (GEO or AuE) for FY24 is towards the upper end of WPM’s guidance range of 550–620koz AuE. However, our sales forecast of 539.1koz AuE is more conservative (see Exhibit 10).
Otherwise, readers will note that our longer-term production forecasts are within 5% of WPM’s guidance for the period FY29–33, albeit WPM’s guidance will have included neither a contribution from the company’s new Koné precious metals purchase agreement (PMPA) nor any incremental contribution from Fenix as a result of the revision of the stream’s terms – both announced in October.
FY24 forecasts
In the light of Q324 results, we have very slightly adjusted our forecasts for FY24 to those shown in Exhibit 10, below:
Exhibit 10: WPM FY24e forecast, by quarter*
US$000s |
Implied re-stated Q124 |
Underlying Q224 |
Q323 |
Q424e |
Q424e |
FY24e |
FY24e |
Silver production (koz) |
5,476 |
5,062 |
4,554 |
4,958 |
4,958 |
20,043 |
19,943 |
Gold production (oz) |
93,370 |
84,993 |
87,199 |
90,028 |
90,028 |
355,590 |
352,528 |
Palladium production (oz) |
4,463 |
4,338 |
4,034 |
4,209 |
4,209 |
17,044 |
17,218 |
Cobalt production (klb) |
240 |
259 |
397 |
214 |
214 |
1,110 |
927 |
|
|
||||||
Silver sales (koz) |
4,067 |
3,823 |
3,875 |
4,843 |
4,843 |
16,608 |
16,423 |
Gold sales (oz) |
92,019 |
77,326 |
75,694 |
90,007 |
90,007 |
335,046 |
337,472 |
Palladium sales (oz) |
4,774 |
4,301 |
3,761 |
4,192 |
4,192 |
17,028 |
17,053 |
Cobalt sales (klb) |
309 |
88 |
88 |
214 |
214 |
699 |
825 |
|
|
||||||
Avg realised Ag price (US$/oz) |
23.77 |
29.11 |
29.71 |
31.71 |
31.84 |
28.74 |
28.63 |
Avg realised Au price (US$/oz) |
2,072 |
2,356 |
2,491 |
2,714 |
2,706 |
2,402 |
2,402 |
Avg realised Pd price (US$/oz) |
980 |
979 |
969 |
1,026 |
1,045 |
993 |
988 |
Avg realised Co price (US$/lb) |
15.49 |
16.02 |
10.65 |
11.82 |
11.00 |
13.58 |
13.81 |
|
|
||||||
Avg Ag cash cost (US$/oz) |
4.77 |
4.95 |
5.03 |
5.10 |
5.11 |
4.97 |
4.96 |
Avg Au cash cost (US$/oz) |
439 |
441 |
440 |
451 |
451 |
443 |
443 |
Avg Pd cash cost (US$/oz) |
182 |
175 |
173 |
185 |
188 |
180 |
179 |
Avg Co cash cost (US$/lb) |
2.96 |
3.11 |
2.15 |
2.13 |
1.98 |
2.58 |
2.58 |
|
|
||||||
Sales |
296,806 |
299,064 |
308,253 |
404,660 |
404,495 |
1,308,618 |
1,308,955 |
Cost of sales |
|
|
|||||
Cost of sales, excluding depletion |
61,555 |
54,007 |
55,310 |
66,468 |
66,510 |
237,384 |
236,109 |
Depletion |
63,676 |
58,865 |
55,530 |
70,716 |
72,448 |
250,518 |
251,764 |
Total cost of sales |
125,231 |
112,872 |
110,840 |
137,184 |
138,958 |
487,902 |
487,873 |
Earnings from operations |
171,575 |
186,192 |
197,413 |
267,476 |
265,536 |
820,716 |
821,082 |
Expenses and other income |
|
|
|||||
– General and administrative** |
13,315 |
17,185 |
21,468 |
17,503 |
16,858 |
68,826 |
67,020 |
– Foreign exchange (gain)/loss |
0 |
0 |
0 |
0 |
|||
– Net interest paid/(received) |
1,442 |
1,299 |
1,404 |
1,378 |
1,378 |
5,523 |
5,496 |
– Other (income)/expense |
(6,840) |
(4,752) |
(6,907) |
(7,536) |
(8,716) |
(27,215) |
(26,955) |
Total expenses and other income |
7,917 |
13,732 |
15,965 |
11,345 |
9,519 |
47,133 |
45,561 |
Earnings before income taxes |
163,658 |
172,460 |
181,448 |
256,131 |
256,017 |
773,583 |
775,521 |
Income tax expense/(recovery) |
24,824 |
22,895 |
28,645 |
39,760 |
39,700 |
116,064 |
116,891 |
Marginal tax rate (%) |
15.2 |
13.3 |
15.8 |
15.5 |
15.5 |
15.0 |
15.1 |
Net earnings |
138,834 |
149,565 |
152,803 |
216,371 |
216,317 |
657,519 |
658,630 |
Average no. shares in issue (000s) |
453,094 |
453,430 |
453,641 |
453,430 |
453,641 |
453,452 |
453,346 |
Basic EPS (US$) |
0.306 |
0.330 |
0.337 |
0.477 |
0.477 |
1.450 |
1.453 |
Diluted EPS (US$) |
0.306 |
0.329 |
0.336 |
0.476 |
0.476 |
1.448 |
1.451 |
DPS (US$) |
0.155 |
0.155 |
0.155 |
0.155 |
0.155 |
0.620 |
0.620 |
Source: Wheaton Precious Metals, Edison Investment Research. Note: *Excluding impairments, impairment reversals and exceptional items (except where indicated). **Forecasts include stock-based compensation costs. Totals may not add up owing to rounding.
Our updated adjusted basic EPS forecast of US$1.450 per share is towards the top end of the range of brokers’ expectations for Q424 and FY24. Within this context, it is worth noting, that the range of brokers’ expectations for Q424 and ‘Sum Q1-Q424e’ appears to have been rising in recent weeks, although this is not the case for FY24e as a whole or FY25e, perhaps demonstrating a degree of divergence regarding the future prices of precious metals.
Exhibit 11: WPM FY24 consensus EPS forecasts (US$/share), by quarter
Q124 |
Q224 |
Q324 |
Q424e |
Sum Q1–Q424e |
FY24e |
FY25e |
|
Edison forecasts |
0.306 |
0.330 |
0.337 |
0.477 |
1.450 |
1.450 |
1.230 |
Mean consensus |
0.306 |
0.330 |
0.337 |
0.449 |
1.422 |
1.359 |
1.703 |
High consensus |
0.306 |
0.330 |
0.337 |
0.476 |
1.449 |
1.490 |
2.250 |
Low consensus |
0.306 |
0.330 |
0.337 |
0.410 |
1.383 |
0.990 |
1.200 |
Source: LSEG Data & Analytics, Edison Investment Research. Note: As at 28 October 2024.
Readers should note that our low EPS forecast for FY25 arises largely from the use of relatively low precious metals forecasts of US$2,004/oz Au and US$23.72/oz Ag (see also Exhibit 18). These will be revisited early in the next financial year. In the event that metals prices remain at current levels, however, our FY25 EPS estimate instead rises to US$1.68/share.
Valuation
Absolute
WPM is a multi-asset company that has shown a willingness and desire to buy streams in the past to maintain production and maximise shareholder returns. As a result, rather than our customary method of discounting maximum potential dividends over the life of operations back to FY24, in the case of WPM, we discount forecast cash flows back over four years to the start of FY24 and then apply an ex-growth terminal multiple to forecast cash flows in that year (FY27) based on the appropriate discount rate.
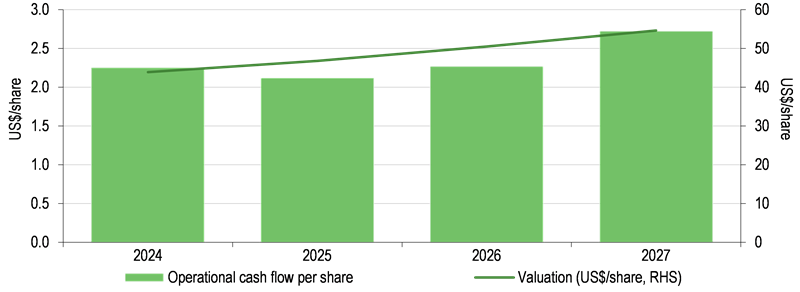
In this case, our estimate of WPM’s terminal cash flow in FY27 remains ostensibly unchanged at US$2.72/share (cf US$2.73/share previously).
|
Exhibit 12: WPM operational cash flow and related valuation (US$/share), FY24–27 |
|
|
Source: Edison Investment Research. Note: Valuation line assumes cash flow per share growth rate of 4% pa post-FY26 in nominal terms, which equals the average US rate of CPI inflation since 1972 (ie 0% pa growth in real terms). |
Assuming 4% growth in nominal cash flows beyond FY27 (ie 0% growth in real cash flows) and applying a discount rate of 9% (being the expected long-term required nominal equity return), our terminal valuation of the company at end-FY27 is US$56.84, or C$78.90, per share. However, it should be noted that this valuation is inherently conservative in that it assumes a (nominal) gold price of US$2,239/oz and zero growth in (real) cash flows beyond FY27. This is inconsistent with the gold price, which has risen at a compound average annual growth rate of 7.4% per year from 1967 to 2023, a simple average annual growth rate of 9.3% per year (cf a compound average inflation rate over the same period of 4.0%) and a compound average real annual growth rate of 3.0% per year.
|
Exhibit 13: Gold price annual performance, 1968–2023 |
|
|
Source: Edison Investment Research (underlying data: US Bureau of Labor Statistics, Bloomberg, South African Chamber of Mines) |
It is also inconsistent with WPM’s longer-term historical performance, wherein operational cash flows have increased at a compound average annual growth rate of 19.6% pa for the 18 years between FY05 and FY23, while its operational cash flows per share have increased at a compound average annual growth rate of 13.2% pa.
If we instead assume that cash flows per share increase at a compound average annual growth rate of 7.4% (ie the average compound average annual growth rate in the gold price from 1967 to 2023, cf 4.0% above), then our terminal valuation of WPM increases manyfold to US$187.01/share, or C$259.59/share, and our current valuation to US$136.09/share, or C$188.90/share.
Stated alternatively, WPM’s current share price of C$89.28 appears to be discounting future compound annual average increases in cash flow per share of just 5.6% pa from FY27, which is only slightly higher than the long-term average rate of US inflation of 4.0% pa from 1967 to 2023 (inclusive).
A summary of these valuations with respect to their cash flow growth rate assumptions is as follows:
Exhibit 14: WPM valuation with respect to long-term cash flow growth rate assumptions post-FY27
Long-term cash flow growth rate assumption (%) |
Comment |
WPM valuation |
WPM valuation |
4.0 |
Zero real growth rate (ie rate equals compound average US inflation rate), 1967–2023 |
43.87 |
60.89 |
5.6 |
Implied cash flow per share growth rate required to justify current share price |
64.32 |
89.28 |
7.4 |
Gold price compound average annual growth rate, 1967–2023 |
136.09 |
188.90 |
Source: LSEG Data & Analytics, Edison Investment Research
An alternative interpretation is that the market is assuming currently prevailing precious metals’ prices in FY27, in which case WPM’s share price of C$89.28 could be said to be discounting compound annual average increases in cash flows per share of just 4.8% per annum.
Historical
Excluding FY04 (part-year), WPM’s shares have historically traded on an average P/E multiple of 30.8x current year basic underlying EPS, excluding impairments (cf 44.4x Edison and 45.4x LSEG Data & Analytics consensus FY24e currently, see Exhibit 16).
|
Exhibit 15: WPM’s average historical current year P/E multiples, 2005–23 |
|
|
Source: Average share price data Bloomberg, Edison Investment Research calculations |
Applying this 30.8x multiple to our unchanged EPS forecast of US$1.83 in FY27 implies a potential value per share for WPM of US$56.33 or C$78.19 in that year. However, it is also notable that Edison’s forecast metals prices in that year currently are only US$2,239/oz Au and US$25.32/oz Ag. At current prices, our EPS forecast of US$1.83/share in FY27 instead rises to US$2.44/share, in which case our equivalent valuation would rise US$75.11, or C$104.25, per share. Moreover, as can be observed from the graph above, during periods of precious metal price appreciation, WPM can command current year P/E ratios as high as 45.0x (eg 2019).
Relative
In the meantime, WPM is maintaining its premium rating relative to its peers, albeit it appears good value within the context of future dividend expectations, especially in years two and three:
Exhibit 16: WPM comparative valuation versus a sample of operating and royalty/streaming companies
P/E (x) |
Yield (%) |
P/CF (x) |
|||||||
Year 1 |
Year 2 |
Year 3 |
Year 1 |
Year 2 |
Year 3 |
Year 1 |
Year 2 |
Year 3 |
|
Royalty companies |
|||||||||
Franco-Nevada |
38.5 |
31.6 |
28.9 |
1.1 |
1.2 |
1.3 |
28.5 |
23.2 |
22.6 |
Royal Gold |
29.6 |
23.0 |
23.2 |
1.1 |
1.1 |
1.3 |
19.5 |
15.5 |
15.0 |
Sandstorm Gold |
67.8 |
29.5 |
37.2 |
0.9 |
0.9 |
N/A |
15.5 |
13.5 |
14.7 |
Osisko |
42.6 |
31.9 |
31.0 |
0.8 |
0.8 |
0.7 |
25.7 |
21.0 |
20.4 |
Average |
44.6 |
29.0 |
30.1 |
1.0 |
1.0 |
0.8 |
22.3 |
18.3 |
18.2 |
WPM (Edison forecasts) |
44.4 |
52.3 |
42.9 |
1.0 |
1.0 |
1.0 |
28.6 |
30.3 |
28.4 |
WPM (consensus) |
45.4 |
35.9 |
36.4 |
0.9 |
1.0 |
1.0 |
30.0 |
24.1 |
26.4 |
Source: LSEG Data & Analytics, Edison Investment Research. Note: Peers and WPM (consensus) priced on 28 October 2024.
Readers will note Edison’s relatively high year 2 P/E ratio, which arises from our relatively low precious metals forecasts of US$2,004/oz Au and US$23.72/oz Ag for FY25. As noted previously, if metals prices remain at current levels, our FY25 EPS estimate instead rises to US$1.68/share, in which case our year 2 P/E ratio above would be 38.2x, much more in line with consensus. Our precious metals forecasts will be updated early in the next financial year (see also Exhibit 11).
Financials: End-Q3 US$688.4m in net cash
As at 30 September, WPM had US$694.1m in cash on its balance sheet and no debt outstanding under its US$2bn revolving credit facility. Including a modest US$5.7m in lease liabilities, it, therefore, had US$688.4m in net cash after generating US$254.3m in operating cash flow, disbursing US$31.2m in investing activities and paying out an additional US$70.0m in dividends.
Exhibit 17: WPM cash, net cash and operating cash flow, by quarter, Q420–Q224
(US$m) |
Q420 |
Q121 |
Q221 |
Q321 |
Q421 |
Q122 |
Q222 |
Q322 |
Q422 |
Q123 |
Q223 |
Q323 |
Q423 |
Q124 |
Q224 |
Q324 |
Cash/(debt) |
192.7 |
191.2 |
235.4 |
372.5 |
226.0 |
376.2 |
448.6 |
494.6 |
696.1 |
799.7 |
828.8 |
833.9 |
546.5 |
306.1 |
540.2 |
694.1 |
Net cash/(debt) |
6.0 |
187.7 |
232.1 |
369.4 |
223.2 |
373.5 |
446.2 |
492.5 |
694.1 |
797.9 |
822.3 |
827.7 |
540.3 |
300.2 |
534.5 |
688.4 |
Operating cash flow |
208.0 |
232.2 |
216.3 |
201.3 |
195.3 |
210.5 |
206.4 |
154.5 |
172.0 |
135.1 |
202.4 |
171.1 |
242.2 |
219.4 |
234.4 |
254.3 |
Source: Wheaton Precious Metals, Edison Investment Research
In addition, WPM had long-term investments, in the form of equity share holdings and warrant holdings, in listed companies in the sum of US$103.1m as at end-September (cf US$88.1m as at end June), equivalent to US$0.23/share.
For FY23, WPM generated US$750.8m from operating activities, before consuming US$646.6m in investing activities and paying out US$265.1m in dividends. In FY24, we estimate that it will generate US$1,021.2m from operating activities (cf US$1,024.3m previously), before consuming a net US$572.9m in net investing activities (cf US$648.1m previously) and paying out an increased US$281.1m in forecast dividends under the influence of its new, progressive dividend policy. However, readers should note that the timing of PMPA payments is uncertain and, inasmuch as investments are advanced or delayed, it is possible that WPM could register either a larger or smaller net cash position on its balance sheet by the year end than that forecast. However, all other things being equal, in the absence of any major new asset acquisitions (notwithstanding its recently announced PMPAs with Koné and Fenix), we do not expect WPM to require recourse to its debt facilities in the foreseeable future.
Exhibit 18: Financial summary
$000s |
|
2020 |
2021 |
2022 |
2023 |
2024e |
2025e |
2026e |
|
Year end 31 December |
IFRS |
IFRS |
IFRS |
IFRS |
IFRS |
IFRS |
IFRS |
||
PROFIT & LOSS |
|||||||||
Revenue |
|
|
1,096,224 |
1,201,665 |
1,065,053 |
1,016,045 |
1,308,618 |
1,320,228 |
1,560,462 |
Cost of Sales |
(266,763) |
(287,947) |
(267,621) |
(228,171) |
(237,384) |
(293,840) |
(339,331) |
||
Gross Profit |
829,461 |
913,718 |
797,432 |
787,874 |
1,071,235 |
1,026,389 |
1,221,131 |
||
EBITDA |
|
|
763,763 |
852,733 |
735,245 |
719,704 |
1,002,409 |
957,563 |
1,152,306 |
Operating profit (before amort. and excepts.) |
|
|
519,874 |
597,940 |
503,293 |
505,270 |
751,891 |
649,720 |
790,265 |
Intangible Amortisation |
0 |
0 |
0 |
0 |
0 |
0 |
0 |
||
Exceptionals |
4,469 |
162,806 |
164,214 |
4,593 |
(1,113) |
0 |
0 |
||
Other |
387 |
190 |
7,680 |
33,658 |
27,215 |
0 |
0 |
||
Operating Profit |
524,730 |
760,936 |
675,187 |
543,521 |
777,993 |
649,720 |
790,265 |
||
Net Interest |
(16,715) |
(5,817) |
(5,586) |
(5,510) |
(5,523) |
1,293 |
1,212 |
||
Profit Before Tax (norm) |
|
|
503,546 |
592,313 |
505,387 |
533,418 |
773,583 |
651,013 |
791,478 |
Profit Before Tax (FRS 3) |
|
|
508,015 |
755,119 |
669,601 |
538,011 |
772,470 |
651,013 |
791,478 |
Tax |
(211) |
(234) |
(475) |
(367) |
(116,064) |
(92,744) |
(111,084) |
||
Profit After Tax (norm) |
503,335 |
592,079 |
504,912 |
533,051 |
657,519 |
558,269 |
680,394 |
||
Profit After Tax (FRS 3) |
507,804 |
754,885 |
669,126 |
537,644 |
656,406 |
558,269 |
680,394 |
||
Average Number of Shares Outstanding (m) |
448.7 |
450.1 |
451.6 |
452.8 |
453.5 |
453.6 |
453.6 |
||
EPS - normalised (c) |
|
|
112 |
132 |
112 |
118 |
145 |
123 |
150 |
EPS - normalised and fully diluted (c) |
|
|
112 |
131 |
112 |
118 |
145 |
123 |
150 |
EPS - (IFRS) (c) |
|
|
113 |
168 |
148 |
119 |
145 |
123 |
150 |
Dividend per share (c) |
42 |
57 |
60 |
60 |
62 |
65 |
67 |
||
Gross Margin (%) |
75.7 |
76.0 |
74.9 |
77.5 |
81.9 |
77.7 |
78.3 |
||
EBITDA Margin (%) |
69.7 |
71.0 |
69.0 |
70.8 |
76.6 |
72.5 |
73.8 |
||
Operating Margin (before GW and except.) (%) |
47.4 |
49.8 |
47.3 |
49.7 |
57.5 |
49.2 |
50.6 |
||
BALANCE SHEET |
|||||||||
Fixed Assets |
|
|
5,755,441 |
6,046,427 |
6,039,813 |
6,463,774 |
6,786,249 |
7,191,837 |
7,690,728 |
Intangible Assets |
5,521,632 |
5,940,538 |
5,753,111 |
6,169,534 |
6,488,048 |
6,893,636 |
7,392,527 |
||
Tangible Assets |
33,931 |
44,412 |
30,607 |
47,562 |
48,351 |
48,351 |
48,351 |
||
Investments |
199,878 |
61,477 |
256,095 |
246,678 |
249,850 |
249,850 |
249,850 |
||
Current Assets |
|
|
201,831 |
249,724 |
720,093 |
567,411 |
745,852 |
701,085 |
569,440 |
Stocks |
3,265 |
12,102 |
13,817 |
10,806 |
14,540 |
14,669 |
17,338 |
||
Debtors |
5,883 |
11,577 |
10,187 |
10,078 |
7,171 |
7,234 |
8,550 |
||
Cash |
192,683 |
226,045 |
696,089 |
546,527 |
724,141 |
679,182 |
543,551 |
||
Other |
0 |
0 |
0 |
0 |
0 |
0 |
0 |
||
Current Liabilities |
|
|
(31,169) |
(29,691) |
(30,717) |
(26,075) |
(23,998) |
(26,705) |
(28,886) |
Creditors |
(30,396) |
(28,878) |
(29,899) |
(25,471) |
(23,394) |
(26,101) |
(28,282) |
||
Short-term borrowings |
(773) |
(813) |
(818) |
(604) |
(604) |
(604) |
(604) |
||
Long-term liabilities |
|
|
(211,532) |
(16,343) |
(11,514) |
(19,594) |
(135,068) |
(227,812) |
(216,089) |
Long-term borrowings |
(197,864) |
(2,060) |
(1,152) |
(5,625) |
(5,035) |
(5,035) |
(5,035) |
||
Other long-term liabilities |
(13,668) |
(14,283) |
(10,362) |
(13,969) |
(130,033) |
(222,777) |
(211,054) |
||
Net Assets |
|
|
5,714,571 |
6,250,117 |
6,717,675 |
6,985,516 |
7,373,034 |
7,638,405 |
8,015,192 |
CASH FLOW |
|||||||||
Operating Cash Flow |
|
|
779,156 |
845,832 |
737,821 |
725,548 |
1,027,902 |
960,077 |
1,150,501 |
Net Interest |
(13,763) |
(187) |
6,227 |
33,770 |
(5,523) |
1,293 |
1,212 |
||
Tax |
49 |
(279) |
(171) |
(6,192) |
0 |
0 |
(122,806) |
||
Capex |
149,648 |
(404,437) |
(44,750) |
(648,963) |
(574,174) |
(713,432) |
(860,932) |
||
Acquisitions/disposals |
0 |
0 |
0 |
0 |
0 |
0 |
0 |
||
Financing |
22,396 |
7,992 |
10,171 |
12,934 |
12,064 |
0 |
0 |
||
Dividends |
(167,212) |
(218,052) |
(237,097) |
(265,109) |
(281,140) |
(292,898) |
(303,607) |
||
Net Cash Flow |
770,274 |
230,869 |
472,201 |
(148,012) |
179,129 |
(44,959) |
(135,631) |
||
Opening net debt/(cash) |
|
|
774,766 |
5,954 |
(223,172) |
(694,119) |
(540,298) |
(718,502) |
(673,543) |
HP finance leases initiated |
0 |
0 |
0 |
0 |
0 |
0 |
0 |
||
Other |
(1,462) |
(1,743) |
(1,254) |
(5,809) |
(925) |
0 |
0 |
||
Closing net debt/(cash) |
|
|
5,954 |
(223,172) |
(694,119) |
(540,298) |
(718,502) |
(673,543) |
(537,912) |
Source: Company accounts, Edison Investment Research
|
|
Research: Investment Companies
HgT reported sustained healthy earnings momentum across its major holdings (driven primarily by upselling and cross-selling opportunities), contributing 5pp to its NAV performance in Q324. Its top 20 holdings (which make up 76% of its portfolio value) posted last 12-month sales growth of 20% (of which 12% was organic) and 24% EBITDA growth to end-September 2024, achieved at a 34% average EBITDA margin. The positive earnings impact on NAV was offset by adverse currency movements (sterling strengthening) of 3pp, the main contributor to the 0.9% NAV total return (TR) decline in Q324. The negative fx changes partly reversed post quarter-end. Continued positive momentum across HgT’s portfolio, coupled with stable valuation multiples since the start of the year, brought HgT’s year-to-date NAV TR to 5.5%. This was accompanied by an average 16% uplift to previous carrying value for full and partial realisations completed to date. HgT’s five- and 10-year NAV TR remains strong at 17.6% and 18.4% pa, respectively.