2018 should be a pivotal year in Volt’s history, potentially seeing it migrate from graphite developer to producer. However, a number of milestones remain, including offtake agreements on commercial terms (although term sheets have been signed with certain offtakers), mining licence approval and of course the financing of Bunyu Phase 1. With Bunyu Phase 1 intended to be largely debt funded via a Tanzanian bond issue, and short-term equity funding completed for current work programmes, we see a lower risk of future dilution until Bunyu enters production.
Written by
Volt Resources |
Recharged and ready for a transformational year |
Company update |
Metals & mining |
14 March 2018 |
Share price performance
Business description
Next events
Analysts
Volt Resources is a research client of Edison Investment Research Limited |
|||||||||||||||||||||||||||||||||||||||||||||||
2018 should be a pivotal year in Volt’s history, potentially seeing it migrate from graphite developer to producer. However, a number of milestones remain, including offtake agreements on commercial terms (although term sheets have been signed with certain offtakers), mining licence approval and of course the financing of Bunyu Phase 1. With Bunyu Phase 1 intended to be largely debt funded via a Tanzanian bond issue, and short-term equity funding completed for current work programmes, we see a lower risk of future dilution until Bunyu enters production.
Year end |
Revenue (A$m) |
PBT* |
EPS* |
DPS |
P/E |
Yield |
06/15 |
0.0 |
(0.7) |
(0.2) |
0.0 |
N/A |
N/A |
06/16 |
0.0 |
(3.3) |
(0.4) |
0.0 |
N/A |
N/A |
06/17 |
0.0 |
(2.4) |
(0.3) |
0.0 |
N/A |
N/A |
Note: *PBT and EPS are normalised, excluding amortisation of acquired intangibles, exceptional items and share-based payments.
Exotix Capital – US$40m Tanzanian bond issue
Volt has appointed the Africa-centric financial advisor, Exotix Capital, to arrange the sale in Tanzania of a US$40m corporate bond. Terms and conditions are being worked out currently. While Exotix has exhibited credibility in the successful sale of a US$25m bond related to Swala Oil & Gas, we are unaware of Exotix’s expertise in financing mining projects. For reference and as a guide to Volt’s future bond interest rate charge, Tanzania’s 10-year (December 2017 auction) bond rate is 15.89%. In terms of Volt’s recent financing activity, it has diluted its share capital by 40% ytd, issuing 390.6m new ordinary shares at a slight discount to the then prevailing share price, raising A$8.0m. This funding should easily meet spending requirements until such time as Volt notifies the market of its success in financing Bunyu.
Valuation: Scenario to give an idea of Phase 1 value
While our base case valuation remains on hold as we await the results of the revised PFS (due by end March 2018), we provide an illustrative valuation scenario based on a potential phased development of the Bunyu project. We have reworked our model (which was based on the outdated PFS on Namangale, Bunyu’s previous name) to provide an illustrative view on Bunyu’s Phase 1 value. This incorporates the broad remit for Phase 1 provided by Volt in its 18 May 2017 RNS, detailing a 10-20ktpa operation and capex of US$30m. We assume 20ktpa and costs at the same level as those in the Namangale PFS, sustaining capital at 7% of operating costs, and a capex raised as debt (ie simulating bond issuance) incurring 16% interest. On this basis, using a 10% discount rate to reflect general equity risk and an average US$1,684/t graphite basket price for revenue calculations, we see a potential 7.93 cents/share value for Bunyu Phase 1, rising to 9.60c in 2020 as production and sales reach steady state, under our assumptions. Obviously the completion of a revised FS for Phase 1 will detail costs and capex within an estimated accuracy of ±10% and potentially a different graphite basket price to reflect a mix of end-uses (batteries, expandable and graphene).
Permitting, financing and execution
Readers may consider the well-reported Tanzanian mining stories over 2017 as having a lasting and damaging effect on Tanzania’s appeal to investor’s. However, these risks appear to be restricted to the gold and diamond sectors and we see little transfer of risk to the industrial minerals sector, of which graphite is a constituent. Further, meetings with Tanzania’s new mining minister have taken place and the government appears highly supportive of Bunyu’s development.
To develop Bunyu on an expedited basis, Volt has initiated work programmes tackling a broad swathe of critical path project elements. All project milestones, aside from financing Phase 1, are now funded via the company’s recent equity issue and option exercise (see page 5). The main milestones remaining are:
■
The completion of its fully funded revised Bunyu feasibility study. This will form the basis of its understanding on the costs of developing Bunyu in a phased manner. The first phase of development of a mine will allow for the mining and processing of c 400,000tpa of graphitic ore into c 20ktpa of refined saleable graphite products for use in both industrial and battery applications.
■
To fund Phase 1, Volt has appointed Exotix Capital to complete preparations for a Tanzanian bond issue for US$40m.
■
Bunyu’s Environmental and Social Impact Statement was lodged with the National Environment Management Council, and announced to market on 23 January 2018. This follows Volt’s completion of an Environmental and Social Impact Assessment study.
■
Volt announced on 8 February that it has lodged its mining licence application with the relevant Tanzanian authorities. This application covers both Phase 1 and Phase 2 of the Bunyu Graphite Project.
The very high technical quality of Bunyu graphite
The production of a graphite concentrate via flotation to a 95% total graphitic carbon (TGC) purity level should be relatively simple for the majority of junior graphite developers, especially within a highly controlled laboratory environment. The production of higher-purity graphite beyond 95% has exponentially higher energy requirements for every extra percent in purity gained. The other major factors in determining the quality of graphite concentrates are the inclusion of impurities and the crystalline structure of graphite, which determines, in part, its effectiveness in holding and discharging electrical charge. If the graphite is to be used for fire-retardant applications, another critical factor is how well the graphite expands.
Volt has demonstrated its Bunyu North (which will be the focus of Stage 1 development) graphite to be highly satisfactory in all these areas:
■
Bunyu North product samples have returned excellent first-stage processing results including carbon purity of 99.6% and oxygen content of 0.08%. This test was performed by Volt’s US based offtake partner, NanoGraphene, a producer of graphene products utilising environmentally friendly technology, with no harmful reagents used and only the use of water to produce graphene. Repeatability of this extremely pure carbon sample, at the mine scale, will be critical to understanding the overall costs of processing Bunyu North samples.
■
NanoGraphene also identified Bunyu North graphite as a “highly ordered, defect-free material”. Again, repeatability of this testing is crucial to demonstrating consistency of supply to customers. The majority of de-risking in this area should be satisfied through due diligence processes undertaken as part of commercial offtake agreements being signed.
Offtake partner status
Critical to the development of any project looking to trade products on a bilateral producer-customer basis is the agreement of long-duration offtake contracts with commercial terms. To this end Volt has undertaken numerous marketing efforts, predominantly in Asia, but also across the Americas and Europe. The current status of Volt’s various agreements is given in the following exhibit.
Exhibit 1: Offtake agreement status
Customer |
Indicative offtake quantity (tpa) |
Estimated timeline to secure binding offtake |
NanoGraphene Inc (US) |
1,000 |
Complete |
GEM |
5,000 |
Final product test work and post financing |
Aoyu Graphite Group |
10,000-20,000 |
Product trials – deferred to mid-2018 |
China National Building Materials General Machinery |
10,000-15,000 |
Post financing (estimated Q218) |
Source: Volt Resources
Illustrative Phase 1 valuation
While the company completes its feasibility study on Bunyu (expected in the March quarter of 2018), our previous earnings forecasts and base case valuation remain on hold. However, a number of data points are available (see Volt’s press release dated 18 May 2017) concerning the scope and size of the new, smaller Bunyu Phase 1 operation to be built, as well as resource and cost data that can be taken from the now outdated Namangale (Bunyu’s previous name) 2016 pre-feasibility study. As such, we have made an attempt to generate an illustrative potential valuation for Phase 1 only of Bunyu’s future development.
We use the following valuation assumptions to build our financial model of Phase 1:
■
Keep the average mined TGC grade from the PFS across life-of-mine at 4.4%. This grade is the simple life-of-mine average as per the 2016 Namangale PFS.
■
Ore production is 0.45mtpa to produce 20ktpa of graphite products across all flake sizes. This is the initial scale of Phase 1 output. Initial production of 10ktpa has been assumed for FY19.
■
Ramp up graphite production to 40ktpa by 2023 to simulate the expected growth in global automotive and expandable graphite demand.
■
Reduce the LOM from 22 (in the old PFS) to 10 years for Phase 1 production only.
■
Construction time reduced from two years to less than one year.
■
Keep operating costs aligned with the old PFS.
■
An average Bunyu Phase 1 graphite basket price of US$1,684/t.
■
Set initial Phase 1 capex at a notional US$30m (previously US$203m), reflecting the material reduction in scope from a 170ktpa graphite operation to 20kt of graphite concentrates produced per annum.
Based on the aforementioned data points and inputs, we consider that a purely illustrative value for Bunyu Phase 1 could be worth 7.93 cents in current money terms using a 10% discount rate to reflect general equity risk. This does not assume any build out of Phase 2, or reflect the potentially accretive value project expansion would bring. We look to the release of Volt’s new feasibility study to provide precise costing and the exact scope for Bunyu Phase 1 development, which will allow us to update our base case valuation.
Graphite – state of the (EAF electrode) market
Demand for industrial-grade graphite electrode for use in electric arc furnaces (EAF) has increased markedly as a result of Chinese steel mill closures and graphite mining operations that service the graphite electrode industry. This resulted from China’s government closing unregulated and environmentally damaging industrial mining operations. Coupled with a reduction in steel output (which requires continual turnover of graphite electrodes in electric arc furnaces), these closures have resulted in a marked decrease in EAF electrode supply and increase in non-Chinese graphite electrode prices. This is most clearly evidenced in Graphite India’s Q318 accounts, which manufactures graphite products, including electrodes, and is a public company listed on India’s numerous exchanges under the ticker 509488. Year-on-year (FY16 vs FY17) Graphite India experienced a 160% growth in revenue and a q-o-q (Q218 vs Q318) improvement in EBITDA margin to 57%. Noting that this company feeds into a far lower valued graphite market segment than that in which Volt intends to deliver its products, it is nonetheless impressive that a reduction of graphite electrode exports from China and demand from its steel mills has had such a marked and positive effect on the broader industrial graphite market.
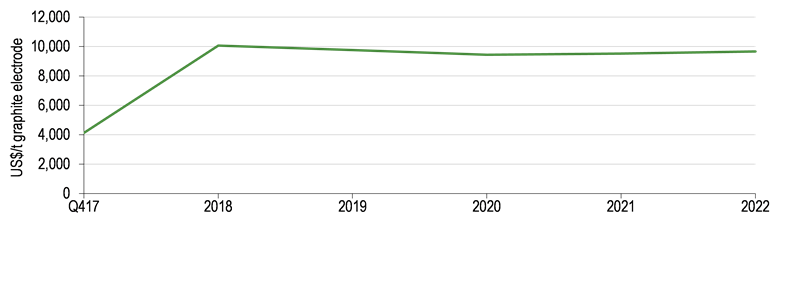
A number of market price forecasters for graphite are in agreement. Metal Bulletin has reported on Turkish steel mills and US graphite electrode producers locking in their 2018 contracts at far higher prices than 2017, as a reflection of customers’ requirements to secure EAF electrode supply. Graphite electrode stocks at steel mills have also been reported (Metal Bulletin) to be short-lived, with stock levels projected to last from anywhere between January and mid-year 2018, again demonstrating a tightness in supply. For instance, Ohio-based GrafTech International has released its contract prices for 2018 through to 2022, a pattern that may indicate GrafTech’s expectation that the market will need to settle at this new price level in the absence of now-closed Chinese production and demand (see Exhibit 2 below).
|
Exhibit 2: GrafTech forward contract pricing for EAF graphite electrodes 2018-22 |
|
|
Source: GrafTech International 8K form filed 22/1/18 |
Syrah’s first battery-grade prices to occur via Q1 CY18 results
While the above speaks to one graphite market segment only and we await sale price data for battery-grade graphite from publicly listed graphite producers (namely Syrah Resources, ASX:SYR). Volt intends to supply the majority of its graphite to the expandable graphite market, but also for batteries. Such information will then start to cement our view of what forward prices for battery-grade graphite are likely to be. With the vagaries of commodity pricing fully at play in a (battery-grade graphite) sector linked to the expected growth in sales of electric vehicles, we consider that the most conservative view of graphite prices currently is the only meaningful way to develop graphite projects into operating mines.
We also note that Syrah (in its Q317 presentation) states “pricing for initial shipments lower than price reporting agencies. As customer base evolves, price discovery to develop further”.
This may not only reflect a relatively loose battery-grade graphite market currently, but also a situation where end-users need to verify purity, quality and, above all else, consistency of supply. It might therefore be prudent to adjust project revenues down in the first one to two years to reflect a period of end-user verification. We note a similar strategy being undertaken at Sirius Minerals in the UK in its marketing of POLY4, a brand new fertiliser product that has been shown to broadly improve crop yields, but which has no direct comparator in the market place. As such, POLY4 requires customers to become comfortable with its use. Sirius therefore intends to sell at discount and then unwind this discount as market acceptance improves.
Financials
On 9 March 2018, Volt announced its interim results to 31 December 2017. We have adjusted our model to reflect this report. At end December Volt had cash on hand of A$4.1m, to which can be added the additional equity raise and option exercise, for total post-balance sheet cash of A$8.0m. Volt’s quarterly cash flow report also indicates projected Q1 CY18 expenditure of A$1.6m, implying that it has enough cash resources for around a further five quarters, or until end CY18. This cash balance should therefore easily satisfy the completion of the Bunyu Phase 1 FS (due in Q2 CY18), as well as the company’s corporate G&A expenditures until such time as it announces the result of its Tanzanian bond issue.
Ytd, Volt has issued a total of 390.6m new ordinary shares at an average price of 2 cents each, raising a total of A$8.0m. 60% of the total issued ordinary shares arose from an in-the-money option exercise when the company’s shares were trading at 3c, or c 50% above the options exercise price.
Overall, ytd the company has incurred 40% share dilution compared to the number of shares outstanding at end 2016.
H1 FY18 interim results
Volt's interim results detail expenditures for H1 FY18 totalling A$2.2m. Included in this A$2.2m figure was A$1.1m in corporate management costs, a 106% increase compared to the same period a year earlier. Other than for H118 share-based payments of A$60k (cf A4$834k in H117), all line items registered moderate increases from a year earlier, commensurate with the company’s increasing activity surrounding development of Bunyu.
In terms of cash flow, Volt invested a total of A$1.5m, predominantly on exploration and evaluation expenditures associated with development of the Bunyu graphite project.
Financing activities provided Volt with total net proceeds of A$7.5m, comprising A$6.7m from the issue of shares (net of issuance costs) and A$1.2m in borrowings. These comprise three main debt arrangements, which, net of interest payments and accruals, total A$1.083m. The first is for A$0.631m and has been raised from various lenders through a convertible loan facility for 12 months, with an interest of 10% per annum, accruing daily. The interest is payable quarterly in arrears in cash or in shares of Volt Resources. Conversion into shares is at the lender’s discretion at any time prior to maturity, at a conversion price of A$0.05 per Volt share.
A second secured loan agreement ran from 20 October 2017 to 28 February 2018 for A$0.440m with an annual interest of 15% pa. A convertible loan of A$25k due to a related party of the chairman, Mr Asimwe Kabunga, was utilised as consideration to exercise a portion of the share options held by the chairman; these were exercised at 2 cents on 8 December 2017 with proceeds of A$482.45k.
As already discussed, Volt is progressing with a planned US$40m Tanzanian bond issue.
Exhibit 3: Financial summary
Accounts: IFRS, Yr end: June, AUD: Thousands |
|
|
2015A |
2016A |
2017A |
Total revenues |
|
|
0 |
0 |
0 |
Cost of sales |
|
|
0 |
0 |
0 |
Gross profit |
|
|
0 |
0 |
0 |
SG&A (expenses) |
|
|
(668) |
(3,351) |
(3,307) |
Other income/(expense) |
|
|
0 |
0 |
0 |
Exceptionals and adjustments |
|
0 |
0 |
0 |
|
Depreciation and amortisation |
|
|
(3) |
0 |
0 |
Reported EBIT |
|
|
(670) |
(3,351) |
(3,307) |
Finance income/(expense) |
|
|
5 |
24 |
52 |
Other income/(expense) |
|
|
0 |
0 |
0 |
Exceptionals and adjustments |
|
0 |
0 |
0 |
|
Reported PBT |
|
|
(666) |
(3,327) |
(3,255) |
Normalised PBT |
|
|
(666) |
(3,327) |
(2,368) |
Income tax expense (includes exceptionals) |
|
|
0 |
0 |
153 |
Profit from discontinued operations (net of tax) |
|
|
0 |
(480) |
0 |
Reported net income |
|
|
(666) |
(3,807) |
(3,102) |
Basic average number of shares, m |
|
|
244 |
583 |
968 |
Basic EPS (cents) |
|
|
(0.3) |
(0.7) |
(0.3) |
Normalised EPS (cents) |
|
|
(0.2) |
(0.4) |
(0.3) |
Balance sheet |
|
|
2015A |
2016A |
2017A |
Property, plant and equipment |
|
|
0 |
0 |
124 |
Goodwill |
|
|
0 |
0 |
0 |
Intangible assets |
|
|
0 |
0 |
0 |
Other non-current assets |
|
|
703 |
10,773 |
16,614 |
Total non-current assets |
|
|
703 |
10,773 |
16,738 |
Cash and equivalents |
|
|
554 |
7,618 |
102 |
Inventories |
|
|
0 |
0 |
0 |
Trade and other receivables |
|
|
17 |
104 |
148 |
Other current assets |
|
|
0 |
104 |
52 |
Total current assets |
|
|
571 |
7,826 |
303 |
Non-current loans and borrowings |
|
|
0 |
0 |
0 |
Other non-current liabilities |
|
|
0 |
0 |
0 |
Total non-current liabilities |
|
|
0 |
0 |
0 |
Trade and other payables |
|
|
160 |
1,108 |
667 |
Current loans and borrowings |
|
|
0 |
0 |
0 |
Other current liabilities |
|
|
0 |
0 |
22 |
Total current liabilities |
|
|
160 |
1,108 |
689 |
Equity attributable to company |
|
|
1,336 |
17,707 |
16,570 |
Non-controlling interest |
|
|
(222) |
(216) |
(218) |
|
|
|
|
|
|
Cash flow statement |
|
|
2015A |
2016A |
2017A |
Profit for the year |
|
|
(666) |
(3,807) |
(1,965) |
Depreciation and amortisation |
|
|
3 |
0 |
0 |
Share based payments |
|
|
216 |
1,774 |
0 |
Other adjustments |
|
|
3 |
554 |
0 |
Movements in working capital |
|
|
91 |
117 |
0 |
Cash from operations (CFO) |
|
|
(353) |
(1,362) |
(1,965) |
Capex |
|
|
(24) |
(3,039) |
(6,400) |
Acquisitions & disposals net |
|
|
(178) |
(364) |
(10) |
Other investing activities |
|
|
0 |
0 |
0 |
Cash used in investing activities (CFIA) |
|
|
(202) |
(3,403) |
(6,410) |
Net proceeds from issue of shares |
|
|
590 |
11,829 |
866 |
Movements in debt |
|
|
0 |
0 |
0 |
Other financing activities |
|
|
0 |
0 |
0 |
Cash from financing activities (CFF) |
|
|
590 |
11,829 |
866 |
Currency translation differences and other |
|
|
0 |
0 |
0 |
Increase/(decrease) in cash and equivalents |
|
|
36 |
7,064 |
(7,509) |
Cash and equivalents at end of period |
|
|
554 |
7,618 |
102 |
Net (debt) cash |
|
|
554 |
7,618 |
102 |
Movement in net (debt) cash over period |
|
|
554 |
7,064 |
(7,516) |
Source: Company accounts, Edison Investment Research
|
|
PharmaMar recently reported financial results for 2017. Sales for the year were down 0.9% to €162.6m compared to 2016. Yondelis sales fell 4.1% to €84.6m, mainly due to pricing erosion in Europe. However, the consumer chemicals division continues to grow and was up 3.4% for the year to €72.0m. Importantly, the company’s Phase III trial testing Zepsyre® in small cell lung cancer (SCLC) patients is around 75% enrolled and expected to be fully enrolled in the middle of this year with data in H119.