Ramba Energy
Written by
Ramba Energy |
Astute deal gives key project a path to production |
Market update |
Oil & gas |
7 December 2015 |
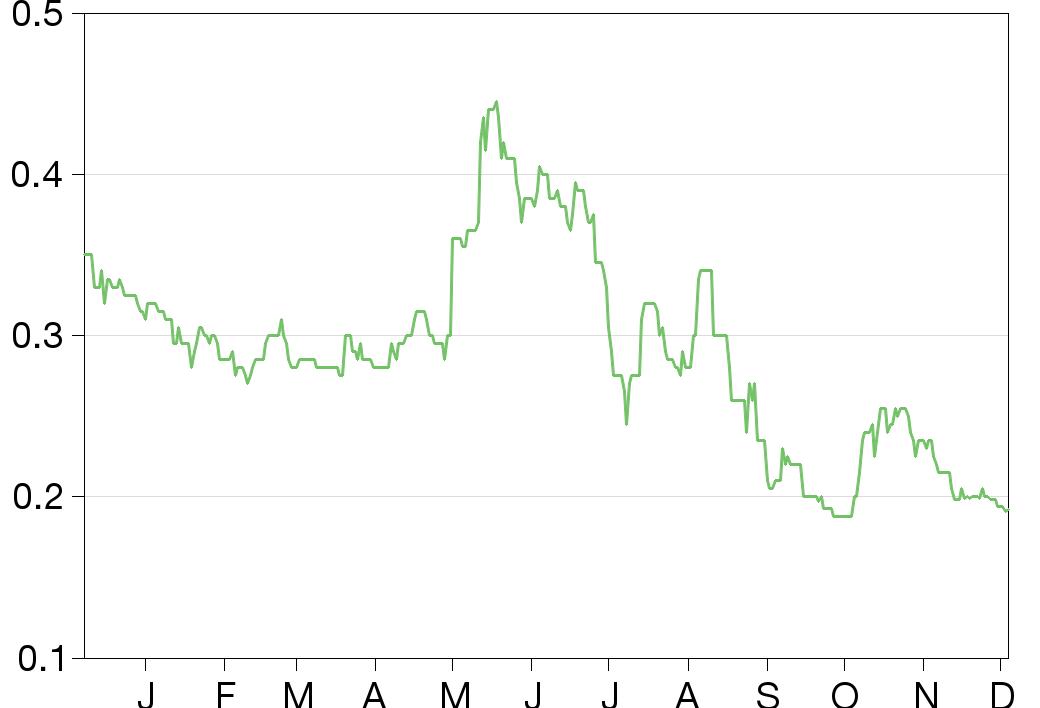
Share price performance
Business description
Next events
Analysts
Ramba Energy is a research client of Edison Investment Research Limited |
|||||||||||||||||||||||||||||||||||||||||||||||||||
Ramba has had considerable success since we initiated coverage in September 2014. After executing two successful share placings amidst a difficult equity market for oil and gas in May 2015, the group received development approval for its key asset; Akatara, in the Lemang block. Consequently, Ramba was able to farm out a 20% working interest in the Lemang block to well-funded Mandala Energy, subject to completion and approval, securing the cash required to fund its part in the development. In addition, the Mandala deal secures financial leverage for Ramba to any reserves growth at Akatara and gives it a financial carry of up to $1.6m per well in up to three exploration wells in the block.
Year |
Revenue |
PBT* |
EPS* |
Net (debt)/ |
Capex |
Debt |
12/13 |
72.9 |
(14.0) |
(4.7) |
2.2 |
(17.1) |
(4.3) |
12/14 |
74.4 |
(12.2) |
(3.3) |
1.2 |
(5.8) |
(2.6) |
12/15e |
66.4 |
(7.4) |
(1.8) |
0.3 |
(14.9) |
(0.0) |
12/16e |
66.4 |
(3.4) |
(0.8) |
(61.3) |
(34.2) |
(61.3) |
Note: *PBT and EPS are normalised, excluding intangible amortisation, exceptional items and share-based payments.
All systems go for core asset, Akatara
Since approval of the fast-track development of the group’s core oil, gas and condensate discovery, Akatara, the field has become a priority for attention. Ramba announced government approval for the development plan at Akatara on 10 August 2015 and subsequently farmed out (subject to approval and completion) a 20% working interest in the Lemang block to fund its share of the project. Although Phase 1 development involves further drilling, the installation of an early production facility has enabled the group to target first production and cash flow by mid-2016, transforming the group’s finances.
Significant near-term upside potential
The 10 additional development wells beyond the three existing exploration wells planned as part of Phase 1 development at Akatara will serve to appraise the areal extent and true productive potential of the field. Based on the results of these wells, the potential exists to increase resource estimates at Akatara towards the high-case estimate of 195mmbbl of oil and 350bcf of gas (as per the CPR carried out by RISC in 2014), a significant uplift from the current mid-case estimate of 52mmbbl oil and 129bcf gas, on which our field economics are based.
Valuation: Increases as project risking reduced
We suggest a combined value for the Ramba group of S$0.62/share. Beneath this we suggest a value of S$0.52/share for Ramba’s key oil & gas assets, with Akatara representing S$0.40/share and exploration prospects Tuba OBI, North REWJ and Wajik representing a further $0.12/share. Our valuation of Akatara reflects the project’s funded status following the farm-out to Mandala. For Richland Logistics, we estimate a value of S$0.05/share, representing 6x our 2015e EBITDA estimate for the division, based on a mid-cycle multiple for the logistics industry.
Investment summary
Company description: First production from Akatara imminent
Ramba is comprised of two businesses: Richland Logistics, a provider of logistics solutions across the Asia Pacific region, and Ramba oil & gas, an exploration and production company holding three licences: Lemang, West Jambi and Jatirarangon in Indonesia. Since 2010 Ramba oil & gas has drilled three successful exploration wells at its Lemang licence. Via these three wells the group has discovered commercial quantities of oil and gas while defining the bulk of the Akatara structure. In August 2015 the Indonesian government approved Ramba’s submitted plan for development of the Akatara field in the Lemang block. Ramba’s development plan is based on installation of an early production facility (EPF) in 2015, with first production and cash flows expected as early as H116. In addition to the discovered Akatara field, Ramba has worked up a further three oil exploration prospects in the Lemang block: Wajiik, Ampyang and Sagon. Beyond Lemang, the group holds a number of material exploration prospects in its West Jambi licence, two of which (Tuba Obi and North REWJ) are funded and scheduled for drilling in the next three months.
Valuation: Key asset supports shares
Our analysis suggests a value for Ramba Energy of S$0.62 per share. For Ramba oil & gas, we estimate a value of S$0.52/share. This valuation incorporates geologic risking for both assets at Lemang and West Jambi, reflecting further appraisal risk in the case of Akatara (Lemang) and exploration risk at Tuba Obi and North REWJ (West Jambi). In addition, the estimated value of both assets has been further discounted under commercial risking reflecting potential delays to the development schedule. For Richland Logistics, where we estimate a value of S$0.05/share, we have applied a multiple of 6x EBITDA (mid-cycle global logistics sector multiple) to the estimated S$4m EBITDA we expect the group to deliver in 2015.
Financials: Akatara development funding secured
Ramba’s balance sheet is well supported, with a net cash balance of S$10.9m at end September 2015. The group bolstered funds with two separate equity issues in 2015 – one for 68m shares and one for 2.9m shares, raising a combined US$21.24m in fresh equity (pre-deal fees and expenses). In addition, the September 2015 farm-out, where a 20% working interest in core asset, Akatara, was sold to the Mandala group, incurred an initial cash payment of US$15m to Ramba. The deal has potential to be worth a further US$87.6m to Ramba, whereby Mandala makes payments beyond the initial $15m contingent on reserves upgrades and exploration success (US$68m for additional booked 2P oil reserves, a US$10m 2P booked gas reserves bonus, a US$4.8m commercial discovery bonus and $1.6m financial carry for each of up to three exploration wells). In additional funding the group holds a mezzanine debt facility of US$10m, which is debt provided by an investment fund secured against initial oil production from the Akatara field. This mezzanine facility remains undrawn. Given that development of Akatara-Selong is to be phased, with development drilling scheduled to take place post the installation of the EPF and production start, we anticipate the group will be able to fund its 31% working interest (post farm-out) in Akatara from field cash flows. Hence we view the capital raised from the share issue and the farm-out to Mandala as sufficient to fund the initial project requirements.
Sensitivities: Akatara at early stages of definition
The bulk of our valuation for the Ramba group (S$0.62/share) is in its oil and gas discovery, Akatara (S$0.40share). Given that the nature of the reservoir at Akatara is thin bed stacked channel sands currently defined by just three wells, we highlight the risk of the mid-case prospective resources (52mmbbl and 129bcf) used as the basis for economic assessment in this report to be materially higher or lower than this estimate.
Company description: Oil & gas dominates
Ramba Energy comprises two main business units: Richland Logistics, a provider of logistics solutions across the Asia Pacific region, including warehousing, terminal handling and project logistics; and Ramba oil & gas, an E&P company based solely in Indonesia, with three onshore licences, Lemang (31% WI, post-approval and completion of farm-out), West Jambi (100% WI) and Jatirarangon (70% WI).
Ramba Energy, focused on upstream in Indonesia
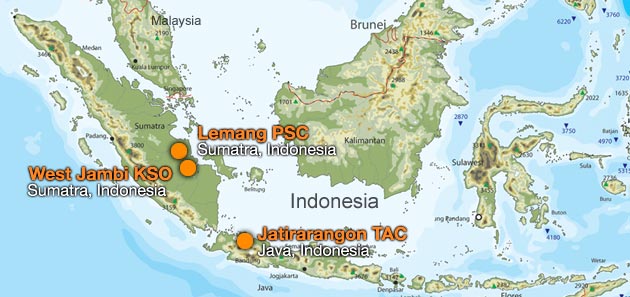
Ramba oil & gas consists of three key licences, as shown in Exhibit 1. All three are located in Indonesia: Jatirarangon (70% WI), West Jambi (100% WI) and Lemang (31% WI, post-approval and completion of farm-out). Key assets in these licences are a mature production asset at Jatirarangon, a development asset in the Lemang block (Akatara) and a high number of pure exploration prospects at West Jambi.
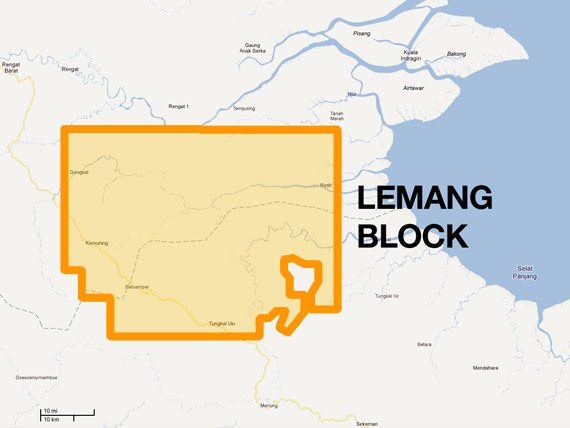
The immediate focus of the company’s attention is the development of the Akatara field. Akatara is the group’s core asset and is located in the Lemang block (shown in Exhibit 2). Ramba announced that it had received approval for its fast-track development plan at Akatara on 10 August 2015 and subsequently farmed out a 20% working interest (subject to approval and completion) in the field to fund its part of the field’s development. The development plan approved in August involves drilling a further 10 wells at Akatara, although with the installation of an early production facility connected to the three worked-over discovery wells, the group expects to be in production by H116, enabling the bulk of development to be funded from the resultant cash flow. Of note is the Akatara field’s $50m (gross) cost recovery pool, representing exploration spend on the asset thus far.
|
Exhibit 1: Indonesia, upstream focus |
Exhibit 2: Lemang block, key discovery, Akatara |
|
|
|
Source: Ramba Energy |
|
Exhibit 1: Indonesia, upstream focus |
|
|
Source: Ramba Energy |
|
Exhibit 2: Lemang block, key discovery, Akatara |
|
|
Source: Ramba Energy |
Core asset Akatara: A quick recap of the history
The Akatara field was discovered by Ramba oil & gas in 2012 after the group drilled three successful wells: Akatara-1, Akatara-2 and Selong-1. The three wells separately discovered oil, gas and condensate. Individual test rates from the three wells are shown in Exhibit 3; the combined flow rate from the three wells reached 9,522boe/d. Individually, the wells demonstrated a significant degree of variability. As a channel sand reservoir, the variable output is likely driven by intercepted sand thickness and localised connectivity. Of note is the high oil production observed from the Akatara-2 well, where it intersected three producible horizons.
Exhibit 3: Akatara well test summary
Date |
Well name |
Gas (mmscf/d) |
Oil (b/d) |
Boe/d |
December 2012 |
Selong-1 |
16.8 |
790 |
3,853 |
May 2013 |
Akatara-1 |
11.0 |
380 |
2,385 |
February 2014 |
Akatara-2 |
5.4 |
2,300 |
3,284 |
Total |
|
33.2 |
3,470 |
9,522 |
Source: Ramba Energy
The crude oil produced at Akatara exhibited a wide range of gas-oil ratios (GOR) varying from 785 to 6,300scf/bbl at Akatara-2, which accounts for the varying gas production rates observed from each well. The Akatara reservoir itself has shown to be highly producible, exhibiting high porosity and permeability, with the drainage radius of some wells being as much as 1.5km, as observed in testing. This high deliverability is a marked commercial benefit for Akatara in reducing the number of development wells, and hence development capex, ultimately required to fully exploit the field. This is reflected in the development plan approved by the Indonesian government, key components of which are described below.
Fast-track development plan approved for Akatara, first production 2016
Based on the success of the three exploration wells shown in Exhibit 3, the government of Indonesia mandated that Ramba move from an exploration phase to development of the Akatara structure. The fast-track development plan for Akatara received government approval in August 2015. As part of working up a development plan for Akatara, Ramba commissioned a new CPR covering all three of its Indonesian blocks; this was carried out by RISC in April 2014. As part of this study, RISC assessed mid-case prospective recoverable resources at Akatara of 52mmbbl of oil and 129bcf of gas.
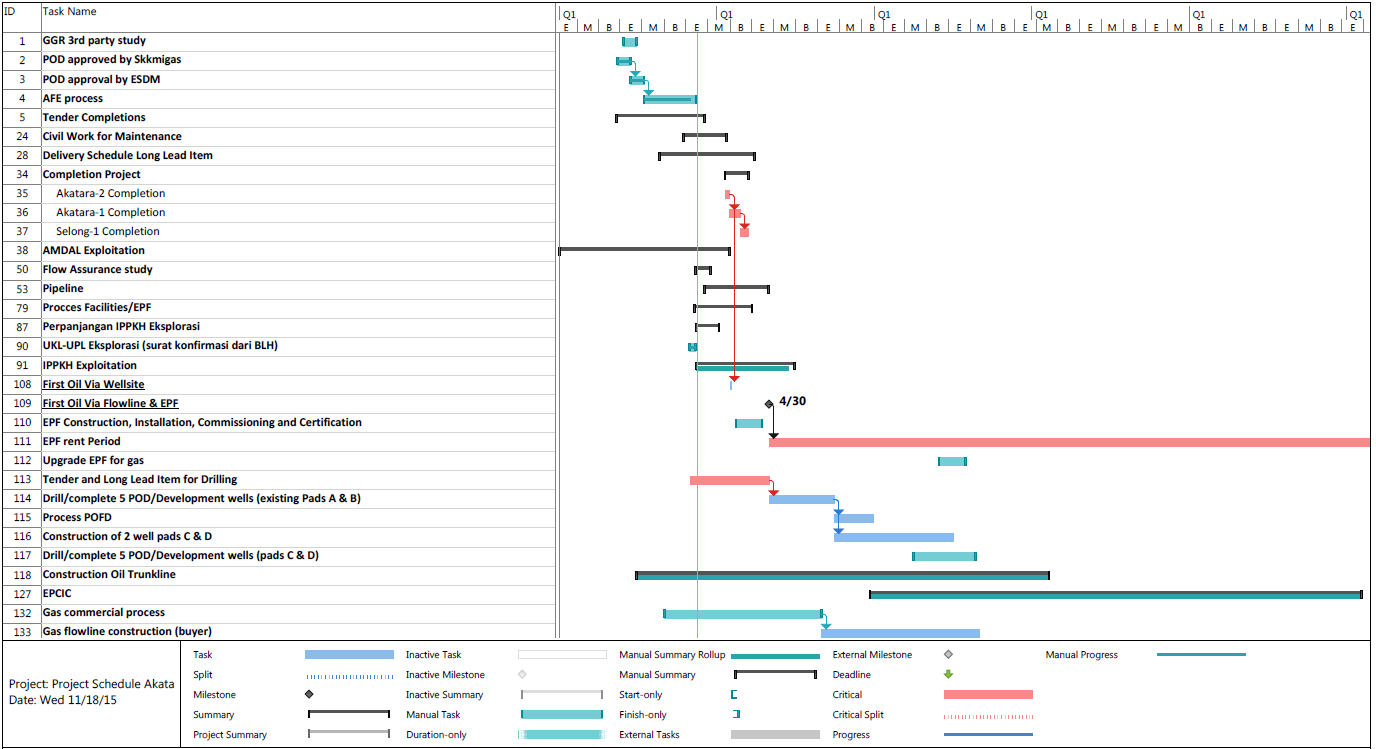
Akatara development plan, key elements of Phase 1 development
■
Workover of three existing discovery wells.
■
Drill eight additional development wells.
■
Drill two injection wells used for pressure maintenance.
■
Installation of an early production facility (EPF); unit to be rented for four years.
■
Crude oil export via trucking to SPU Tempino (140km away/c 54 trucks at plateau).
■
Four well pads to be established: A (four wells), B (four wells), C (three wells), D (two wells).
■
Associated gas is to be used as engine fuel initially. Non-associated gas will be produced from two dedicated development wells, to be drilled in 2016, with an estimated 4.1mmcf/d plateau rate to be maintained for nine years.
|
Exhibit 4: Akatara field development schedule |
|
|
Source: Ramba Energy |
Beyond the initial fast-track development (Phase 1) shown in Exhibit 4 above, Ramba is to undertake a field performance study (timeline shown in Exhibit 4) aimed at determining the key required components of a permanent development (Phase 2). Priorities of the field performance study are the permanent facility design and optimisation of the transportation scenario. During Phase 1 an estimated 54 trucks will be required to transport the crude production 140km from the Lemang block to the receipt terminal at SPU Tempino. The company anticipates that in Phase 2 there is potential for a cheaper export route than via trucking to Tempino, such as pipeline export to a closer terminal depending on the fields’ ultimate production potential.
Phased development at Akatara is the right move considering reserves uncertainty
In our view, Ramba’s development of Akatara via a phased development schedule is well advised. Despite the three exploration wells having been drilled in the field so far, the Akatara field still has a wide range of possible reserves: 7.2mmbbl (P90 oil only) to 195mmbl (P10 oil only). This is due to the irregular location, distribution and connectivity of the reservoirs that comprise the structure.
Given this compartmentalisation, irregular reservoir distribution and limited number of wells, it is accepted that the structure would benefit from further appraisal. In our view, the eight further development wells and two injection wells, planned as part of the approved Phase 1 development, will serve to appraise the areal extent and true productive potential of the Akatara field. Based on the results of these wells, we highlight the potential to increase estimated resources at Akatara towards the high-case estimate of 195mmbbl of oil and 350bcf of gas, from the current mid-case estimate of 52mmbbl oil and 129bcf gas on which our field economics are based.
Ramba and Eastwin’s farm-out to Mandala secures funding for both parties
On 4 October Ramba announced it had reached an agreement with Mandala to farm out a 35% working interest jointly with its partner in Lemang, Eastwin Global Investments. Mandala is a South-East Asia-focused oil and gas exploration and production company backed by leading global investment firm KKR. Mandala is led by an executive management team of three highly experienced, technically based co-founders with more than 75 years of combined experience in oil and gas operations who have spent the majority of their careers in South-East Asia. KKR partnered with Mandala in early 2015 to bring complementary technical and financial capability to regional independent and national operators across the exploration, development and production spectrum to drive portfolio growth and maximise asset potential.
As part of the farm-out agreed with Mandala, Ramba will pass on a 35% working interest in the Lemang block, 20% from its own holding and 15% to be passed on following acquisition from partner, Eastwin (Sugih). Post-transaction, working interests in the Lemang block will be as follows: Ramba 31%, Eastwin (Sugih) 34% and new entrant Mandala 35%. Key parameters of the deal (based on 20% farm-out) are as follows:
■
$15m Initial cash payment, including a $5m advance;
■
payment in respect of Ramba’s incurred costs between the agreement date and completion;
■
reserves bonuses of up to $68m based on estimated 2P recoverable volumes;
■
natural gas reserve bonuses of $10m based on 2P recoverable volumes;
■
commercial discovery bonus of US$4.8m; and
■
a $1.6m financial carry in each of up to three wells in the Lemang block.
The farm-out deal is beneficial for Ramba and Eastwin (Sugih), which receives the same terms for the 15% working interest it is selling to Mandala as Ramba.
Lemang exploration; Wajik to be targeted in 2017, Ampyang & Sagon to follow in 2018
As part of the farm-out deal with Mandala, Ramba will be carried for up to $1.6m per well for its share in up to three exploration wells in the Lemang block, beyond appraisal to the Akatara field. Of the 10 exploration prospects at Lemang outlined by DeGolyer and MacNaughton (D&M) in the 2011 CPR, Ramba has selected the Wajik prospect as the next target to be drilled following full appraisal and development at Akatara. Currently the group expects to drill the Wajik prospect by 2017, with two further exploration wells to be drilled in 2018. Targets for the 2018 wells are yet to be finalised from the potential list, highlighted in Exhibit 5 below, although we would expect Ampyang and Sagon to take priority as they represent oil targets.
Exhibit 5: D&M 2011 CPR, Lemang prospectivity as assessed in 2011
No. |
Prospect |
Prospective hydrocarbon |
Mean estimate (mmbbl) |
High estimate (mmbbl) |
GCoS % |
1 |
Wajik |
Oil |
323 |
583 |
27 |
2 |
Ampyang |
Oil |
34 |
60 |
26 |
3 |
Sagon |
Oil |
6 |
10 |
16 |
Prospective hydrocarbon |
Mean estimate (bcf) |
High estimate (bcf) |
GCoS % |
||
4 |
Arem Arem |
Gas |
86 |
193 |
20 |
5 |
SMD-1 |
Gas |
239 |
539 |
17 |
6 |
CMP-1 |
Gas |
22 |
39 |
17 |
7 |
Ampyang |
Gas |
73 |
130 |
23 |
8 |
Sagon |
Gas |
34 |
59 |
11 |
9 |
Wajik |
Gas |
15 |
30 |
15 |
Source: DeGolyer and MacNaughton
D&M CPR highlights the significant potential at Wajik
In a follow up to D&M’s analysis in 2011, RISC carried out a further CPR on behalf of Ramba in 2014, analysing the Wajik prospect in detail. The group assessed three prospective horizons at Wajik: UTAF, LTAF and GUF as offering a combined 98mmbbl of prospective resource potential.
Exhibit 6: Wajik exploration prospect, RISC CPR highlights three potential horizons
STOIIP (mmbbl) |
Resources (mmbbl) |
Trap |
Reservoir |
Seal |
Source |
GCoS |
|
UTAF |
107 |
23.7 |
70 |
80 |
30 |
75 |
13% |
LTAF |
148 |
33.0 |
70 |
80 |
30 |
75 |
13% |
GUF |
185 |
41.0 |
70 |
80 |
65 |
65 |
24% |
Total |
440 |
97.7 |
Source: RISC April 2014 CPR
The key reservoir issues affecting Akatara are also thought to be present in Wajik, ie the main reservoirs, the UTAF and LTAF and further reservoir Gumai (GUF), are expected to be thin stacked sand sections with uncertain connectivity. However, as a distinct positive – unlike Akatara – all three reservoirs at Wajik are assessed as prospective for oil.
West Jambi: Tuba discovery and North REWJ prospects to be drilled within six to nine months
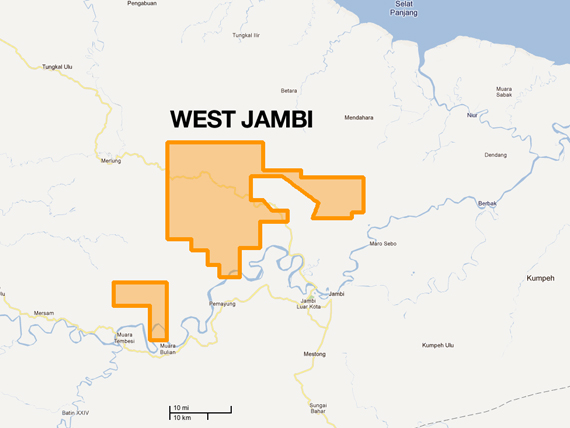
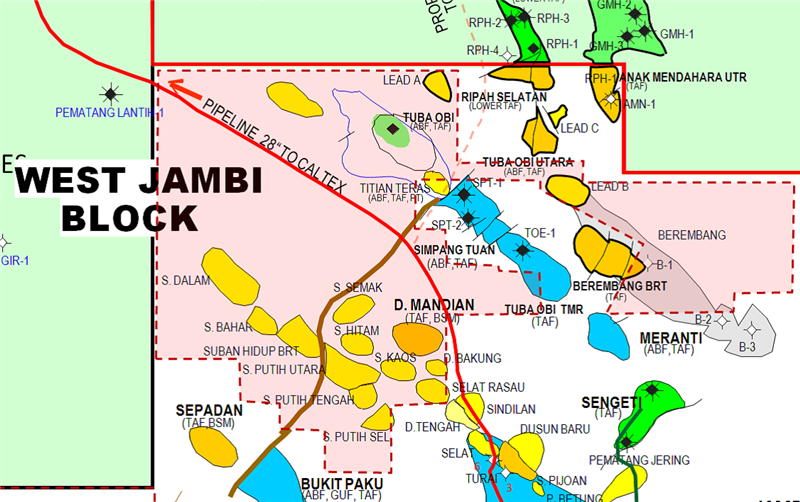
Ramba holds 100% of the West Jambi block located in the north of the Sumatra basin. The company signed a Kontrak Kerjasama Operasi (KSO) with the Indonesian government in June 2011 giving it the right to explore for and produce hydrocarbons in the licence for the next 20 years. As shown in Exhibit 7, the block is divided into two areas: the north-eastern block, containing the Tuba Obi oil field, together with a number of prospects and leads, and the south-western block, containing several leads that have yet to be assessed. As interpreted by Ramba, the block is considered to contain two main prospective formations, the Air Benakat Formation (ABF) prospective for oil and the Talang Akar Formation (TAF) prospective for gas. Based on management guidance, we expect Ramba to drill two exploration wells in the block over the coming three months, one in Q415 and one in early Q116.
|
Exhibit 7: West Jambi location map |
Exhibit 8: West Jambi, Tuba Obi field plus prospects |
|
|
|
Source: Ramba Energy |
|
Exhibit 7: West Jambi location map |
|
|
Source: Ramba Energy |
|
Exhibit 8: West Jambi, Tuba Obi field plus prospects |
|
|
Source: Ramba Energy |
Tuba Obi – priority exploration given discovery status
The Tuba Obi oilfield is an existing discovery lying to the north of the West Jambi block, which was first drilled back in the 1940s. Given Tuba Obi never reached commercial production, the field represents a priority target for Ramba, containing estimated recoverable resources of 7.9mmbbl and negligible exploration risk. We expect one of the two wells will target Tuba Obi.
Exhibit 9: Tuba Obi oilfield, proven structure
Case |
P90 |
P50 |
P10 |
STOIIP (mmbbl) |
18.0 |
54.4 |
119 |
Recovery factor (%) |
10 |
15 |
20 |
Reserves oil (mmbbl) |
2.4 |
7.9 |
18.5 |
Source: RISC April 2014 CPR
Our understanding is that the company is in receipt of a number of historic well logs relating to the Tuba Obi field and is using them to hone its approach in developing the field and particularly in placing the first well. In terms of prospectivity, we understand these well logs confirm oil and gas as present in the ABF and TAF horizons respectively.
REWJ and North REWJ, material prospects in a strong target list
Of the prospects and leads assessed by RISC, REWJ ABF/TAF and North REWJ ABF/TAF stand out as priority targets given their relative resource potential (highlighted in the top four rows of Exhibit 10). We expect the second of the two wells to be drilled at West Jambi in the coming six months will target the prospect, North REWJ. Exhibit 10 shows all nine prospects worked up in the West Jambi block. In total, the list represents 22.1mmbbl and 459bcf of prospective resource potential; hence the block represents a significant long-term exploration hub for the group.
Exhibit 10: West Jambi prospects
Prospects |
STOIIP |
GIIP |
Recovery factor |
Prospective recoverable |
GCoS |
||
(mmbbl) |
(bcf) |
||||||
REWJ ABF |
17.5 |
x |
15 |
2.6 |
x |
36% |
|
REWJ TAF |
x |
165 |
70 |
x |
113 |
32% |
|
North REWJ-ABF |
92.90 |
x |
15 |
13.6 |
x |
22% |
|
North REWJ-TAF |
x |
187.0 |
85 |
x |
129 |
28% |
|
ESE REWJ-ABF |
28.4 |
x |
15 |
4.1 |
x |
23% |
|
ESE REWJ-TAF |
x |
94.6 |
70 |
x |
66 |
23% |
|
S REWJ-1 - ABF |
12.6 |
x |
15 |
1.8 |
x |
7% |
|
REWJ TAF |
x |
165 |
70 |
x |
113 |
32% |
|
SE REWJ-TAF |
x |
55.2 |
70% |
x |
38 |
24% |
|
Total |
22.1 |
459 |
|||||
Source: RISC CPR, April 2014
Ramba estimates each of the three wells at West Jambi will cost around US$2-2.5m. It expects to have completed at least two of these wells by early 2016 (Tuba Obi and North REWJ). Should these wells prove successful we anticipate rapid commercialisation given the existing infrastructure surrounding the West Jambi block.
Richland Logistics: Revenue and margin improvement
Richland’s main business is the provision of transportation and warehousing solutions. Specific services include customised end-to-end logistics planning, with specialisation in transportation and distribution management, warehousing, airport terminal handling, container haulage, bulk liquid transportation and project logistics. The group employs around 1,000 people, operates a transport fleet of 500 trucks and trailers and manages more than 1,250,000 square feet of warehousing capacity to deliver more than 2.1m tonnes of cargo per year. Since acquisition, management has been successful in diversifying Richland, both geographically and operationally, as the group now generates close to 38% of revenue from the Indonesian market, while offering services in new business areas such as chemical transportation, warehouse leasing and drilling rig mobilisation.
Recent performance has been strong, with the group winning two major new contracts in 2014: a three-year VMI contract with multinational information technology company Hewlett-Packard where RichLand is responsible for managing its inbound supply for production parts, and a three-year contract with SingTel, one of the largest mobile operators in Singapore, where Richland is responsible for managing its warehouse operations for fibre optic cable. The financial performance of Richland reflects these contract awards. The group achieved its fifth consecutive year of revenue growth in 2014, booking S$68.4m of revenues for the full year, a 3.8% improvement on 2013. Ramba’s long-term outlook for Richland targets continued growth in revenue to more than S$100m, mainly through acquisition. We expect the resultant increase in scale and efficiency to deliver an improvement in profitability; this is reflected in our 2016 estimates, where we expect the group to achieve S$4m in EBITDA.
Management
Mr David Aditya Soeryadjaya (CEO): appointed in 2007, Mr Soeryadjaya is a qualified accountant with a degree in accounting from the University of Southern California. Before joining Ramba, David worked for Ernst & Young in New York. Previously, he founded a real estate and mortgage brokerage company that was acquired by a major real estate brokerage.
Mr Lee Seck Hwee (CFO): appointed in 2008, Mr Lee is a chartered accountant and holds a master of applied finance from Macquarie University in Australia. He has 25 years of finance experience, which includes serving as head of finance at the group level of SMOE, Sembcorp Engineers & Constructors, Trans Eurokars and Beloit Asia Pacific.
Mr Daniel Jol (commercial director): appointed in 2008, Mr Jol has a BSc degree in civil engineering from Purdue University, Indiana and an MBA from the University of Singapore. He is responsible for the group’s strategic direction in both logistics and oil and gas, in addition to driving M&A activity, fund-raising and budget preparation.
Mr Colin Moran (logistics director): appointed in 2010, Mr Moran holds qualifications in leadership and supply chain management and has 25 years’ experience in the logistics and supply chain industry gained in Australia, Indonesia, Singapore and across the Asia Pacific region.
Bambang Satya Murti (head of exploration): appointed in 2009, Mr Murti has a degree in geology from Gadjah Mada University, Indonesia and is a geoscientist with more than 20 years’ experience in the petroleum industry. He has worked for ConocoPhillips, and Halliburton.
Sutikno Yudi (technical expert): appointed in 2007, Mr Yudi holds a Master’s degree in petroleum engineering from Tulsa University and has 30 years’ experience in the Indonesian oil and gas industry. He has worked for Asamera Oil, Gulf Resources and ConocoPhillips.
Sensitivities
Ramba oil & gas is exposed to the normal geological and technical risks inherent in oil and gas exploration. Apart from these, we highlight the following as major risks:
■
Funding risk: Ramba currently holds a material cash balance following two equity raises in 2015 and a farm-out deal. However, full development of the Akatara field will largely depend on early-stage cash flows once the field has commenced production. If these were to be interrupted, the project would require funding from another source, either equity issue or a further farm-out of the group’s 31% working interest.
■
Reservoir risk: given that the nature of the reservoir at Akatara is thin bed stacked channel sands varying in size and connectivity, there is potential for the prospective resources contained at Akatara to be materially higher or lower than the mid-case resource estimate used as the basis for economic evaluation in this report.
■
Counterparty risk: Ramba’s partners in the Lemang block, Sugih Energy and Mandala, hold the remaining 69% interest in the block. Of the two partners, Sugih commands a balance sheet as modest as Ramba’s, hence we highlight the risk of ‘partner drag’ for Ramba in development of the Akatara field, contained in the Lemang block.
Valuation: Farm-out eliminates commercial risking
We value Ramba Energy using an asset-by-asset NAV derived from detailed DCF modelling. Our valuation includes an assessment of the Akatara field under development (Lemang block) and exploration prospects in both the Lemang and West Jambi licences.
Since Ramba has achieved POD approval and subsequently financed its working interest in the project, having farmed out a 20% working interest to Mandala (subject to approval), we reduce our commercial risking of the project from 65% to 85%. This reflects our view that the development of the Akatara field will almost certainly go ahead given the government’s backing of Ramba’s planned development scenario and the absence of any partner drag (Eastwin sold a 15% working interest in Lemang to Mandala on the same terms as Ramba). We retain our geological risking for the project of 85%, which reflects the variable results from the three exploration wells drilled so far and the requirement for further appraisal drilling to determine the ultimate resource potential of the field. Combining these elements takes our overall risking of the project to 72%.
Exhibit 11: Ramba Energy valuation summary
Asset |
Country |
Diluted WI |
CoS |
Gross |
Net |
NPV/boe |
Value |
Risked |
Net (debt)/cash |
100% |
100% |
11 |
0.03 |
||||
SG&A |
100% |
100% |
-7 |
-0.02 |
||||
Mandala Farm-In cash payment |
100% |
100% |
15 |
0.03 |
||||
Richland Logistics |
100% |
100% |
24 |
0.05 |
||||
Appraisal/development |
||||||||
Akatara |
Indonesia |
31% |
72% |
76.5 |
23.7 |
6.0 |
149 |
0.40 |
Core NAV |
|
|
|
|
|
|
177 |
0.50 |
Exploration |
||||||||
Tuba OBI / North REWJ |
Indonesia |
100% |
18% |
38.0 |
38.0 |
2.8 |
19 |
0.05 |
Wajik |
Indonesia |
31% |
14% |
97.7 |
30.3 |
6.0 |
25 |
0.07 |
Exploration NAV |
|
|
|
|
|
|
43 |
0.12 |
RENAV |
|
|
|
|
|
|
221 |
0.62 |
Source: Edison Investment Research
For exploration, we ascribe a value to both prospects to be drilled in the West Jambi block – Tuba Obi and North REWJ – as those wells are scheduled for drilling within the next 6-9 months. We also ascribe a value to the Wajik prospect in the Lemang block as this well is to be drilled in 2017, and so falls within our two-year window for exploration prospects to be included in our valuation.
Financials, equity raise and farm-out bolsters cash
At end September 2015 Ramba held cash of S$10.9m, which remains from two equity raises in 2015 where the group raised US$21.24m (pre-fees), but does not include an initial cash payment of US$15m due from Mandala as part of its farm-in agreement for a 20% working interest in the Akatara field.
In terms of financing development of the Akatara field, the group’s plan to develop the field in two distinct phases, hence combining it with the full cost recovery shelter available from previous exploration wells (US$50m), should allow it to fund its portion of the field’s development cost from future cash flows from the field itself. Beyond the current cash position (S$10.9m at end September 2015) and the initial cash payment due from Mandala (US$15m), the group holds an undrawn debt facility of US$10m, which is an offtake facility provided by an investment fund and secured against initial oil production from the Akatara field. For the exploration wells planned by the group over the coming 24 months – two West Jambi and one Lemang, the group plans to fund its share from cash flow from Akatara and cash held.
Exhibit 12: Financial summary
|
|
S$'000s |
2010 |
2011 |
2012 |
2013 |
2014 |
2015e |
2016e |
Dec |
|
|
IFRS |
IFRS |
IFRS |
IFRS |
IFRS |
IFRS |
IFRS |
PROFIT & LOSS |
|||||||||
Revenue |
|
|
47,092 |
64,515 |
71,566 |
72,872 |
74,408 |
66,391 |
66,391 |
Cost of Sales |
(23,687) |
(35,458) |
(42,250) |
(44,364) |
(43,386) |
(34,840) |
(34,921) |
||
Gross Profit |
23,405 |
29,057 |
29,316 |
28,508 |
31,022 |
31,551 |
31,470 |
||
EBITDA |
|
|
2,894 |
(5,631) |
(458) |
(10,080) |
(8,290) |
(4,791) |
4,028 |
Operating Profit (before amort. and except.) |
61 |
(8,635) |
(4,427) |
(13,316) |
(11,323) |
(7,243) |
(3,199) |
||
Intangible Amortisation |
0 |
0 |
0 |
0 |
0 |
0 |
0 |
||
Exceptionals |
0 |
0 |
0 |
0 |
0 |
0 |
0 |
||
Other |
0 |
0 |
0 |
0 |
0 |
0 |
0 |
||
Operating Profit |
61 |
(8,635) |
(4,427) |
(13,316) |
(11,323) |
(7,243) |
(3,199) |
||
Net Interest |
(428) |
(489) |
(535) |
(696) |
(845) |
(190) |
(190) |
||
Profit Before Tax (norm) |
|
|
(367) |
(9,124) |
(4,962) |
(14,012) |
(12,168) |
(7,433) |
(3,389) |
Profit Before Tax (FRS 3) |
|
|
(367) |
(9,124) |
(4,962) |
(14,012) |
(12,168) |
(7,433) |
(3,389) |
Tax |
(729) |
(1,382) |
(2,502) |
(1,655) |
(204) |
(446) |
(446) |
||
Profit After Tax (norm) |
(1,096) |
(10,506) |
(7,464) |
(15,667) |
(12,372) |
(7,879) |
(3,835) |
||
Profit After Tax (FRS 3) |
(1,096) |
(10,506) |
(7,464) |
(15,667) |
(12,372) |
(7,879) |
(3,835) |
||
Average Number of Shares Outstanding (m) |
189.9 |
226.7 |
291.8 |
336.6 |
370.1 |
446.7 |
468.3 |
||
EPS - normalised (cents) |
|
|
(0.6) |
(4.6) |
(2.6) |
(4.7) |
(3.3) |
(1.8) |
(0.8) |
EPS - normalised and fully diluted (cents) |
(0.6) |
(4.6) |
(2.6) |
(4.7) |
(3.3) |
(1.8) |
(0.8) |
||
EPS - (IFRS) (cents) |
|
|
(0.6) |
(4.6) |
(2.6) |
(4.7) |
(3.3) |
(1.8) |
(0.8) |
Dividend per share (cents) |
0.0 |
0.0 |
0.0 |
0.0 |
0.0 |
0.0 |
0.0 |
||
8 |
|||||||||
Gross Margin (%) |
49.7 |
45.0 |
41.0 |
39.1 |
41.7 |
47.5 |
47.4 |
||
EBITDA Margin (%) |
6.1 |
-8.7 |
-0.6 |
-13.8 |
-11.1 |
-7.2 |
6.1 |
||
Operating Margin (before GW and except.) (%) |
0.1 |
-13.4 |
-6.2 |
-18.3 |
-15.2 |
-10.9 |
-4.8 |
||
BALANCE SHEET |
|||||||||
Fixed Assets |
|
|
42,445 |
48,204 |
62,453 |
80,893 |
88,685 |
121,834 |
148,802 |
Intangible Assets |
18,708 |
25,676 |
23,564 |
27,009 |
27,773 |
81,357 |
115,553 |
||
Tangible Assets |
9,020 |
7,988 |
11,819 |
9,702 |
6,485 |
8,601 |
1,374 |
||
Investments |
14,717 |
14,540 |
27,070 |
44,182 |
54,427 |
31,875 |
31,875 |
||
Current Assets |
|
|
31,293 |
41,528 |
29,653 |
26,115 |
26,040 |
22,280 |
21,961 |
Stocks |
40 |
203 |
84 |
121 |
180 |
203 |
203 |
||
Debtors |
18,093 |
24,584 |
23,013 |
18,553 |
20,496 |
20,601 |
20,601 |
||
Cash |
8,546 |
12,800 |
5,252 |
6,483 |
3,790 |
319 |
0 |
||
Other |
4,614 |
3,941 |
1,304 |
958 |
1,574 |
1,157 |
1,157 |
||
Current Liabilities |
|
|
(14,207) |
(22,916) |
(28,635) |
(34,801) |
(34,709) |
(30,419) |
(30,419) |
Creditors |
(11,782) |
(20,491) |
(26,523) |
(30,491) |
(32,076) |
(30,419) |
(30,419) |
||
Short term borrowings |
(2,425) |
(2,425) |
(2,112) |
(4,310) |
(2,633) |
0 |
0 |
||
Long Term Liabilities |
|
|
(9,817) |
(7,982) |
(12,618) |
(13,547) |
(14,090) |
(14,004) |
(75,306) |
Long term borrowings |
(5,322) |
(2,798) |
(685) |
0 |
0 |
0 |
(61,302) |
||
Other long term liabilities |
(4,495) |
(5,184) |
(11,933) |
(13,547) |
(14,090) |
(14,004) |
(14,004) |
||
Net Assets |
|
|
49,714 |
58,834 |
50,853 |
58,660 |
65,926 |
99,691 |
65,038 |
CASH FLOW |
|||||||||
Operating Cash Flow |
|
|
(822) |
1,286 |
4,209 |
(1,113) |
(7,340) |
(5,738) |
(27,426) |
Net Interest |
0 |
0 |
0 |
0 |
0 |
0 |
0 |
||
Tax |
0 |
0 |
0 |
0 |
0 |
0 |
0 |
||
Capex |
(16,696) |
(13,906) |
(8,610) |
(17,125) |
(5,792) |
(14,860) |
(34,196) |
||
Acquisitions/disposals |
0 |
0 |
0 |
0 |
0 |
0 |
0 |
||
Financing |
14,584 |
20,108 |
(1,529) |
18,021 |
14,950 |
20,128 |
0 |
||
Dividends |
0 |
0 |
0 |
0 |
0 |
0 |
0 |
||
Net Cash Flow |
(2,934) |
7,488 |
(5,930) |
(217) |
1,818 |
(470) |
(61,621) |
||
Opening net debt/(cash) |
|
|
0 |
(799) |
(7,577) |
(2,455) |
(2,173) |
(1,157) |
(319) |
HP finance leases initiated |
0 |
0 |
0 |
0 |
0 |
0 |
0 |
||
Other |
3,733 |
(710) |
808 |
(65) |
(2,834) |
(368) |
0 |
||
Closing net debt/(cash) |
|
|
(799) |
(7,577) |
(2,455) |
(2,173) |
(1,157) |
(319) |
61,302 |
Source: Company accounts, Edison Investment Research
|
|||||||||||||||||||||||||||||||||||||||||||||||
|