Focus on penetrating the 250m+ unit pa display market
Nanoco is the leading commercial supplier of cadmium-free quantum dots (CFQD), nanoscale particles that emit light when energised, with the colour of the light emitted being determined by the size of the particle. Quantum dots have potential in a number of different applications and Nanoco has development initiatives in medical imaging, lighting, solar cell and displays. The core focus, however, is on the display market, where quantum dots are being used to enhance the picture quality in higher-end televisions and computer displays, initially through using a film coated in red and green QDs (circa 1g per m² of film or 55-inch television) to convert the blue-weighted LED back light into pure white light. Future evolutions are under development to use QDs to enhance the LCD filter and eventually to use QD LEDs to create the picture and light source. Market analysts’ forecasts for QD adoption in display vary, but at the mid-point, QD TV shipments are forecast to grow from c 5m in 2017 to nearly 50m by 2020, which we estimate equates to a market opportunity for QD materials of $550m by 2020.
Hybrid model, expanding coverage of the display supply chain
Nanoco Group operates a hybrid IP licensing and material supply model. Its two licensees, Dow Chemical and Merck, are both well-established suppliers into the display marketplace and will pay Nanoco a low double-digit percentage royalty of value of their product sold. Enabled by significant gains in production efficiency at its Runcorn manufacturing facility, Nanoco is now able to produce and sell materials for volume manufacture as well as for development purposes. The company has established a materials supply partnership with Wah Hong, a leading Taiwanese supplier of films to primarily Chinese/Taiwanese manufacturers. Nanoco has demonstrated televisions from three brands, Hisense, TCL and TPV Philips, using Wah Hong/Nanoco film and discussions are ongoing with a further six. We do not have visibility on pricing, but we expect Nanoco to receive circa $38/m2 (1m2 is roughly the area of a 60” TV) at a 60% gross margin initially. The contribution per m2 from licensees is considerably lower; we estimate $1.9/m2 initially, but licensees are likely better placed to secure the very high-volume orders from tier one brands.
On the cusp of volume sales, earnings should scale quickly
Following a long gestation period, Nanoco is on the cusp of commercialisation. Market analysts are forecasting strong uptake of QD TVs and cadmium free is expected to dominate volumes. Dow is now moving closer to volume orders and is, we believe, still well placed to secure a position as second source supplier to Samsung. Merck could start contributing in FY18. We estimate that it will be FY19 before all of these partners contribute a full year of ramped volume production, but with costs recently trimmed and expected to remain relatively fixed after that, margins and profits should scale quickly once overheads are offset.
In our base case scenario, Nanoco expands product market share to 4% and licensees attain 23% market share by 2019 in which case EBITDA margins expand to 42%. In Exhibit 1 we show three alternative scenarios for FY19: 1) in which Nanoco’s licensees succeed in taking significant (50%) share of the QD TV market; 2) in which Nanoco gains robust market share (8%) with its own material; and 3) where combined market share remains below 25%. In all bar the third scenario, Nanoco generates strong profits and margins. The company will consume some working capital as volumes ramp, but with high gross margins and modest capex requirements, the model should be strongly cash generative once it does so. The company had net cash of £8.3m on the balance at the end of H117, which we forecast dropping to £3.4m by end July 2018. Cash burn depends heavily on the rate and timing of the ramp in volume shipments, meaning that one cannot rule out the possibility of dilution to strengthen the balance sheet.
Year end 30 July |
Base case |
|
1) Bull royalty |
2) Bull product |
3) Bear |
|
2016 |
2017e |
2018e |
2019e |
|
2019e |
2019e |
2019e |
Royalty volumes (m m2 or 60" TV equiv) |
0.0 |
0.0 |
2.6 |
7.5 |
|
23.4 |
4.6 |
4.6 |
Product volumes (m m2 or 60" TV equiv) |
0.0 |
0.0 |
0.4 |
0.9 |
|
0.9 |
2.6 |
0.7 |
Total revenues (£m) |
0.5 |
1.6 |
16.3 |
32.2 |
|
44.0 |
57.2 |
23.6 |
EBITDA (£m) |
(11.2) |
(9.1) |
1.7 |
13.5 |
|
25.2 |
26.9 |
4.4 |
Margin |
loss |
loss |
loss |
42% |
|
57% |
47% |
19% |
EPS* (p) |
(5.2) |
(4.3) |
0.3 |
4.9 |
|
9.45 |
10.58 |
1.27 |
EV/EBITDA (x) |
loss |
loss |
loss |
4.4 |
|
2.4 |
2.2 |
13.5 |
P/E (x) |
N/A |
N/A |
96.4 |
6.6 |
|
3.3 |
3.0 |
24.5 |
Source: Edison Investment Research. Note:* EPS is shown as normalised and diluted.
We believe that delivery to any of the above scenarios other than the bear case would justify significant share price appreciation. While direct peers do not exist, IP based manufacturing and licensing businesses typically trade at high forward multiples – rarely below the mid-teens. Applying an 18x P/E multiple to our base case forecasts, then discounting back one year by 20% a year, would suggest a 70p fair value on a 12-18 month timescale.
We believe that the key catalysts for the company to grow into this rating, or to price in a more optimistic scenario are: 1) visibility of revenues and expansion of OEM relationships through Wah Hong; 2) progress with licensees in securing OEM customers and moving to production; and 3) adding other customers for material supply.
Looking longer term, successful commercialisation of future generations of QD-based displays – using QDs to enhance the LCD filter and eventually using QD-based LEDs to create both the picture and light source – should drive a sustained multi-phase growth cycle for quantum dots. If Nanoco can maintain a market leadership position in these developments, then higher ratings would be justifiable. Universal Display Corp (OLED US), which is perhaps the closest peer in terms of business model, but focused on OLED rather than QD and a decade ahead of Nanoco in terms of commercialisation, is trading at 64x current year earnings, dropping to 28x on a two-year forward basis.
Nanoco’s financial performance and investment case will be determined by four key factors: the rate of uptake of quantum dots in the display market, Nanoco’s market share, pricing and the revenue mix between royalties and material sales. We have used scenarios to best illustrate a range of potential outcomes, but with estimates made at each level, there is clear scope for the company to perform outside of this range. Near-term visibility is particularly limited with financial performance particularly exposed to the timing of product launches as well as the above factors.
Other sensitivities include intellectual property – quantum dots are a heavily IP protected arena. IP disputes have already taken place and could factor in the future. With over 550 issued and pending patents, this could be an upside or downside driver for Nanoco. In Europe the ban on cadmium’s use in lighting and display is subject to an exception that lasts until July 2017. A consultation is underway on whether to extend this by a further two years, which would strengthen the position of cadmium-based suppliers. However, with Samsung prominently highlighting the cadmium-free nature of its quantum dot televisions, OEMs using cadmium are exposing their brands to negative publicity. In the longer term other factors will come in to play, including Nanoco’s ability to secure a strong market position in second-generation (QD Filter) and third-generation (QDLED) QD televisions and its commercial progress in other applications, such as medical imaging, lighting and solar.
Introduction to quantum dots
Quantum dots (QDs) are very small semiconductor particles – with a diameter of 10-100 atoms – that emit different colours of light when energized, typically by light or electricity with a high degree of efficiency. The wavelength (and hence frequency) of the light emitted is dictated by the size of the particle – the smaller the dot the shorter the wavelength. This makes it possible to produce very pure light (ie with a very narrow band of wavelengths) by energising a solution or material containing quantum dots that are all of a very similar size. Very precisely tuned light can be produced by combining quantum dots of two or three different sizes.
Exhibit 2: Layers of a quantum dot
|
Exhibit 3: Different colours emitted depending on size
|

|
 |
Source: Edison Investment Research, IHS
|
|
Exhibit 2: Layers of a quantum dot
|
|
Source: Edison Investment Research, IHS
|
Exhibit 3: Different colours emitted depending on size
|
|
|
|
These properties mean that Quantum dots can be applied to a number of different applications, including:
■
TV and displays, where they are being used to improve colour gamut (range) and efficiency of displays.
■
Lighting, where quantum dots can be used to tune light for specialist applications (eg horticultural lighting, signage and dermatology) and potentially general lighting in the longer term.
■
Medical imaging, where quantum dots can offer advantages over traditional fluorescent dyes for applications such as cancer detection.
Outside of quantum dots, Nanoco also has a development in thin film solar, using copper indium gallium selenide (CIGS) technology to broaden the range of wavelengths converted to electricity and thus improve the efficiency of thin film solar cells.
This report focuses on the opportunity within TV and display, as it is sizeable and by far the most developed, with Nanoco-based product set to move into volume production in the near future. Each of the other verticals has the potential to generate significant revenues in their own right, but the pathway to commercialisation is not yet clear, and will remain secondary to the overall investment case until clearer commercial milestones are passed.
Better picture, efficiency with little supply chain disruption
Quantum dot technology is an attractive option for the display industry, because it improves the colour range, brightness and efficiency of LCD televisions, while using a similar display architecture, minimising disruption and investment into a well-established supply chain.
We show a simplified breakdown of a quantum dot television in Exhibit 4. An LCD television is very similar, with a backlight unit (BLU) providing the source of light, while the picture is generated by the LCD panel, with thousands of pixels that block or let through a light, which then passes through a red, green and blue pixelated filter to add colour.
The colour range of traditional LCD displays is limited by the LED backlight, which does not provide adequate emission of the red and green portions of the light spectrum. While this issue is partially addressed by using coloured films that block out blue and other unwanted colours, the process is not perfect and energy is wasted in blocking out larger ranges of colour.
In a quantum dot LCD (QDLCD) television, the filter is replaced by a film incorporating quantum dots. These dots are ‘excited’ by light emitted from blue LEDs, transforming some of it into very pure green and red light, while the blue is passed through. As a result, the LCD panel receives a richer white light made up of three narrow bands of red, green and blue, which in turn expands the range or gamut of colour that the display can reproduce.
The amount of quantum dot material used per television is very small – circa 1 gram for a 55” screen (circa 0.83m2). These are contained in a proprietary resin, which enables the quantum dots to be applied while preventing them from degrading through contact with air.
Exhibit 4: Simplified breakdown of a QDLCD display
|

|
Source: Edison Investment Research
|
Expanding coverage of the supply chain
Over the past 12 months, Nanoco has significantly expanded and diversified its coverage of the display supply chain and we expect this process to continue. We show a simplified schematic of the quantum dot display supply chain in Exhibit 5. While Nanoco has developed direct relationships with the television OEMs and panel manufacturers, the company’s direct customers are earlier on in the supply chain – either chemical suppliers or film suppliers, which then supply panel manufacturers, which supply OEMs.
In Dow and Merck we believe that Nanoco has relationships with major chemical companies that can potentially cover a significant proportion of the supply chain. The supply landscape of film and panel manufacturers is fragmented and relatively parochial, with Taiwanese/Chinese, Korean and Japanese suppliers mainly serving their domestic OEMs. Consequently, we believe that Nanoco will likely seek to establish relationships with film manufacturers exposed to the Japanese markets to complement its relationship with Wah Hong.
The company is currently in discussions with nine OEMs in total regarding 14 projects. We expect both a proportion of these to convert into commercial shipment volumes and for the number of projects to expand.
Exhibit 5: The QDLCD supply chain
|

|
Source: Edison Investment Research
|
Dow Chemical – delayed, but still in the game
Nanoco entered into an exclusive partnership/licensing agreement for the display market with Dow Chemical in 2013, but progress was not as rapid as expected, possibly slowed by the merger with Dupont. In 2015 Samsung opted to use Hansol (using Samsung developed IP) as primary supplier of CFQD material for its first generation of QD televisions. In March 2016 the companies negotiated a move to a non-exclusive partnership, giving Nanoco the freedom to pursue alternative routes to the display market in exchange for a lower royalty rate (not disclosed) and ceding rights to earn-out income from Dow. While progress has been slow, Dow remains active in the quantum dot market through its Trevista brand and has invested significantly in building a facility in Cheonan, South Korea, with capacity to produce CFQDs for millions of televisions a year and with room for expansion. With one line ready for production, we understand that Dow has capacity to produce QDs to supply millions of square metres of display screen and could therefore generate greater than $2.5m per annum of royalty for Nanoco before investing in new equipment. Nanoco reports that Dow is making good progress in sampling product, and we believe it is in pole position to be the second source of CFQD material to Samsung and to other OEMs.
Merck – significant penetration of the display market
Following the move to non-exclusive with Dow, Nanoco announced a licensing partnership with Merck in August 2016. In Merck the company has a partner with a significant presence and vested interest in the LCD display market. Merck is the leading supplier of liquid crystals into the LCD display market with an estimated market share of c 60%, meaning that it is strongly in Merck’s interest to stave off any potential threat from OLED (see page 9). Merck is on track with its commercialisation programme and is already producing samples in its Darmstadt plant and has plans to build a volume manufacturing facility that could potentially become operational before year end 2018, with Nanoco supplying the material in the interim.
Wah Hong – first OEMs announced, capacity investment brought forward
Nanoco’s first customer for its CFQD product (dots and resin) is Wah Hong, one of the world's largest manufacturers of optical films and sheets for displays. Wah Hong is based in Taiwan and has a number of facilities across the region and supplies to a range of Asian panel and TV manufacturers. Wah Hong already has facilities to produce CFQD film with little modification and therefore can move to volume production in a short timescale. The company has optimised its equipment for producing films of up to 60” for CFQD film production and has recently moved forward planned investment in a second line, capable of supplying films for screens of up to 100”. This line is expected to be operational before the end of June 2017.
At the Consumer Electronics Show (CES) in January, three manufacturers, Hisense, TCL and TPV Philips, displayed large-screen, ultra-high definition, wide colour gamut quantum dot televisions using Nanoco’s CFQD Fine Color Film, manufactured by Wah Hong. According to Statistica, these manufacturers held a combined 15% of the TV market in 2015, equating to over 30m units shipped. We estimate that Nanoco would generate revenue of £8-9m if it were to capture 1% of these OEMs’ shipments. Discussions are ongoing with a further six OEMs.
Korea manufacturers lead the market, China the rising force
Samsung and LG currently hold a commanding position of the top two spots in TV market share. As previously discussed, we believe that Nanoco through Dow remains in pole position to be second source supplier in the near term, although Merck also has a strong relationship with the market number one. Given LG’s commitment to OLED, we believe that it is unlikely to offer a significant opportunity for Nanoco in the near term. Together the two Korean giants hold around a third of the market in terms of TVs shipped and this figure is greater for higher-end, larger TV sets.
Exhibit 6: TV OEM market share 2015
|

|
|
|
Nevertheless, there is still a significant proportion of the market to go for outside of these two vendors. In particular, it is important to note the rise of the Chinese OEMs and panel manufacturers. Chinese OEMs have taken significant market share from the Japanese brands, and also hold well over 40% market share and now some of the once prominent Western/Japanese brands – such as Philips (by TPV) and Sharp (Hisense).
On the panel building side, Chinese LCD flat panel display makers have been aggressively expanding capacity for a number of years. A June 2016 article by IHS estimated that China would have 28 flat panel display fabs by 2018 with Chinese share of LCD production capacity growing to 29% (vs estimated 22% in 2016) overtaking Taiwan and closing in on Korea (estimated 40% in 2016). The report also states that Chinese players are focusing on larger screens – 50” and above. We believe that this capacity build is likely to support adoption of QDLCD televisions, in that falling LCD costs will widen the price differential between QDLCD and OLED. We believe that the improved image and marketing benefits of QDLCD together with the easy adaption of supply chains should make QDLCD an attractive option for OEMs.
We believe that the relative fragmentation of the supply chain in China should make it more supportive of Nanoco’s material supply business compared to Korea, where we believe that licensees will hold sway. Given the substantially stronger revenue and gross margin Nanoco receives per device, successful penetration of the Chinese supply chain could be a very significant value driver for Nanoco.
QD’s share of the display market set to accelerate
QD’s lower cost gives it the edge over OLED
The principal competitive technology for quantum dots in the high-end, wide colour gamut segment of the television market is OLED (organic light-emitting diode). OLED uses an entirely different architecture, whereby both the light and the image are created by an array of light-emitting diodes (LEDs). In terms of picture quality, the key benefits of OLED over LCD-based technologies (LCD, QDLCD) include better contrast/blacks as diodes are simply not turned on when producing black and a wider viewing angle, as light is not passed through as many filters. QDLCD offers better brightness and better energy efficiency, with current comparable Samsung QD and LG OLED screens rated A+ versus B respectively. In practice, the balance between these properties is a subjective matter and most reviews suggest that image quality is comparable.
Cost of OLED 30% more than QDLED, which costs 20% more than LED
The crucial advantage that QDLCD televisions have over OLED is cost, with OLED TVs costing circa 30% more than quantum dot, which in turn cost c 20% more than LCD. There are two reasons behind this. Firstly, while OLED has gained significant share in smaller devices – smartphones, tablets, computer displays – low yields (due to dead pixels) have been problematic in larger displays. Secondly, because QDLCD TVs use a very similar architecture to LCD, production is able to leverage a well-established supply chain, whereas ramping volume production of OLED TVs would require significant capacity investment. Until recently, LG has been the only supplier of OLED TV panels, which it ships to the likes of Sony and Panasonic. LG is in the process of expanding capacity and plans to invest c US$3bn in OLED manufacturing (across all small, medium and large screen sizes), increasing OLED TV production to c 1.5-1.8m units a year. To put this in context, this capacity would represent less than 1% of global TV shipments. Reports also indicate that Chinese supplier BOE has entered the market and is supplying Skyworth, which could change the price-competitive dynamic. The CES show in January this year saw a significant expansion in the number of OEMs demonstrating OLED televisions – including Sony, Panasonic and Chinese brands such as Konka and Skyworth – although at present it is only LG committing to multiple models using the technology.
Exhibit 7: LCD vs QD LED vs OLED – compared
Attribute |
LCD |
QD LED |
OLED |
Comment |
Image quality |
|
|
|
. |
Contrast |
✓✓✓ |
✓✓✓ |
✓✓✓✓✓ |
OLED can offer pure black through turning pixels off rather than filtering it all out. Some recent reviews suggest the difference is barely perceptible. |
Brightness |
✓✓✓✓ |
✓✓✓✓✓ |
✓✓✓ |
QD screens re-emit light rather than filtering it out. |
Colours |
✓✓✓ |
✓✓✓✓✓ |
✓✓✓✓ |
Both QD and OLED offer precise tunable colours. QD colour gamut higher than OLED. |
Width of viewing angle |
✓✓✓ |
✓✓✓ |
✓✓✓✓✓ |
Use of filters in LCD QD can reduce wide-angle viewing experience. |
Manufacturing |
|
|
|
|
Cost of infrastructure |
$$ |
$$$ |
$$$$ |
A primary benefit of QD is that it uses a very similar architecture and infrastructure to LCD. This reduces cost through enabling existing infrastructure to be leveraged. |
Bill of materials |
$$ |
$$$$ |
$$$ |
OLED can use fewer layers in the screen than LCD or quantum dot, but at present this benefit is significantly outweighed in TVs by low yields and manufacturing infrastructure costs. |
Low yield |
$$ |
$$ |
$$$ |
Low yields are currently an issue for OLED particularly in larger screens. There are initiatives to improve this, such as using inkjet printing to fill in missing pixels. |
Other |
|
|
|
|
Energy efficiency |
✓✓ |
✓✓✓✓ |
✓✓ |
QD screens re-emit light rather than filtering it out. Energy rating of currently available Samsung QD TVs are all A+ vs B for OLED. |
Form factor |
✓✓ |
✓✓ |
✓✓✓ |
OLED can be thinner, flexible and more tightly curved. These advantages are less significant in TVs versus smaller form factors. |
Lifespan |
✓✓✓✓ |
✓✓✓✓ |
✓✓ |
OLED can suffer from screen burn or decay. |
Source: Edison Investment Research
Market analysts expect quantum dot to prevail
While shipments of both OLED and QD are expected to grow strongly, most market observers now believe that the cost and supply chain advantage of QDLCD over OLED will mean that it captures the greater market share for higher-end televisions in the near to medium term. Market analyst IHS expects the total screen area of quantum dot televisions to far exceed that of OLED, although there will be some degree of catch up over time. Cost is likely to be the biggest single variable influencing these uptake rates. If OLED yields can be improved (from the c 50% rate currently), prices will become more competitive and investment in capacity is likely to increase. Equally, reducing prices of QDLCD TVs could accelerate its inclusion in cheaper, higher-volume TV models.
Exhibit 8: QD vs OLED TV forecasts – total surface area
|

|
|
|
It is also worth noting that a scan of reviews for Quantum Dot TVs produces almost entirely positive results – albeit these are dominated by Samsung. While reviews for OLED TVs are also generally positive, from the comparison reviews we have found, Quantum Dot is more often featured as a best buy, with the higher price of OLED typically being the deciding factor.
Future innovations could drive up QD volume per TV
While the uptake cycle of televisions using CFQD film will likely be the primary driver of revenues within our forecast period, Nanoco and its partners are working on enhancements to display technology that could drive up the volume/value of quantum dots per TV.
Exhibit 9: QD display roadmap
|

|
Source: Edison Investment Research
|
Quantum dot LCD filters – the next evolutionary step for TV/QD
One of the next evolutionary steps in development in the display and QD industry is to replace the LCD colour filter with a quantum dot equivalent. This is a film patterned with red, green and blue quantum dots that correspond with those on the LCD screen, enabling it to display different colours according to which pixels are opened. Through using a QD patterned film, the quantum dots in the filter will actually emit the red, green or blue light rather than filtering out the unwanted wavelengths. This promises to bring additional benefits such as improved brightness and a wide viewing angle (as light is emitted from closer to the surface of the screen) to LCD-based televisions, which could make it to market within a two-year timescale. We understand that a significantly higher volume of quantum dots would be required to manufacture QD filter LCD panels and thus uptake of such devices would significantly boost demand. We understand that this technology is of particular interest to Merck, given its incumbent position in the Liquid Crystal Display market, in that uptake of QD Filter should both help defend LCD’s market share vs. OLED and expand the revenue opportunity per device / offset price declines.
QDLED – bringing OLED and QD benefits together, but plenty of hurdles to cross
In the longer term, Samsung and a number of other manufacturers are looking to combine the benefits of LED and QD screen technologies. In a QDLED screen (often also referred to QLED, but Samsung has now trademarked that name) red, green and blue quantum dots will be used as the light emitting diode (as OLEDs are in OLED TVs) rather than to enhance the back light colour. The promise of QDLED is that it will be able to combine the wide colour gamut, brightness and efficiency offered by quantum dots with the high contrast and wide viewing angle from activating LEDs to create the picture. Nanoco has been engaged in QDLED related development for over eight years, but there are many hurdles to cross before QDLED becomes a commercial reality. At the quantum dot level, the challenge is to develop red, green and blue electroluminescent dots (ie activated by charge rather than light) that do not degrade in operational conditions. As we have seen with OLED, there may well also be manufacturing challenges related to creating a new screen architecture. Consequently we do not expect meaningful QDLED shipments before 2020, although from an investment perspective it will be important to track development in this area to gauge the longer-term prospects of the business.
Clarification on terminology: Samsung recently announced its new “QLED” range of televisions at the CES show in January 2017. While precise specifications are not yet available, it does seem as if these are actually still LCD-based, with an innovative LED backlight to improve viewing angle. As Samsung has trademarked the QLED brand, we use QDLED in this document for third-generation QD TVs.
Nanoco looks well placed to take significant share
IP protected, less toxic, more scalable technology
There are two key elements of the company’s IP, which means that Nanoco should be well placed to take significant share of the QD display market (and others eventually). Firstly, the company’s quantum dots do not contain cadmium, a toxic chemical. The use of cadmium is likely to be unacceptable to many consumer electronic brands and may soon be prohibited in Europe and China. Secondly, Nanoco’s molecular seeding process facilitates the manufacture of cadmium-free quantum dots at scale. The company also holds over 550 granted and pending patents covering both core quantum dot IP and applications for their usage, with a further 100 or so pending. The combination of these attributes and the IP the company has covering them has been particularly important in enabling the company to license its technology to Dow and Merck, both major players in the display industry.
Nanoco pioneered the development of cadmium-free quantum dots (CFQD) and has significant IP covering the domain. We believe that it is one of only two or three companies able to produce CFQDs that are performant enough for the display industry – the other being Hansol, which uses IP from Samsung, and potentially Nanosys.
Cadmium is a toxic metal and one of six substances the use of which is restricted by the European Union’s Restrictions on Hazardous Substances (RoHS). It is also restricted by the Chinese equivalent, the Administrative Measure on the Control of Pollution Caused by Electronic Information Products (AMotCoPCbEIP), although this merely requires labelling and a use by date. The US does not have equivalent legislation.
In Europe, cadmium’s use in lighting and display is subject to an exception that lasts until July 2017 and a consultation is underway whether to extend this by a further two years. We are not going to try to predict the outcome of this consultation. Clearly, the better outcome for Nanoco would be if the exception is revoked, but we do not believe it will be an insurmountable setback if it is not.
In particular, Samsung, the clear market leader in display, prominently highlights the fact that its QD televisions do not contain the material in its marketing collateral (Samsung – QD displays): “With the entire family gathered around in the living room, you’ll want to be picky about the materials used in the TV. Thankfully, innovative advances have made possible a TV that comes with no cadmium. It’s eco-friendly technology where you need it the most – in your home.”
Given the prominence of this messaging, OEMs that do use cadmium are potentially exposed. Market analyst IHS estimates that cadmium-free quantum dots will dominate the market, holding circa 80% market share through our forecast period (see Exhibit 10).
Exhibit 10: Cadmium-free vs cadmium device forecasts
|

|
|
|
Molecular seeding – a more easily scalable manufacturing process
Nanoco was founded specifically to commercialise research, dating back to 2004, to solve the problem of manufacturing quantum dots at scale. The company’s proprietary molecular seeding process enables cadmium-free quantum dots to be manufactured to precise scale (and therefore colour) without requiring rapid cooling. This makes it a more simple process to scale manufacture to produce industrial quantities of quantum dots than the alternative high-temperature dual-injection method. We believe that the ease of scaling was a key factor in enabling Nanoco to secure licensing relationships with major chemical manufacturers Dow and Merck.
As Nanoco operates both an IP licensing and material supply model, there are two levels of competition to consider.
IP licensing – Dow and Merck should support a significant market share
At the IP level, in Dow and Merck the company has secured two major chemical suppliers into the display industry, making it well placed to secure a strong market share. We are not aware of anyone else pursuing the same IP licensing model, although Samsung has developed its own cadmium-free methodology, which it has licensed to Hansol, a Korean chemical manufacturer, for captive supply to Samsung. US quantum dot suppliers operate primarily a material supply model but do license quantum dot component designs – such as Nanosys technology to apply quantum dots to film.
Heavily IP protected area – value creation and disputes both possible from IP
This is also a heavily IP protected arena. IP disputes have already taken place and could factor in the future. QD Vision, a US cadmium-based QD supplier, which is subject to litigation by Nanosys, has recently been acquired by Samsung for a reported $70m. The aim of the acquisition was reportedly to support Samsung’s QDLED development activities. Nanoco also recently acquired a group of patents from Eastman Kodak, (which is no longer active in quantum dots) also in connection with the use of quantum dots in electroluminescent QDLED displays.
Hansol and Nanosys are the key material supply competitors
At the quantum dot material supply level, we believe that Hansol and Nanosys are the key competitors to be aware of. These companies will compete with Dow, Merck and Nanoco for their QD materials.
Hansol (014680: KRX, market cap £660m, FY15 revenues of £196m) is currently the primary supplier to Samsung. It uses CFQD technology developed by Samsung and therefore we believe it is likely to be a captive supplier to the electronics giant. The company is reportedly in the process of building a second facility in anticipation of increased demand. Samsung announced its flagship next-generation QD TV, QLED at CES 2017. Despite the brand name, it appears that this architecture is also LCD-based, using a proprietary back lighting technology and a new generation of quantum dots coated in an alloy to improve longevity. We understand from Nanoco’s management that Nanoco has also developed and has IP rights over a similar technology and thus believes that it would be able to supply QDs for this architecture.
Milpitas, California-based Nanosys was the first quantum dot supplier to ship in volume. The company sells cadmium-based and cadmium-light quantum dots (which are compliant with RoHS) used in devices from OEMs such as Hisense, AUD, Visio, Benq, Sharp and the Amazon Kindle Fire HDX, through three film suppliers, 3M (US:MMM) , Hitachi Chemical (4217:JT) and Exciton (300566:CH). Management also states that the company has developed cadmium-free quantum dots, although it is not clear whether these are yet shipping commercially. The company has, we believe the largest quantum dot manufacturing facility, with production capacity to produce over 25 tons of quantum dot concentrate, or enough material for approximately 6m 60” TVs a year. The company is privately held, with Samsung Ventures holding a stake. Management states that the business has generated over $100m in revenue since it started volume shipments in 2013 and expects to grow revenues by 50% in FY17. The company holds 312 patents and licenses specific component designs into the supply chain – for example for Quantum Dot Enhancement Film but not its core quantum dot material technology.
Other companies to keep an eye on
There are a number of other companies developing quantum dots for use across a range of different applications, but at an earlier stage of commercialisation to Nanoco, Hansol and Nanosys. These include Dotz Nano (ASZ: DTZ), an Israel-based, ASX company that is commercialising IP for producing graphene-based quantum dots from coal. Development work is underway across a range of applications including high-volume, lower-cost applications such as detergents/whiteners and anti-counterfeiting, although the company is also in discussions for developing blue quantum dots for the display industry. The company’s first commercial milestone is a marketing agreement with speciality chemicals distributor, Strem Chemicals, which will facilitate sales of product to academic, industrial and government research and development laboratories, as well as commercial businesses for research purposes.US-based Quantum Materials Corp (OTCQB: QTMM) has developed a process for continuous production (rather than batch) of cadmium-free quantum dots. It has recently reported that its joint venture Guanghui Technology Group and Quantum Materials Asia Co has received an RMB150m ($21.8m) investment to build two Quantum Dot production lines and application centres in Beijing and Changde. The company presented heavy metal free Quantum Dot film at CES in January 2017. It claims to be talking to a handful of large, well-established players in the TV supply chain.
Sizing the market opportunity
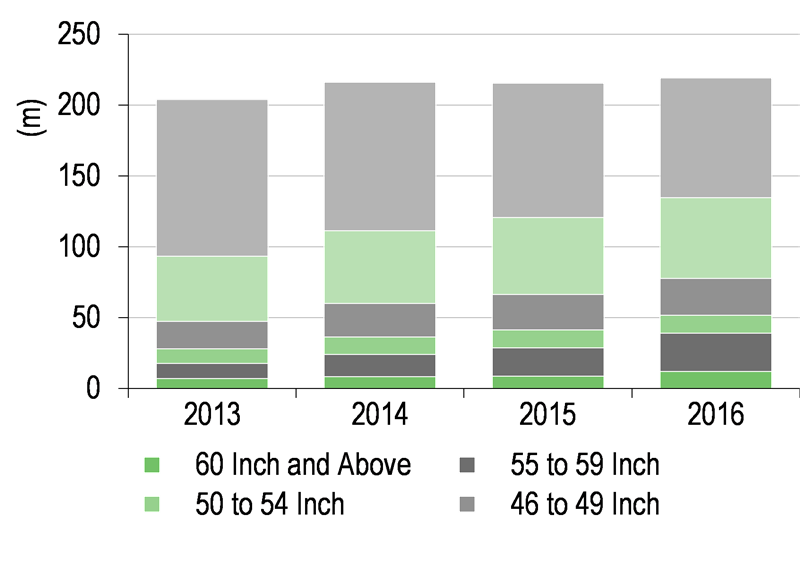
Televisions are expected to account for around 90% of the value of the quantum dot display market over our forecast period, with computer displays the next most important application at c 5%, although we understand that Nanoco has a number of material supply prospects in the computer display market, so the immediate revenue opportunity for Nanoco may be higher than this. While global unit sales of television are expected be around 205m units in 2016, which is broadly flat or down depending on the market analyst, this is due to declining sales of smaller televisions. Sales of medium and larger displays (46” and above) continue to grow. This is important because 1) the adoption of quantum dots will start in high-end, larger televisions and 2) the market for quantum dots is defined by the total screen area covered rather than the number of televisions.
New innovations tend to penetrate the TV market rapidly… once the price is right
While the industry is intensely competitive, it is also driven by relentless innovation. New technology innovations frequently penetrate the market very quickly, albeit driven by ruthless requirements for price/cost reductions. For example, 4K TV shipments have grown from under 1m in 2013 to an estimated 48m in 2016. (Statistica). LED backlight LCD screens achieved c 90% penetration of the TV market (0 to over 200m devices) from a standing start in a six-year period. Further innovations/standards that should drive adoption of QD (and OLED) TVs include 8k, high dynamic range (HDR) and, particularly, wide colour gamut (WCG).
Exhibit 11: Display shipments by size
|
Exhibit 12: Quantum dot penetration by total screen area
|
Relevant to QD Market |

|
Source: Bloomberg Intelligence
|
Source: Edison Investment Research from IHS. and DSCC estimates
|
Exhibit 11: Display shipments by size
|
Relevant to QD Market |
Source: Bloomberg Intelligence
|
Exhibit 12: Quantum dot penetration by total screen area
|
|
Source: Edison Investment Research from IHS. and DSCC estimates
|
QD penetration of the TV market set to accelerate rapidly
We believe that the addressable market for quantum dots in display is best calculated as a function of total screen area.
Market analysts are forecasting rapid growth in QDTV volumes, although forecasts vary significantly. IHS forecasts unit shipments to grow from 6.5m in 2016 to 22m by 2021 – estimates which it has recently nudged upwards with the incremental growth all from cadmium-free QDs (see Exhibit 10). Display Supply Chain Consultants (DSCC) forecasts growth from 4m to 95m in the same period. While this latter figure is enabled by a significant reduction in the cost of QD film, from c$45 per m2 entering FY17 to c$12 per m2, this still equates to a $1.1bn market size for QD film in this timescale. We estimate that the value of quantum dots and resin (ie Nanoco’s addressable market) will account for at least 60% of this, so $600m+. We do not have like-for-like figures for IHS, but reflecting the more conservative volume forecasts, their estimates imply more modest price erosion for QD display components (16% initially trending to 6%).
Useful incremental market – particularly in the early stage of market development
The computer monitor and potentially the high-end notebook market could be a useful additional source of revenue for Nanoco, particularly in the early stages of market development. The company is seeing increasing interest from OEMs looking to use Quantum Dots in high-end monitors targeted at the gaming/creative market – with the advantages of QDs being intense colour and offering reduced motion blur. The computer monitor market is much smaller than the TV market (IHS estimates that monitors/notebooks will account for around 3% of the QD display market between 2017 and 2021). However, discussions with management suggest that due to the smaller run lengths and screen sizes, price per m2 is likely to be considerably higher than for televisions. We also believe that Nanoco has a good opportunity to capture good market share for its direct materials (with substantially higher revenues and gross margin per m2 than for royalties) given the smaller run lengths.
Base case estimate c $550m addressable market for QD product by 2020
Running a range of volume and pricing scenarios based around the above data we estimate that Nanoco’s addressable market for product will be between $217m and $666m by 2020, with $552m our base case.
Exhibit 13: Estimated QD and resin market value – scenarios
$m |
2017e |
2018e |
2019e |
2020e |
Base |
179 |
275 |
440 |
552 |
Bull |
172 |
311 |
549 |
666 |
Bear |
186 |
208 |
215 |
217 |
Source: Edison Investment Research. Note: Calendar years.
All of Nanoco’s revenues to date have been generated from development related streams: licences, milestone payments and QD shipments for development purposes. The company will generate more of these, but the timing is difficult to predict and they are not particularly material to the investment case.
For volume shipments, the company operates a hybrid IP licensing and material manufacture/supply model.
Partner royalties: Success hinges on high volumes through tier one relationships
As with any royalty model, success depends on generating significant volumes of sales across a broad spectrum of end customers. In Dow and Merck we believe that Nanoco has two partners capable of achieving this. Nanoco will receive a low double-digit percentage royalty on QD material sales through its licensing partners, which will drop directly through to gross and operating profit. In our base case we estimate that royalty per m2 will initially be $2.20but eroding by 12% each year. As the royalty is set as a percentage of the total value of product sold, the royalty per m2 could be markedly higher should these partners manufacture QD embedded film rather than QD material.
Material supply: Much higher-value, lower-volume
Nanoco’s Runcorn site was originally built to manufacture development volumes of QD material. However, recent process improvements have increased its capacity more than tenfold, opening up the possibility to supply material directly to film manufacturers, with Wah Hong being the first. The economics for supplying a given square metreage of QD material are considerably stronger than for the royalty equivalent. Nanoco will receive the full value of the material at an estimated gross margin of 60% rather than a double-digit percentage royalty. While the company’s large licensee partners are better placed to capture the highest volume devices with tier one OEMS, given the strong economics, there is still good business to be had supplying material for shorter runs of lower tier brands, especially as pricing will generally be higher for these lower-volume devices.
Manufacturing quantum dots is not expected to be a particularly capital intensive process. The company currently has enough capacity to produce QDs for 350k m2 screen coverage or c $14m (£11m) at our estimated initial pricing of $38/m2. This is consistent with IHS’s estimated cost of $57.8 for the QD film for a 55” television (area 0.83m2) assuming that QD material accounts for c 55% of this value. Management estimates that it can also expand capacity at Runcorn by nearly fourfold to deliver enough CFQDs to supply 2m m2 of quantum dots (ie the amount of quantum dots required to cover a given area of display film) with a mere £2m of capex. We forecast a low double-digit rate of price erosion, similar to our royalty forecasts.
Highly operationally geared model
Opex expected to remain relatively flat
The company has recently instigated a cost-trimming process, which we expect to reduce cash operating expenses (excluding depreciation, amortisation, share-based payments) by c £1m to £10.5m. We estimate R&D expenditure at c £5.5m, offset by government grants of c £300k, central costs of £6.7m, with c £1.2m of depreciation spread across the two.
The EBITDA break-even level will depend on the royalty/product sales mix, but once this is reached, with high gross margins, focused R&D and an indirect sales model, growth should drop strongly through to profit. With a strong product uptake cycle and a high IP model, margins could expand to very high levels. In our base case (see Exhibit 14), EBITDA margins expand to 35% by 2019, whereas in a more positive scenario where Nanoco’s licensees take significant (50%) market share, EBITDA margins expand to 52% in the same timeframe.
Determining a ‘target’ long-term margin profile for the business is very difficult. In reality, we believe that the company is likely to increase investment into the business should margins expand to very high levels to support development in fields such as QDLED and other markets, with medical imaging probably holding the most potential. The utopian vision would be for the company to evolve into a high-margin business with diversified exposure across a number of different verticals, although we often see margins peak in the initial product uptake cycle followed by a period of compression as the first cycle wanes and others take time to develop.
Cash flow and balance sheet
The company had £8.3m net cash and equivalents at end January (plus a £1.9m tax credit to be received in H2), consuming £6.2m over the course of H1. In our base case forecast, we have net cash dipping to £3.4m at year end 2018. We believe that the company has options to further reduce costs or factor receivables to help bridge a short-term gap, but clearly one cannot rule out some interim report, whereby essentially no already contracted revenue is received but no action to further reduce costs is taken, indicates that cash resources would run out in the first quarter of calendar year 2018.
While there will be some working capital build and (relatively modest) capex in the growth phase, the business should generate healthy cash flows as the company moves into profit. Royalty revenues will initially be recognised in the quarter of shipment, but paid quarterly in arrears. This means that the receivables balance will look high as a percentage of royalty revenues during the growth phase, although there are no associated expenditures related to royalty revenues. Once royalty streams become predictable, the company will accrue monthly and adjust to actual on a quarterly basis. Wah Hong’s payment terms are 45 days in arrears and the company pays its consumable suppliers in 45 days.
We model an incremental £2m of capex above maintenance levels (sub £1m) spread across 2018 and 2019 to support capacity expansion at Runcorn.
The company has accumulated £24m of tax losses and therefore we do not expect any significant tax charge over our forecast period.
The company has 14m options with an average exercise price of 48.9p. We progressively include this in our diluted EPS estimates over the course of FY18 and FY19.
On the cusp of volume shipments; real shape should start to emerge from 2019
Forecasting revenues (and even more so earnings) is notoriously difficult at this stage of development due to customer concentration and exposure to the timing at which specific manufacturing programmes commence. Overlaying this is a wide range of potential scenarios as to how the QD display market will develop, market share, pricing and the balance of revenues between royalties and material sales. We have therefore adopted a scenario-based approach, based on varying QD uptake, pricing and Nanoco’s market share for both licensees and its own product. Our scenario assumptions for key market, market share and pricing are detailed in Exhibit 14.
Exhibit 14: Scenario assumptions
Market scenarios |
2016e |
2017e |
2018e |
2019e |
2020e |
|
Nanoco scenarios |
2016e |
2017e |
2018e |
2019e |
2020e |
|
|
|
|
|
|
|
Nanoco share of QD market |
|
|
|
|
|
Total QD TV market (m m2)* |
|
|
|
|
|
|
Licensee |
|
|
|
|
|
Base |
4.03 |
9.19 |
17.45 |
32.61 |
47.14 |
|
Base |
0% |
0% |
15% |
23% |
27% |
Bull |
4.07 |
9.39 |
21.19 |
46.82 |
70.97 |
|
Bull |
0% |
5% |
35% |
50% |
50% |
Bear |
4.00 |
9.00 |
13.70 |
18.40 |
23.30 |
|
Bear |
0% |
0% |
14% |
14% |
14% |
Total QD & resin market value ($m) |
|
|
|
|
|
|
Product |
|
|
|
|
|
Base |
84 |
169 |
281 |
463 |
589 |
|
Base |
0% |
0% |
3% |
4% |
5% |
Bull |
85 |
172 |
311 |
549 |
666 |
|
Bull |
0% |
1% |
4% |
8% |
10% |
Bear |
83 |
165 |
221 |
261 |
291 |
|
Bear |
0% |
0% |
1% |
2% |
2% |
|
|
|
|
|
|
|
Revenue per m2 ($) |
|
|
|
|
|
Currency US$/£ |
1.43 |
1.28 |
1.28 |
1.28 |
1.28 |
|
Licensee |
|
|
|
|
|
|
|
|
|
|
|
|
Base |
2.5 |
2.2 |
1.9 |
1.7 |
1.5 |
|
|
|
|
|
|
|
Bull |
2.5 |
2.4 |
2.1 |
1.9 |
1.6 |
|
|
|
|
|
|
|
Bear |
2.5 |
2.2 |
1.8 |
1.4 |
1.1 |
|
|
|
|
|
|
|
Product |
|
|
|
|
|
|
|
|
|
|
|
|
Base |
45.0 |
38.0 |
35.0 |
30.0 |
27.0 |
|
|
|
|
|
|
|
Bull |
45.0 |
38.0 |
34.6 |
31.5 |
28.6 |
|
|
|
|
|
|
|
Bear |
45.0 |
34.2 |
29.8 |
24.0 |
21.6 |
Source: Edison Investment Research. Note: *Total QD & resin market assumes average value/m2 drops from $18.3 in FY17 to $12.5 in FY20. Nanoco’s royalty rate is estimated at 12% of this value. Market size does not include other devices, eg computer display etc.
Strong growth and healthy profitability in most scenarios
In our base case, we assume that volume product sales and royalties both start in FY18. Estimated FY18 product revenues to Wah Hong and other customers of £10.0m equate to a c 0.37m m2 screen area, while royalty revenues of £4.0m equate to 2.6m m2. Our forecasts assume that Dow and Merck capture 24% of the addressable market by 2019, and Nanoco reaches 4% market share with its own product in this year.
We detail three alternative scenarios in Exhibit 15 and in all bar the bear case the company generates very strong growth in sales and very healthy margins within the 2019 timeframe (the earliest for a full year contribution from all three partners). It is worth noting that we always couple high-volume (royalty or material) assumptions with our most aggressive price erosion assumptions, as price and volume are inextricably linked.
Exhibit 15: Key scenario P&L outcomes
£m |
2016 |
2017e |
2018e |
2019e |
2020e |
Base (base case all metrics) |
Royalty volumes (m m2) |
0.00 |
0.00 |
2.64 |
7.51 |
12.81 |
Product volumes (m m2) |
0.01 |
0.02 |
0.37 |
0.85 |
1.19 |
Royalties |
0.0 |
0.0 |
4.0 |
10.0 |
15.0 |
Product |
0.2 |
0.5 |
10.0 |
20.0 |
25.0 |
Other revenues |
0.3 |
1.1 |
2.3 |
2.2 |
0.7 |
Total revenues |
0.5 |
1.6 |
16.3 |
32.2 |
40.7 |
Gross profit |
0.3 |
1.4 |
12.2 |
24.2 |
30.6 |
EBITDA |
(11.2) |
(9.1) |
1.7 |
13.5 |
18.0 |
Margin |
loss |
loss |
11% |
42% |
44% |
|
High volume licensing (bull case QD uptake, licensee market share, bear case pricing) |
Royalties |
0.0 |
0.8 |
10.2 |
25.8 |
31.2 |
Product |
0.2 |
0.5 |
8.5 |
16.0 |
20.0 |
Total revenues |
0.5 |
2.4 |
21.0 |
44.0 |
51.9 |
Gross profit |
0.3 |
2.1 |
16.7 |
35.9 |
41.8 |
EBITDA |
(11.2) |
(8.4) |
6.2 |
25.2 |
29.2 |
Margin |
loss |
loss |
29% |
57% |
56% |
Strong product uptake (base case QD uptake & licensee revenues, bull case product market share, bear case product pricing) |
Royalties |
0.0 |
0.0 |
3.7 |
6.1 |
7.7 |
Product |
0.1 |
2.5 |
16.2 |
48.9 |
79.5 |
Total revenues |
0.5 |
3.6 |
22.2 |
57.2 |
87.9 |
Gross profit |
0.3 |
2.5 |
15.7 |
37.6 |
56.0 |
EBITDA |
(11.2) |
(8.0) |
5.2 |
26.9 |
43.5 |
Margin |
loss |
loss |
23% |
47% |
49% |
Incumbents retain share (base case QD update, bear case market share for licensee and product, base case pricing) |
Royalties |
0.0 |
0.0 |
3.7 |
6.1 |
7.7 |
Product |
0.0 |
0.2 |
6.8 |
15.3 |
19.9 |
Total revenues |
0.5 |
1.4 |
12.8 |
23.6 |
28.3 |
Gross profit |
0.2 |
1.2 |
9.0 |
15.1 |
17.3 |
EBITDA |
(11.3) |
(9.7) |
(1.8) |
4.3 |
4.7 |
Margin |
loss |
loss |
loss |
18% |
17% |
Source: Edison Investment Research