Last close As at 05/08/2026
—
— 0.00 (0.00%)
Market capitalisation
—
Research: Investment Companies
Qatar Investment Fund
Qatar Investment Fund |
Positive outlook for growth |
Investment trusts |
12 May 2016 |
Share price/discount performance
Three-year cumulative perf. graph
Gearing
Analysts
|
||||||||||||||||||||||||||||||||||||||||||||||||||||||||||||||||||||||||
Qatar Investment Fund (QIF) offers exposure to a country with growing GDP as a result of government policy to diversify away from a reliance on hydrocarbon-derived revenues as well as infrastructure spending ahead of the FIFA 2022 World Cup and population growth. Stocks are selected based on their potential for long-term capital growth, dividend yield and attractive valuations. The majority of the portfolio is comprised of stocks in the Qatar Exchange index, which has a forward P/E multiple below the longer-term average and a dividend yield above 4%. QIF is a dollar-denominated investment trust.
12 months ending |
Total share price return (%) |
Total NAV return (%) |
Qatar Exchange (%) |
MSCI Emerging Markets (%) |
FTSE All- |
30/04/12 |
3.4 |
3.9 |
1.8 |
(12.6) |
(4.7) |
30/04/13 |
3.4 |
4.1 |
(0.3) |
4.0 |
12.8 |
30/04/14 |
42.7 |
44.6 |
46.1 |
(1.8) |
20.0 |
30/04/15 |
3.5 |
3.6 |
(4.0) |
7.8 |
(2.3) |
30/04/16 |
(12.4) |
(16.8) |
(16.2) |
(17.9) |
(10.0) |
Source: Thomson Datastream. Note: US$ total return figures.
Investment strategy: Top down and bottom up
The manager runs a concentrated portfolio of c 20 high growth stocks with attractive dividend yields and reasonable valuations. Up to 15% of the portfolio can be invested in stocks listed on the exchanges of Gulf Cooperation Council (GCC) states outside Qatar. Exposure to GCC states is made on a tactical basis based on relative valuation and growth outlooks. The benchmark is the Qatar Exchange, which comprises the 20 largest and most liquid stocks in the country; however, the fund is run on an active basis and there may be sectors of the market where the manager has zero exposure.
Market outlook: Infrastructure spending driving GDP
In recent years, the Qatari government has been successful in diversifying the economy away from a reliance on hydrocarbon-based growth; at the end of 2015 non-hydrocarbon nominal GDP was 62.6% of total GDP. Growth is led by infrastructure projects ahead of the 2022 FIFA World Cup and an increasing population; the outlook is for above-average growth in the region to continue. In addition, the Qatari stock market is trading below its longer-term average forward P/E multiple and offers an attractive dividend yield. A change in the status of the market by FTSE Russell should lead to a significant amount of passive investment in the country in 2016 and 2017.
Valuation: Modest narrowing of the discount trend
The current share price discount to NAV of 10.2% compares to the range of 0.1% to 19.2% (average of 12.2%) over the past 12 months. This is modestly lower than the averages of the last three and five years (13.4% and 13.7% respectively). The discount is managed via regular share repurchases and tender offers. Although the trust has a focus on capital growth, QIF has a progressive dividend policy; the shares have a current dividend yield of 3.7%.
Qatar Investment Fund is a research client of Edison Investment Research Limited
Exhibit 1: Trust at a glance
Investment objective and fund background |
Recent developments |
||||||||||||||||||||||||||||||||||||||||||||||||||||||||||||||||||||||
QIF aims to deliver capital growth though exposure to the Qatari economy by investing in companies listed on, or soon to be listed on, the Qatar Exchange. 15% of the fund may be invested in companies listed in other GCC countries. QIF is incorporated as a closed-end investment company in the Isle of Man and listed on the main market of the London Stock Exchange. |
■ 22 April 2016: Q116 investment report for three months to 31 March 2016. NAV return before dividends of -1.4% versus benchmark -0.5%. ■ 1 March 2016: Report for six months to 31 December 2015. NAV return before dividends of -16.3% versus benchmark -14.5%. Share price -11.1%. ■ 27 January 2016: Q415 investment report for three months to 31 December 2015. NAV return before dividends of -7.7% versus benchmark -9.0%. |
||||||||||||||||||||||||||||||||||||||||||||||||||||||||||||||||||||||
Forthcoming |
Capital structure |
Fund details |
|||||||||||||||||||||||||||||||||||||||||||||||||||||||||||||||||||||
AGM |
November 2016 |
Ongoing charges |
1.61% |
Group |
Epicure Managers Qatar, |
||||||||||||||||||||||||||||||||||||||||||||||||||||||||||||||||||
Interim results |
May 2016 |
Cash |
3.3% |
Manager |
Jubin Jose |
||||||||||||||||||||||||||||||||||||||||||||||||||||||||||||||||||
Year end |
30 June |
Annual mgmt fee |
1.0% |
Address |
Tamin Street, West Bay, |
||||||||||||||||||||||||||||||||||||||||||||||||||||||||||||||||||
Dividend paid |
February |
Performance fee |
15% of NAV outperformance vs the index – see page 7. |
||||||||||||||||||||||||||||||||||||||||||||||||||||||||||||||||||||
Launch date |
31 July 2007 |
Trust life |
Indefinite |
Phone |
+974 44962 222 |
||||||||||||||||||||||||||||||||||||||||||||||||||||||||||||||||||
Continuation vote |
Discontinuation proposed every third year from 2012. |
Loan facilities |
N/A |
Website |
|||||||||||||||||||||||||||||||||||||||||||||||||||||||||||||||||||
Dividend policy and history |
Share buyback policy and history |
||||||||||||||||||||||||||||||||||||||||||||||||||||||||||||||||||||||
QIF pays one final dividend a year, declared in December and paid in February out of income received from the portfolio. It has a progressive dividend policy. |
The share repurchase policy is described on page 7. Financial years shown (figures exclude tender offers). |
||||||||||||||||||||||||||||||||||||||||||||||||||||||||||||||||||||||
|
|
||||||||||||||||||||||||||||||||||||||||||||||||||||||||||||||||||||||
Shareholder base (as at 5 May) |
Portfolio exposure by market cap (31 March 2016) |
||||||||||||||||||||||||||||||||||||||||||||||||||||||||||||||||||||||
|
|
||||||||||||||||||||||||||||||||||||||||||||||||||||||||||||||||||||||
Top 10 holdings (31 March 2016) |
|||||||||||||||||||||||||||||||||||||||||||||||||||||||||||||||||||||||
|
|||||||||||||||||||||||||||||||||||||||||||||||||||||||||||||||||||||||
Source: Qatar Investment Fund, Edison Investment Research, Bloomberg, Morningstar, Thomson. Note: *N/A where not in March 2015 top 10.
Market outlook: Positive outlook within the region
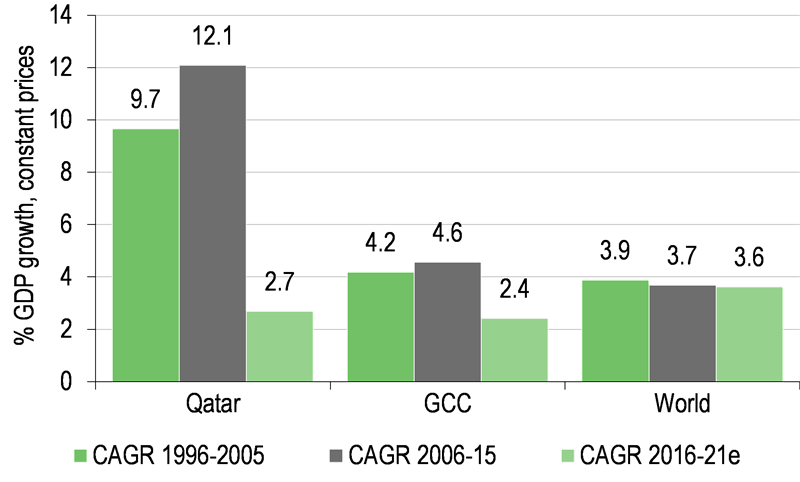
Looking at Exhibit 2 (left hand side), data from the International Monetary Fund (IMF) shows how GDP growth in Qatar has been strong in recent years and is expected to outpace the GCC region as a whole, particularly in 2016 and 2017. Infrastructure spending in Qatar over the next few years is generally anticipated to be around $200bn ahead of the 2022 FIFA World Cup. This is in line with the Qatar National Vision (QNV) 2030, which focuses on transforming the Qatari economy away from its dependence on hydrocarbon production; non-hydrocarbon nominal GDP increased from 41.0% of total GDP in 2011 to 62.6% at the end of 2015. The Qatari Ministry of Development Planning and Statistics has announced that the Qatari population was 2.4 million at the end of 2015, an 8.3% increase over the prior year, which is positive for GDP growth. Although Qatar is expected to run a budget deficit in 2016 for the first time in 15 years, more than 45% of budgeted expenditure is allocated to the infrastructure, health and education sectors and the deficit is expected to be lower in percentage terms versus other GCC states. Qatar remains rated AA, AA2 and AA by S&P, Moody’s and Fitch respectively; S&P has recently reaffirmed Qatar’s rating while downgrading other notable hydrocarbon exporters including Saudi Arabia, Bahrain and Oman.
Although the Qatar stock market has been affected by the fall in the oil price since mid-2014, Exhibit 2 (right hand side), shows that it has fared better than other countries in the region, as well as emerging markets in aggregate. Valuations are not extended; according to Bloomberg, the Qatar Exchange index is trading on a forward P/E c 11.5x; this compares to the three and five year averages of 13.0x and 12.2x respectively. The Qatar Exchange index also has a dividend yield in excess of 4%. For investors wishing to consider the region, a fund invested in stocks in a relatively higher growth country with lower correlation to the oil price may hold appeal.
|
Exhibit 2: GDP and market performances |
|
GDP growth |
Performance of oil price/markets from end-June 2014 to end-March 2016* |
|
|
|
Source: Edison Investment Research, IMF, Bloomberg. Note: *Total return performance in US$ terms. |
|
Fund profile: Investment in large cap, liquid stocks
Qatar Investment Fund (QIF) was incorporated in the Isle of Man in June 2007 as Epicure Qatar Equity Opportunities and was listed on AIM before moving to the Main Market of the London Stock Exchange in May 2011 and changing its name. It has been managed since inception by Epicure Managers Qatar, a wholly-owned subsidiary of Qatar Insurance Company (QIC) since 2012. QIF aims to achieve long-term capital growth by investing in Qatari companies and other GCC-listed companies. Its benchmark is the Qatar Exchange index, formerly known as the Doha Securities Market (DSM), which is a capitalisation-weighted index of the 20 largest and most liquid companies listed on the Qatar Exchange. Any one stock will have a maximum weighting of 15% within the index. The manager of QIF is Jubin Jose, who has worked at QIC since 2007. He holds a Master’s degree in economics and an MBA in finance from the Indian Institute of Finance. At the time of investment, no single position in a Qatar Exchange index constituent may exceed 15% of NAV or 125% of that constituent’s weighting in the index (maximum of 18.75%), whichever is greater. Non-index stocks are limited to 15% of NAV and up to 15% of NAV may be invested in shares in other GCC countries. No holding may exceed 5% of the shares outstanding in any one company. Gearing of up to 5% of NAV is permitted, but to date has not been used.
The fund manager: Jubin Jose
The manager’s view: Infrastructure spending driving growth
The manager remains positive on the outlook for economic growth in Qatar due to spending on infrastructure projects, population growth and a shift away from a dependence on hydrocarbon revenues. As a result, he believes Qatar is better positioned than other countries in the region to withstand a low oil price environment. It is the world’s largest producer of liquefied natural gas (LNG), and although contract pricing has been under some pressure, the country has maintained its market share and the long-term nature of contracts provides revenue visibility. Tourism is a big growth area within the economy; hotels are being built and occupancy is rising. Qatar is a favoured destination for Muslim visitors and also as a stopover for travellers en route to the Far East. The manager notes that although there has been a liquidity squeeze which is putting near-term pressure on the profitability of the banks, a lack of large write-downs suggests that there is not much stress in the system. In addition, government funding is in place during 2016, which should alleviate the liquidity squeeze. In the recent earnings season, the banks have posted strong results; an exception is Doha Bank, where the manager sold his position in late 2015. Loan growth is continuing, illustrating that companies are borrowing to execute on infrastructure projects.
FTSE Russell has reconfirmed that the Qatar Exchange will be upgraded from a frontier market to a secondary emerging market in two tranches in September 2016 and March 2017. The manager highlights that this could lead to c $850m of passive inflows into Qatar equities. In addition, the Qatar Exchange has proposed the introduction of margin trading for the 20 largest and most liquid equities. The manager believes that this will help to increase trading volumes. Since 2014, Qatari companies can now be 49% owned by foreigners, a significant increase from the prior limit of 25%.
Asset allocation
Investment process: Concentrated, trend-focused portfolio
The manager runs a concentrated portfolio of primarily Qatari equities focusing on companies with high growth potential, which are driven by diversification efforts by the government and infrastructure projects ahead of the 2022 FIFA World Cup. Elsewhere, the focus is on sectors with strong balance sheets, sustainable cash flows and stable dividend yields such as banking, transport and utilities; the manager seeks attractive valuations when looking for positions to add to the portfolio. Financial models are constructed for each company invested in. These are updated quarterly or when necessary due to a significant change in earnings outlook. The manager meets with company managements at least twice a year on a formal basis and is more interested in the quality of the management teams than whether a stock is represented in the index. Decisions to sell investments are taken when valuation targets are hit, if the model indicates a significant change in the company outlook, or if there is a substantive change in the business model, calling assumptions into question.
Current portfolio positioning
As at the end of March 2016, QIF had 21 holdings; 18 in Qatar and three in UAE (representing 3.8% of NAV; two banks and a real estate company). This compares to the end of 2015 when 17 positions were held, all in Qatari companies. The holdings in UAE companies were initiated as the manager believed that valuations in the country have become attractive; since purchase, these positions have added to the performance of the portfolio.
The portfolio remains overweight in the banking (and financial services) sector given continuing credit growth, a rising population, international expansion of Qatari banks and spending on infrastructure projects. However, exposure to the sector has declined over the last 12 months as the manager had concerns about profitability. Given recent better than expected earnings releases, the manager could increase exposure to the sector as business visibility improves. The weighting to industrials has increased and is the largest overweight versus the index. The largest company in the sector is Industries Qatar. Its product prices are under pressure as a result of the weak oil price, but the manager considered the fall in the share price to be an overreaction and so exposure to the stock was increased. A position in Qatar Electricity & Water was added to the portfolio following share price weakness. Consensus earnings growth for the next two years is in excess of 10% and the company has a growing dividend. Real estate is the largest underweight versus the benchmark due to not holding Ezdan, which represents c 15% of the index. This was a recent drag on performance due the strong share price performance of Ezdan, although the manager believes that its valuation is looking stretched.
Exhibit 3: Portfolio sector exposure vs benchmark (%)
Portfolio end March 2016 |
Portfolio end March 2015 |
Change |
Qatar Exchange index |
Active weight vs benchmark |
Trust weight |
|
Banks & financial services |
43.1 |
50.8 |
-7.7 |
39.0 |
4.1 |
1.1 |
Industrials |
27.6 |
15.2 |
12.4 |
19.2 |
8.4 |
1.4 |
Real estate |
9.1 |
8.8 |
0.3 |
22.0 |
-12.9 |
0.4 |
Transportation |
7.4 |
4.7 |
2.7 |
7.3 |
0.1 |
1.0 |
Telecoms |
6.1 |
3.7 |
2.4 |
6.1 |
0.0 |
1.0 |
Insurance |
3.4 |
6.9 |
-3.5 |
5.3 |
-1.9 |
0.6 |
Consumer goods & services |
0.0 |
2.6 |
-2.6 |
1.0 |
-1.0 |
0.0 |
Cash |
3.3 |
7.4 |
-4.1 |
0.0 |
3.3 |
N/A |
Source: Qatar Investment Fund, Edison Investment Research, Bloomberg. Note: Percentages may not add up to 100 due to rounding.
Performance: Longer-term outperformance
|
Exhibit 4: Investment trust performance to 29 April 2016 |
|
Price, NAV and benchmark total return performance, one-year rebased |
Price, NAV and benchmark total return performance (%) |
|
|
|
Source: Thomson Datastream, Edison Investment Research. Note: Three- and five-year performance figures annualised. |
|
As shown on page 1, over the last 12 months QIF’s NAV has fallen by 16.8%; the last year has been characterised as a volatile time in global stock markets with periods of risk aversion especially evident in the performance of emerging markets. In the three months ended 31 March 2016, QIF’s NAV (net of dividends) fell by 1.4%, while the benchmark Qatar Exchange was down 0.5%. The share price rose by 1.8% as a result of a narrowing of the discount to NAV. The Q116 NAV underperformance reflected not holding Ezdan, which rose by 14.5% during the period, and from the holding in Gulf International Services, which fell by 27.6% as a result of weaker than expected 2015 earnings following the collapse in the oil price. Looking at the longer-term performance in Exhibits 5 and 6, QIF has outperformed the benchmark over three and five years. As a reference point for UK shareholders, QIF has also significantly outperformed the FTSE All-Share index over these time periods.
|
Exhibit 5: Share price and NAV total return performance, relative to index (%) |
|||||||
|
One month |
Three months |
Six months |
One year |
Three years |
Five years |
|
Price relative to Qatar Exchange |
(1.8) |
(1.9) |
1.3 |
4.6 |
10.2 |
16.0 |
|
NAV relative to Qatar Exchange |
0.6 |
0.6 |
1.8 |
(0.7) |
6.1 |
13.1 |
|
Price relative to MSCI Emerging Markets |
(4.0) |
(5.1) |
(10.9) |
6.6 |
48.9 |
75.1 |
|
NAV relative to MSCI Emerging Markets |
(1.8) |
(2.7) |
(10.5) |
1.3 |
43.4 |
70.8 |
|
Price relative to FTSE All-Share |
(6.1) |
0.9 |
(6.1) |
(2.6) |
22.7 |
22.0 |
|
NAV relative to FTSE All-Share |
(3.9) |
3.4 |
(5.6) |
(7.5) |
18.2 |
19.0 |
|
|
Source: Thomson Datastream, Edison Investment Research. Note: Data to end-April 2016. Geometric calculation. |
|||||||
|
Exhibit 6: NAV performance relative to Qatar Exchange index over three years |
|||||||
|
|||||||
|
Source: Thomson Datastream, Edison Investment Research |
|||||||
Discount: A modestly narrowing trend
Over the last 12 months the shares have traded in a range to NAV of a 0.6% premium to a 20.0% discount, with an average discount over the year of 12.9%. This is narrower than the averages over the last three and five years (13.6% and 13.9% respectively), despite a weak oil price environment since mid-2014. Annual tender offers in November/December have a tendency to narrow the discount sharply in the short term, as can be seen in Exhibit 7.
|
Exhibit 7: Share price discount to NAV over three years (%) |
|
|
Source: Thomson Datastream, Edison Investment Research |
The discount is managed via regular share repurchases and tender offers. Tender offers are linked to the discount to NAV; every year when the average discount to NAV has been 10% or more shareholders are given the opportunity to vote for a graduated tender offer for up to a maximum of 15% of the shares outstanding at a 1% discount to formula asset value (net asset value minus the costs of undertaking the tender offer). If the annual average discount is 10-10.99%, up to 10% of shares outstanding may be tendered, 11% if the discount is 11-11.99% and so on up to the 15% maximum tender.
The average share price discount to NAV in the 12 months prior to the 8 October 2015 calculation date was 14.7%, so in accordance with the graduated tender proposed in April 2015, a tender offer for 14% of shares outstanding was proposed at an extraordinary general meeting on 12 November 2015. The proposal was passed and on 7 December 19.333m shares were tendered at a price of $1.3004 per share. Every three years, QIF has a vote on whether to discontinue the trust; the latest of these was in November 2015.
Capital structure and fees
QIF is a conventional investment trust with one class of share. There are currently 117.4m shares in issue, with a further 2.0m shares held in treasury. Gearing of up to 5% of NAV is permitted, but to date no borrowings have been used.
The annual management fee is 1.0% of NAV calculated monthly and payable quarterly in arrears; this is a reduction from 1.05% between 1 November 2013 and 1 November 2015 and 1.25% prior to 1 November 2013. There is a performance fee payable when QIF’s adjusted NAV (after dividends paid and received) exceeds the performance of the Qatar Exchange index subject to several conditions. The performance fee is 15% of the relative outperformance up to a limit of 1.5% of NAV. One of the main conditions affecting payment of the performance fee is that previous periods of underperformance must be deducted from the periods of outperformance, thus ensuring that only incremental outperformance is rewarded. No performance fees were paid in either of the last two financial years.
Dividend policy and record
QIF has an investment objective to achieve capital growth; however, it also aims to increase dividends each year, in the absence of exceptional market events. Qatar-listed companies are required by law to only pay dividends once a year. QIF bases its own dividend on the proportion of dividends received during the year, net of attributable costs. Undistributed income is added to revenue reserves to facilitate future progressive dividend payments. For financial year 2015, dividend income of $10.1m exceeded the dividend payment of $4.9m and expenses of $3.8m; a $0.04 dividend was announced, which was a 14% increase on the prior year. Based on the current share price, this represents a dividend yield of 3.7%.
Peer group comparison
There are no listed peers for QIF in the UK. The iShares MSCI Qatar invests specifically in Qatar and aims to track the index; it is listed in the US and between the end of June 2014 and the end of March 2016 (a period of oil price weakness as shown in Exhibit 2, right hand side), it fell by 4.6% in US dollar terms and rose by 13.3% in sterling terms. There are some open ended funds that invest more widely in the Middle East and Africa regions, a selection of which is highlighted in Exhibit 8. QIF has notably outperformed the weighted average for this peer group over three and five years.
For comparison, we have highlighted the performance of QIF versus the peer group of UK-quoted investment trusts that invest in emerging markets. In sterling terms, QIF has significantly outperformed the weighted average over three and five years. The trust also offers a higher dividend yield than the peer-group average (3.7% versus 2.3%).
Exhibit 8: Selected peer group as at 5 May 2016
% unless stated |
Market cap £m |
NAV TR 1 year |
NAV TR 3 year |
NAV TR 5 year |
Sharpe 1y (NAV) |
Sharpe 3y (NAV) |
Discount (ex-par) |
Ongoing charge |
Perf. fee |
Net gearing |
Dividend yield (%) |
Qatar Investment Fund |
87.5 |
(17.7) |
20.4 |
44.8 |
(0.9) |
0.4 |
(10.2) |
1.6 |
Yes |
97 |
3.7 |
Emerging markets average |
(7.5) |
(7.2) |
2.1 |
(0.8) |
(0.5) |
(11.2) |
1.6 |
94 |
3.0 |
||
Emerging markets wtd average |
(13.1) |
(9.6) |
(1.9) |
(1.0) |
(0.4) |
(9.5) |
1.3 |
104 |
2.3 |
||
Mutual funds |
|||||||||||
Baring MENA |
4.2 |
(17.0) |
5.8 |
35.9 |
|||||||
Fidelity Emerging EMEA |
100.1 |
(13.7) |
(8.1) |
(2.5) |
|||||||
Franklin MENA |
75.1 |
(22.6) |
12.3 |
21.8 |
|||||||
JPM Emerging Middle East Equity |
87.2 |
(14.9) |
(16.8) |
(4.1) |
|||||||
Simple average |
(17.1) |
(1.7) |
12.8 |
||||||||
Weighted average |
(16.7) |
(5.0) |
4.4 |
Source: Morningstar, Edison Investment Research. Note: All data in sterling. TR=total return. Sharpe ratio is a measure of risk-adjusted return. The ratios shown are calculated by Morningstar for the past 12- and 36-month periods by dividing a fund’s annualised excess returns over the risk-free rate by its annualised standard deviation. Net gearing is total assets less cash and equivalents as a percentage of net assets.
The board
There are four members on the board of QIF; all are non-executive. Chairman Nicholas Wilson has served since inception in 2007; he was appointed to the role of chairman in November 2012. He has more than 35 years’ experience in investment and sits on the boards of other public companies including RAB Special Situations Company and Epic Special Situations. Paul Macdonald is the senior non-executive director and a chartered accountant. He has a background in industry and private equity and is also chairman of PME African Infrastructure Opportunities. Leonard O’Brien is the only non-independent director as he is also a director of the investment manager. He is a chartered accountant with many years of experience in the fiduciary services industry. Neil Benedict is based in the US; he has more than 30 years’ experience of financial markets. He is a fellow of the Institute of Chartered Accountants in England and Wales.
|